Abstract
We investigate two barred galaxies with nuclear structures, NGC 6951 and NGC 7716, to examine whether they host slow bars. Using Gemini/GMOS long-slit spectroscopy, we calculate the bar pattern speed with the Tremaine–Weinberg method and detect kinematically decoupled nuclear disks in both galaxies. We also measure the bar length and strength using Pan-STARRs images and identify a nuclear ring in NGC 6951 and a nuclear bar in NGC 7716 from Hubble Space Telescope/Planetary Camera images. Our results indicate that NGC 6951 hosts a slow, long, and strong bar, which likely evolved through interactions with the dark matter halo and contributed to the formation of both the nuclear disk and ring. We also find hints of a rapidly rotating oval structure within the primary bar, although it is not clearly seen in the imaging data. In contrast, the primary bar in NGC 7716 is too weak to be classified as a barred galaxy, while its nuclear disk and nuclear bar are unusually large, possibly due to tidal interactions or the weakness of the primary bar. These findings suggest that slow bars may be more observed in galaxies with nuclear structures and highlight the often underappreciated role of galaxy interactions in bar evolution.
Original content from this work may be used under the terms of the Creative Commons Attribution 4.0 licence. Any further distribution of this work must maintain attribution to the author(s) and the title of the work, journal citation and DOI.
1. Introduction
Stellar bars are a common feature in galaxies, observed in approximately 60% of disk galaxies in the local Universe (G. de Vaucouleurs et al. 1991; K. Sheth et al. 2008; H. B. Ann et al. 2015; R. J. Buta et al. 2015; Y. H. Lee et al. 2019). Their widespread occurrence can be attributed to diverse formation pathways: bars can spontaneously emerge in isolated galaxies with cold disks due to stellar disk instabilities (A. Toomre 1964; J. P. Ostriker & P. J. E. Peebles 1973) or they can be induced by tidal interactions (T. Miwa & M. Noguchi 1998; E. L. Łokas et al. 2014, 2018; I. Martinez-Valpuesta et al. 2017; E. L. Łokas 2018; Y. Yoon et al. 2019).
In isolated systems, interactions between bars and dark matter halos are considered the primary driver of bar evolution. Most simulation studies suggest that as a result of dynamical friction with bulges or dark matter halos, bars gradually slow down over time, accompanied by an increase in both their length and strength (J. A. Sellwood 1980; V. P. Debattista & J. A. Sellwood 2000; E. Athanassoula 2002, 2003, 2014; D. Jang & W.-T. Kim 2023, 2024). These findings are further supported by cosmological hydrodynamical simulations based on ΛCDM, including the Evolution and Assembly of GaLaxies and their Environments (J. Schaye et al. 2015) and the IllustrisTNG (D. Nelson et al. 2019) simulations, which show that strong bars slow down rapidly and predominantly exhibit slow rotation at z ∼ 0 (D. G. Algorry et al. 2017; M. Roshan et al. 2021). On the other hand, the Auriga simulations (R. J. J. Grand et al. 2017), which involve more baryon-dominated galaxies, show that most bars remain fast down to z = 0 (F. Fragkoudi et al. 2021). This discrepancy also suggests that the dark matter halo may play a crucial role in bar evolution.
Therefore, in observations, measuring three parameters—the bar pattern speed, bar length, and bar strength—is critical for investigating the bar evolution: the bar pattern speed is determined through spectroscopic observations (S. Tremaine & M. D. Weinberg 1984; hereafter, the “TW method”), while the bar length and strength are derived from photometric data (K. Ohta et al. 1990; S. Jogee et al. 2004; E. Laurikainen et al. 2004; Y. H. Lee et al. 2019, 2020). Although the TW method was first introduced in the 1980s, to directly measure the bar pattern speed using long-slit spectroscopic observations covering multiple positions for a single galaxy (S. Tremaine & M. D. Weinberg 1984; S. M. Kent 1987; M. R. Merrifield & K. Kuijken 1995), it has recently become applicable to large samples of galaxies, thanks to the advent of Integral Field Spectroscopy, which allows multiple pseudo–long slits to be generated from a single observation (J. A. L. Aguerri et al. 2015; V. Cuomo et al. 2019a; R. Guo et al. 2019; L. Garma-Oehmichen et al. 2020, 2022; T. Géron et al. 2023).
However, observations have not confirmed the bar evolution driven by interactions with dark matter halos as predicted by simulations. The barred galaxies in the local Universe predominantly host fast bars (J. A. L. Aguerri et al. 2015; V. Cuomo et al. 2019a; R. Guo et al. 2019; L. Garma-Oehmichen et al. 2020, 2022). Moreover, bar evolution in terms of changes in the bar pattern speed, length, and strength has rarely been detected (I. Pérez et al. 2012; T. Kim et al. 2021; Y. H. Lee et al. 2022). These observational results have raised questions about the amount of dark matter in the Universe (M. Roshan et al. 2021; S. T. Nagesh et al. 2023; A. B. Romeo et al. 2023).
On the other hand, more recently, T. Géron et al. (2023) reported a large sample of slow bars, identifying 62% of 225 barred galaxies, based on data from the Mapping Nearby Galaxies at APO project (K. Bundy et al. 2015). Their sample is characterized by a significant number of weak bars, which tend to appear as slow bars. Similarly, using the Multi-Unit Spectroscopic Explorer (MUSE; R. Bacon et al. 2010), several slow bars are detected in dwarf barred galaxies, which are short or weak (C. Buttitta et al. 2022; V. Cuomo et al. 2022, 2024). These weak and slow bars may be better explained by galaxy interactions rather than by interactions with dark matter halos (V. Cuomo et al. 2022, 2024; T. Géron et al. 2023).
In interacting systems, bars are known to be born slow and remain slow throughout their evolution (T. Miwa & M. Noguchi 1998; E. L. Łokas et al. 2016; I. Martinez-Valpuesta et al. 2016, 2017; E. L. Łokas 2018). Recent studies suggest that this is likely because tidal interactions are the only way for galaxies with stable disks to form bars (Y. Zheng & J. Shen 2025), rather than being due to the bar slowdown caused by galaxy interactions (Ó. Jiménez-Arranz et al. 2024). Such bars inherently rotate more slowly than those formed in cold disks.
As a result, there is still a lack of slow-bar samples that have evolved through interactions with dark matter halos. In this study, we focus on measuring the bar pattern speeds in barred galaxies with complex nuclear structures, such as nuclear rings or nuclear bars. Theoretically, slow bars are related to the inner Lindblad resonance (ILR; M. P. Schwarz 1984; F. Combes & M. Gerin 1985; G. Byrd et al. 1994). As the bar pattern speed decreases, additional resonances appear sequentially, from the outer Lindblad resonance to the corotation radius (CR), then the ultraharmonic resonance and finally the ILR. Nuclear features, such as rings or bars, are thought to require the presence of the ILR (F. Combes & M. Gerin 1985; R. Buta 1986; G. Byrd et al. 1994; F. Combes 1996). Therefore, barred galaxies with nuclear rings or bars may serve as excellent candidates for detecting slow bars that have evolved through interactions with dark matter halos.
Here, we examine two barred galaxies, NGC 6951, with a nuclear ring, and NGC 7716, with a nuclear bar. These galaxies were chosen from the Atlas of Images of NUclear Rings (AINUR; S. Comerón et al. 2010), based on the geometric conditions necessary to measure bar pattern speeds using the TW method (S. Tremaine & M. D. Weinberg 1984; R. Guo et al. 2019). To determine the three key parameters of the bars, long-slit spectroscopic observations were conducted using Gemini-North/GMOS, and photometric images were obtained from the Hubble Space Telescope (HST) Wide Field Planetary Camera (WFPC) and the Pan-STARRs DR1 (PS1) archives. Throughout this paper, we use a Hubble constant of H0 = 68.4 km s−1 Mpc−1 based on the Plank 2015 results (Planck Collaboration et al. 2016).
This paper is organized as follows. Section 2 introduces the TW method for measuring the bar pattern speed and describes the long-slit observations. Section 3 represents the nuclear features of the target galaxies revealed by high-resolution photometry and spectroscopy. In Section 4, we analyze the bar properties, including the length (Rbar), strength (Sbar), pattern speed (Ωbar), CR (RCR), and rotation rate ( ). Finally, Sections 5 and 6 provide the discussion and conclusions, respectively.
2. Method and Observations
2.1. TW Method
The pattern speed of bars, Ωbar, is a fundamental quantity for understanding the dynamics and evolution of barred disk galaxies (J. Binney & S. Tremaine 1987; V. P. Debattista & J. A. Sellwood 2000). As of now, various methods have been proposed for measuring Ωbar, utilizing photometric, spectroscopic, or modeling techniques, each of which is based on distinct characteristics or assumptions. For instance, some approaches explore the relation between resonance locations and galaxy rings (E. Athanassoula et al. 1982; C. Muñoz-Tuñón et al. 2004; I. Pérez et al. 2012), while others examine the connection between periodic orbits and gas flow (T. S. van Albada & R. H. Sanders 1982; E. Athanassoula 1992). Additionally, variations in galaxy properties near the CR, RCR, have also been investigated, including changes in stellar population (I. Puerari & H. Dottori 1997; R. J. Buta & X. Zhang 2009; S. Scarano & J. R. D. Lépine 2013), spiral morphology (B. Canzian 1993; A. A. Marchuk et al. 2024), and streaming motion (J. Font et al. 2011, 2014). However, despite these advancements, consistent results across different methods remains elusive, making the reliable measurement of Ωbar difficult (V. S. Kostiuk et al. 2024; A. A. Marchuk et al. 2024).
Among these available methods, the TW method stands out as the only model-independent and direct approach for measuring Ωbar. It has been applied more extensively than any other method across a large number of galaxy samples (J. A. L. Aguerri et al. 2015; V. Cuomo et al. 2019a, 2022, 2024; R. Guo et al. 2019; L. Garma-Oehmichen et al. 2020, 2022; T. Géron et al. 2023). This method assumes a well-defined pattern speed and requires that tracers, such as stars, satisfy the continuity equation (S. Tremaine & M. D. Weinberg 1984). Ωbar is derived from the line-of-sight velocity distribution (LOSVD) through multiple long-slit spectroscopic observations, as shown in the bottom panels of Figure 1, where the slit positions are marked in red. The slits are positioned along the major axis of the disk, spanning across the bar. For each slit, when the luminosity-weighted velocity and position are integrated, the contributions from the disk are canceled out, leaving only the asymmetries introduced by the bar, which provide information about the rotation of the bars (Y. Zou et al. 2019). Further details will be discussed in Section 4.2.
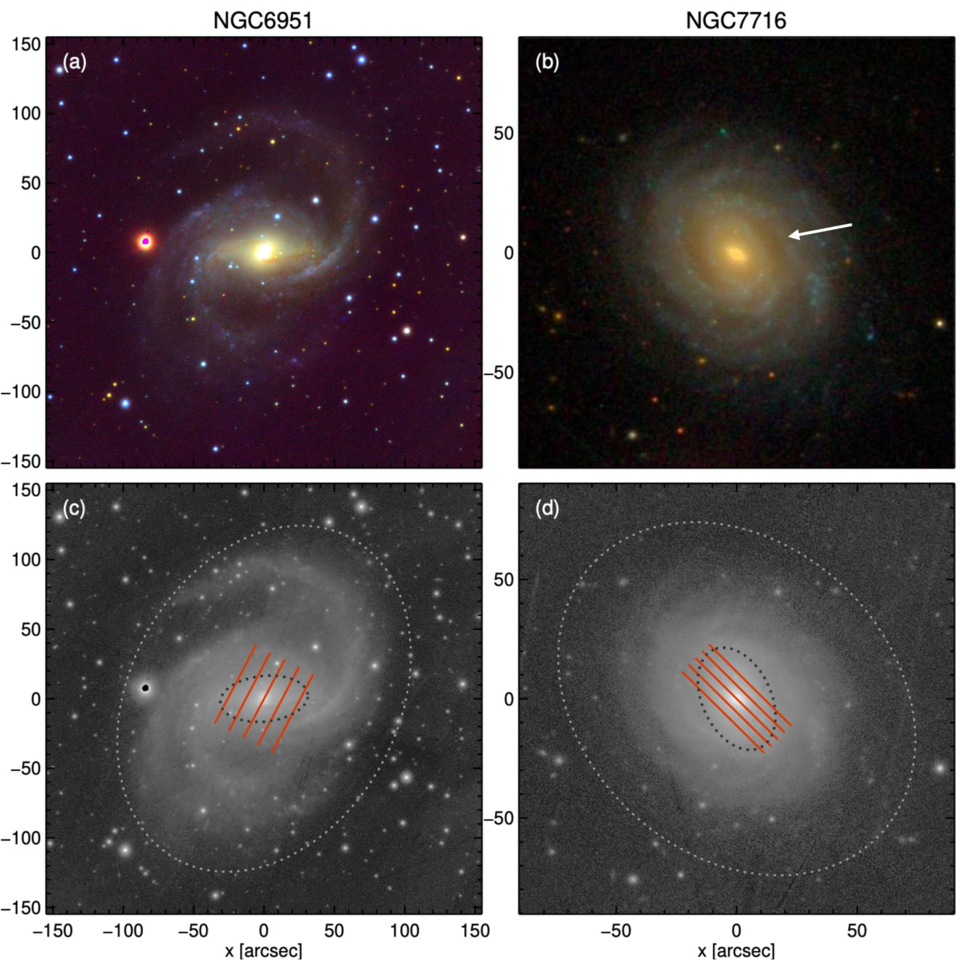
Figure 1. Color images of the target galaxies are shown in the top panels: NGC 6951 (left) from PS1 and NGC 7716 (right) from SDSS. The white arrow in NGC 7716 (panel (b)) indicates the bar identified in some previous studies (J. H. Knapen et al. 2006; S. Comerón et al. 2010), but the initial classification describes a weak bar surrounded by the inner ring (G. de Vaucouleurs & R. Buta 1980). The bottom panels display the shapes of the disks and bars, constructed using the PA and ellipticity from BarIstA, with large and small gray dotted ellipses overlaid on the PS1 i-band images. The red lines indicate the positions of five long slits, aligned with the major axes of the disks, and their lengths correspond to regions where the S/N exceeds 3 per pixel in the observations.
Download figure:
Standard image High-resolution image2.2. Target Selection and Orientation Parameters
We selected our target galaxies from the AINUR catalog (S. Comerón et al. 2010), which includes 107 nearby galaxies identified as hosting nuclear rings. These galaxies, located within 80 Mpc, are well suited for detailed studies of nuclear structures using high-resolution HST images. From the 78 barred galaxies, we chose two targets, NGC 6951 and NGC 7716, as shown in Figure 1, which satisfy the following criteria and have observational visibility. The selection criteria required galaxies to have a moderate inclination of 20° < i < 60° and an offset between the position angles (PAs) of the bar and the disk, with 10° < ∣PAdisk − PAbar∣ < 80° (J. A. L. Aguerri et al. 2015; V. Cuomo et al. 2019a; R. Guo et al. 2019; Y. Zou et al. 2019; L. Garma-Oehmichen et al. 2020). These are the necessary geometric conditions for applying the TW method, avoiding configurations where bar contributions appear symmetric with respect to the disk (Y. Zou et al. 2019).
Therefore, accurate measurements of the galaxy disk orientation parameters (PAdisk and ellipticity, disk) as well as PAbar are essential for selecting targets. In particular, errors in PAdisk are the dominant source of systematic uncertainty in the application of the TW method (V. P. Debattista 2003; Y. Zou et al. 2019; L. Garma-Oehmichen et al. 2020), and, more generally, inaccurate orientation parameters significantly affect the bar property measurements, including the bar length, strength, and pattern speed (S. Comerón et al. 2010; L. Garma-Oehmichen et al. 2020; Y. H. Lee et al. 2020; T. Géron et al. 2023). This issue becomes especially critical when dealing with large samples, where inaccurate orientation parameters can lead to the misclassification of bars or introduce major uncertainties in the bar property measurements (Y. H. Lee et al. 2020). However, by visually inspecting the variation of isophotes for each galaxy, potential misjudgments can be significantly reduced.
Orientation parameters are typically derived from isophotes in the sky plane using ellipse fitting (S. Jogee et al. 2002; S. Laine et al. 2002; J. A. L. Aguerri et al. 2015; V. Cuomo et al. 2019a; R. Guo et al. 2019). In previous studies, the reference isophote has been chosen in different ways, such as using the 25 mag arcsec−2 surface brightness contour (S. Jogee et al. 2002; S. Laine et al. 2002; Y. H. Lee et al. 2019) or averaging over the disk region where the PA and appear roughly constant (V. Cuomo et al. 2019a, 2019b). In this study, we determined the orientation parameters of the galaxy disks and PAbar by performing an IDL-based ellipse fitting on sky-subtracted PS1 i-band images with bright stars masked, using the Bar Image astro-Arithmometer (BarIstA;9
Y. H. Lee et al. 2019, 2020). The masking was performed automatically using a built-in BarIstA routine, which identifies and removes foreground stars or nearby galaxies by analyzing the spatial variation in brightness across the image. The disk orientation parameters were measured as the mean PA and
within the radial range where both profiles remain approximately constant. The inclination was derived from the mean
using
 , and PAbar was measured at the radius of maximum
 . The isophotes used for the disk and the bar are shown as the large and small gray dotted ellipses, respectively, in the bottom panels of Figure 1. These measurements, along with the basic properties of the target galaxies, are listed in Table 1. The standard deviations of PAdisk within this selected region are 1
 7 for NGC 6951 and 1
 3 for NGC 7716 and are adopted as the uncertainties in the PA measurements.
Table 1. Properties of Target Galaxies
| Galaxy | R.A. | Decl. | vsys | Distance | Morphology | PAdisk | PAbar | Incl. |
|---|---|---|---|---|---|---|---|---|
| (hh mm ss) | (deg arcmin arcsec) | (km s−1) | (Mpc) | (deg) | (deg) | (deg) | ||
| (1) | (2) | (3) | (4) | (5) | (6) | (7) | (8) | (9) |
| NGC 6951 | 20 37 14 | +66 06 20 | 1411 ± 2 | 20.6 | SAB(rs)bc | 152.5 ± 1.7 | 96.0 | 43.0 |
| NGC 7716 | 23 36 31 | +00 17 50 | 2556 ± 2 | 37.4 | SAB(r)b | 45.0 ± 1.3 | 24.8 | 38.2 |
Notes. Column (1): galaxy name. Columns (2) and (3): position on the sky in J2000.0 coordinates. Columns (4) and (5): heliocentric systemic velocity and distance measured in this study. Columns (6), (7), (8), and (9): morphological type from NASA/IPAC Extragalactic Database, PAs of the disk and bar, and inclination measured in this study. The PA is measured from north to east.
Download table as: ASCIITypeset image
2.3. Gemini/GMOS Long-slit Observations and Data Reduction
NGC 6951 and NGC 7716 were observed using long-slit spectroscopy with the GMOS instrument on Gemini-North (Program ID: GN-2023B-Q-303; PI: Y. H. Lee). Since the field of view of GMOS in Integral Field Unit mode is limited to 5″ × 7″, we adopted the long-slit mode to achieve spatially resolved spectroscopy over a wider area. For each galaxy, five slits were positioned along the major axis of the disk for each galaxy, as shown in red in the bottom panels of Figure 1: one at the center and four symmetrically placed across the bar. For NGC 6951, the slits were aligned at a PA of 152 5 along the disk major axis, offset by
  across the bar major axis. For NGC 7716, the slits were aligned with a PA of 225
 0, with offsets of
  .
.
The TW method requires a wavelength window free of strong emission lines in order to trace the stellar kinematic signal reliably (V. Cuomo et al. 2024). Absorption features such as the Mg I triplet (5167, 5173, and 5184 Å) have been commonly used for this purpose (V. Cuomo et al. 2019b, 2024; C. Buttitta et al. 2022). Recently, V. Cuomo et al. (2024) demonstrated that the Ca II triplet (8498, 8542, and 8662 Å) yields consistent results with those obtained using the Mg I triplet, showing that the TW method provides robust measurements regardless of the choice of absorption lines. Considering the grating efficiency and spectral resolution of GMOS, we selected the Ca II region and used the R831 grating centered at 8600 Å, covering a wavelength range of 7411–9892 Å. A slit width of  was employed, yielding a spectral resolution of ∼2900, corresponding to an FWHM of ∼ 3 Å at 8600 Å. The long slit spans a length of
  , with a spatial sampling of 0
 1614 pixel−1. Given the observational conditions,10
we achieved a signal-to-noise ratio (S/N) of ∼3 in regions with
1614 pixel−1. Given the observational conditions,10
we achieved a signal-to-noise ratio (S/N) of ∼3 in regions with 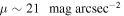 , indicated by the lengths of the red lines in the bottom panels in Figure 1. This slit length is sufficiently long to obtain a reliable Ωbar, which will be discussed in Section 4.2. The exposure times per slit were 5300 and 5425 s for NGC 6951 and NGC 7716, respectively, totaling approximately 7.5 hr for each galaxy.
We reduced the data using the Data Reduction for Astronomy from Gemini Observatory North and South (Dragons) software (K. Labrie et al. 2019), incorporating bias subtraction, flat-field correction, and wavelength calibration using arc exposures. Flux calibration was achieved using standard star observations. The exposures were dithered along the spectral directions, and the final 2D exposures were combined to remove artifacts and bad pixels.
Figure 2 shows the velocity profiles derived from the five long-slit spectra for NGC 6951 (left panel) and NGC 7716 (right panel). From top to bottom, the panels correspond to the slits arranged from left to right in the bottom panels of Figure 1. The spectra have been sky-subtracted and Voronoi-binned along the spatial direction to achieve S/N > 3 (M. Cappellari & Y. Copin 2003). Velocities were measured by fitting Gaussian profiles to the Ca II triplet lines, with uncertainties estimated using chi-square minimization. We will discuss these results in Section 4.2.2.
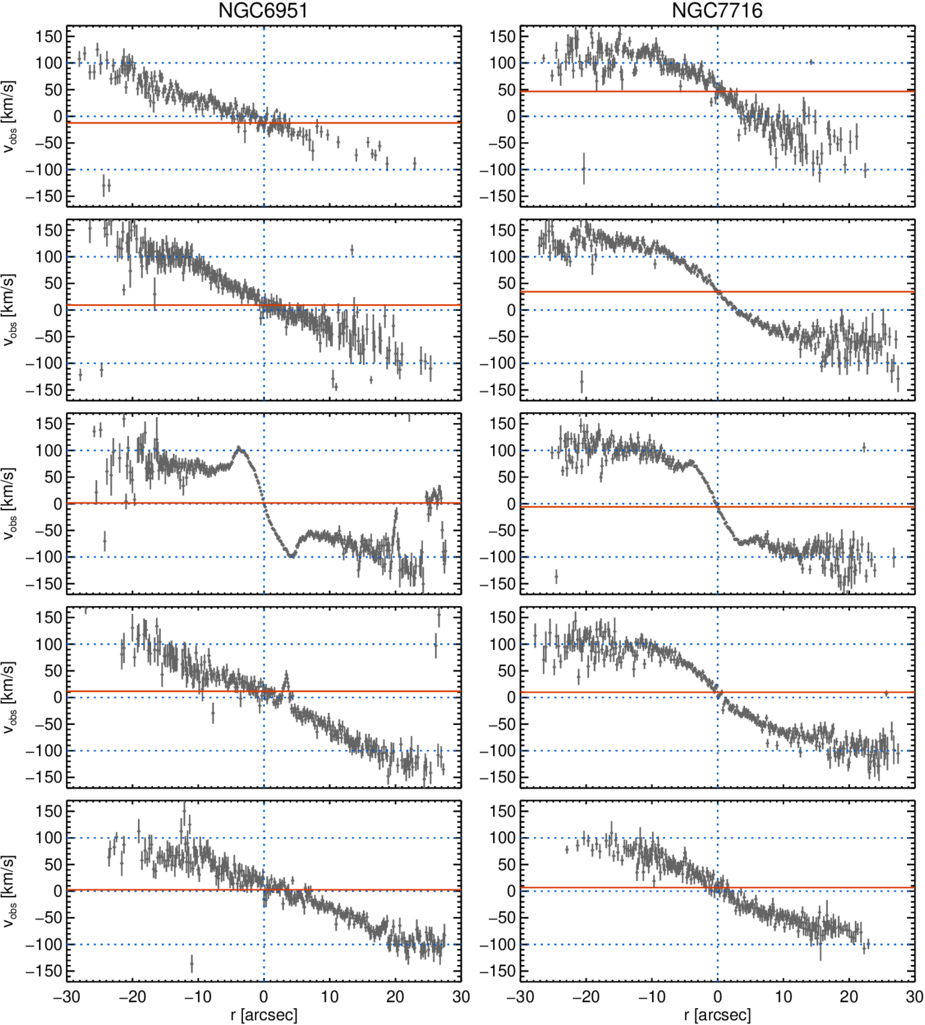
Figure 2. Profiles of observed velocity from five long-slit spectra for NGC 6951 (left) and NGC 7716 (right). From top to bottom, the panels correspond to the slits positioned from left to right in the bottom panels of Figure 1, with the third panels representing the slits along the major axes of each galaxy. The velocities are derived by fitting Gaussian profiles to the Ca II triplet lines in Voronoi-binned spectra, ensuring S/N > 3. The uncertainties are estimated using chi-square minimization. The blue dotted and red solid lines are included as visual guides for comparison, with the red solid lines representing the mean velocities within the central 5 pixels of the third slits for each galaxy along the major axes.
Download figure:
Standard image High-resolution image3. Nuclear Structures
3.1. Nuclear Features from Photometry
We examine the nuclear features of the target galaxies using HST/WFPC F606W images, which offer high spatial resolution, with a pixel scale of  for WF (left panel) and
  for PC (right panel), as shown in Figure 3. To highlight the nuclear structures, we apply unsharp mask processing (bottom panels), a technique that enhances detail and contrast by dividing the original image with its smoothed version (D. F. Malin 1977; D. F. Malin et al. 1983; P. Erwin & L. S. Sparke 2003; P. Erwin 2004). This approach effectively suppresses the large-scale smoothed light distribution while amplifying faint and low-contrast features. The smoothed images were generated using 10″ sized boxes for the WF images and 5″ sized boxes for the PC images.
Figure 3. Nuclear structures of NGC 6951 (left two columns) and NGC 7716 (right two columns) observed in F606W images from the HST WF (left) and PC (right) cameras. The bottom panels highlight the nuclear features using unsharp mask processing, corresponding to each of the top four panels. The images reveal a nuclear ring and bar, as well as inner rings that surround the bar structures.
Download figure:
Standard image High-resolution imageThe nuclear ring of NGC 6951 is clearly resolved in both the PC image (Figure 3(b)) and the unsharp masked image (Figure 3(f)), consistent with previous studies (H. Wozniak et al. 1995; D. Friedli et al. 1996; J. H. Knapen et al. 2006). NGC 7716 displays a nuclear bar within the inner ring in the PC image (Figure 3(d)), with this feature further accentuated in the unsharp masked image (Figure 3(h)). This observation aligns with earlier studies that classified NGC 7716 as a double-barred galaxy (S. Laine et al. 2002; P. Erwin 2004).
We further analyze the nuclear structures using the HST/PC images by fitting ellipses with BarIstA (Y. H. Lee et al. 2019, 2020), as shown in Figure 4. The three bottom panels show the radial profiles of intensity, ellipticity, and PA, from top to bottom. First, the sizes of the nuclear ring and nuclear bar are identified as the locations of maximum ellipticity in the ellipticity profile (P. Martin 1995; H. Wozniak et al. 1995; S. Jogee et al. 2004), marked by the red solid lines. The corresponding ellipses are overlaid with red solid lines on the HST/PC unsharp masked image in the top panel. In our target galaxies, the sizes of the nuclear structures determined by the maximum ellipticity are likely underestimated compared to those estimated from visual inspection, as similarly found in previous studies (E. Laurikainen et al. 2002; P. Erwin & L. S. Sparke 2003; J. A. L. Aguerri et al. 2009). To mitigate this effect, we also indicate the sizes of the nuclear structures as the radius with minimum ellipticity for NGC 6951 and as the radius identified through visual inspection for NGC 7716. These are represented by the red dotted lines.
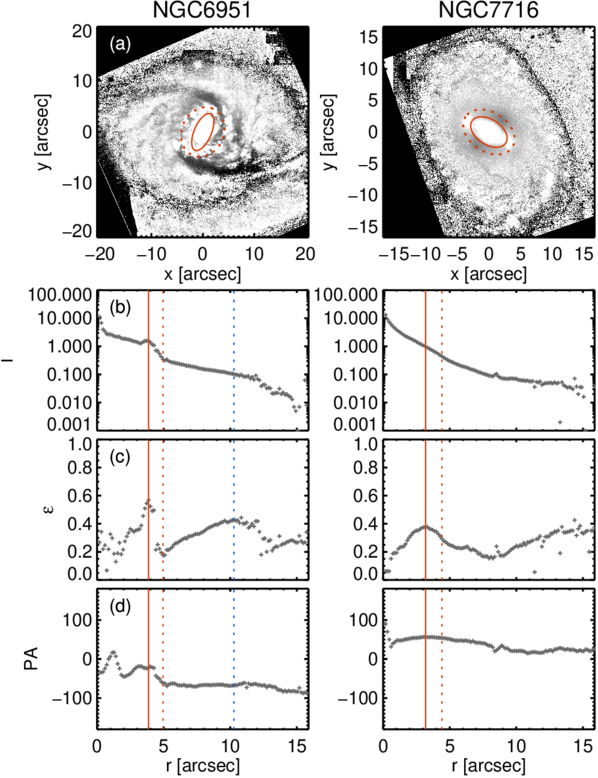
Figure 4. Nuclear structures of NGC 6951 (left) and NGC 7716 (right) analyzed with BarIstA for ellipse fitting on HST/PC images. The top panel shows the unsharp masked images of the HST/PC images, with the nuclear ring in NGC 6951 and the nuclear bar in NGC 7716 outlined by the red ellipses. The bottom three panels represent the radial profiles of intensity, ellipticity, and PA, from top to bottom. The red solid lines indicate the sizes of the nuclear structures determined from the maximum ellipticity, which tend to underestimate the sizes compared to visual inspection. The red dotted lines indicate the size identified at the radius with minimum ellipticity for NGC 6951 and that determined through visual inspection for NGC 7716. These sizes are shown as ellipses in the top panels. An additional bar-like signature at  in NGC 6951 is indicated by the blue dotted lines, which will be discussed in Sections 4 and 5.
Download figure:
Standard image High-resolution imageThe sizes of the nuclear structures are then deprojected and summarized in Table 2. The deprojected radii can be estimated using the following relation:

where robs is the observed radius, ϕ is the angle between the major axis of the nuclear structures and that of the galaxy disk, and i is the inclination of the galaxy (P. Martin 1995; D. A. Gadotti et al. 2007). However, the values of rdeproj and robs for our target galaxies are nearly identical, as the nuclear structures are closely aligned with the major axes of their respective main disks.
Table 2. Measurements of the Galactic Structures
| Galaxy | Unit | Nuclear Substructure | Nuclear Disk | Bar Length | Bar Strength | Disk | ||||||
|---|---|---|---|---|---|---|---|---|---|---|---|---|
| (RNR, RNB) | (RND) | (Rbar) | (Sbar) | |||||||||
| R | Rvisual | Rkin | v/σ | R | RA2 | RQb |

| A2 | Qb | R25 | ||
| NGC 6951 | arcsec | 3.9 | 5.0 | 5.9 | 2.8 | 40.0
| 47.7
| 44.9
| 0.55 | 0.42 | 0.36 | 126.7 |
| kpc | 0.39 | 0.49 | 0.59 | ⋯ | 3.92
| 4.77
| 4.49
| ⋯ | ⋯ | ⋯ | 12.66 | |
| NGC 7716 | arcsec | 3.2 | 4.5 | 6.5 | 2.1 | 24.5
| 17.5
| 17.8
| 0.28 | 0.13 | 0.07 | 61.4 |
| kpc | 0.58 | 0.81 | 1.16 | ⋯ | 4.30
| 3.18
| 3.22
| ⋯ | ⋯ | ⋯ | 11.12 | |
Note. The sizes of the structures are represented by RNR, RNB, RND, and Rbar, corresponding to a nuclear ring, nuclear bar, nuclear disk, and primary bar, respectively. The subscripts in the third row indicate the measurement methods used. The nuclear structures of NGC 6951 and NGC 7716 are a nuclear ring (NR) and a nuclear bar (NB), respectively.
Download table as: ASCIITypeset image
Last, we note that NGC 7716 was selected from the AINUR catalog, which compiled galaxies with nuclear rings (S. Comerón et al. 2010). Historically, G. de Vaucouleurs & R. Buta (1980) identified NGC 7716 as hosting an inner ring. However, subsequent studies reclassified this structure as a nuclear ring, due to the detection of a larger bar extending beyond the radius of the ring (J. H. Knapen et al. 2006; L. M. Mazzuca et al. 2008). This reclassification is why NGC 7716 is included in the AINUR catalog (S. Comerón et al. 2010).
However, considering the bar length of 33″ reported in the AINUR catalog, the winding spiral arms, filled with a reddish hue and indicated by the white arrow in Figure 1(b), could have been interpreted as the bar. The deprojection using the orientation parameters from the catalog further accentuates this feature. This serves as a representative example of how erroneous orientation parameters can significantly affect the measurement of the bar length and strength, as discussed in Section 2.2. In contrast, the parameters we derived suggest that NGC 7716 hosts a weak bar (18″ in length, measured using the same method as in the AINUR catalog), surrounded by an inner ring, with a nuclear bar at its central region, as shown in Figure 3(h). Further details will be discussed in Sections 4 and 5.2.
3.2. Nuclear Features from Spectroscopy
The LOSVDs can be modeled using Gauss–Hermite functions with four parameters: stellar velocity (v), velocity dispersion (σ), and the asymmetric (h3) and symmetric (h4) deviations from a Gaussian (R. P. van der Marel & M. Franx 1993). These parameters serve as powerful tools for understanding the stellar structures in galaxies (D. A. Gadotti et al. 2020). To derive these stellar kinematics, we applied penalized pixel fitting (pPXF; M. Cappellari & E. Emsellem 2004; M. Cappellari 2017) to the sky-cleaned long-slit spectra obtained along the major axes of the disks. These spectra are the same as those used in the third panels of Figure 2, but are Voronoi-binned to achieve S/N ≥ 20 (M. Cappellari & Y. Copin 2003). We used the wavelength range of 8500–8750 Å, which covers the Ca II triplet lines at z < 0.01 for our target galaxies, while masking the 8630–8670 Å region to remove instrumental noise. The best-fit templates were constructed using the E-MILES library of stellar spectra (A. Vazdekis et al. 2016). The uncertainties were estimated using Monte Carlo simulations with 100 iterations.
Figure 5 presents vrot, σ, h3, h4, and v/σ, from top to bottom. The rotation curves (Figure 5(a)) are derived from the observed stellar velocity as follows:

where vrot, vobs, and vsys represent the rotation velocity, observed velocity, and systemic velocity, respectively, while i denotes the inclination of the galaxy. vsys was determined at the kinematic center, identified as the point where the velocity curve exhibits approximate symmetry between the approaching and receding sides, yielding 1414 ±2 km s−1 for NGC 6951 and 2576 ±2 km s−1 for NGC 7716. The heliocentric systemic velocities and distances of these galaxies are summarized in Table 1. The velocity dispersion (Figure 5(b)) is determined after correcting for instrumental broadening during the pPXF process. The deprojected sizes of the nuclear structures are represented as the red dotted vertical lines, as measured in Section 3.1.
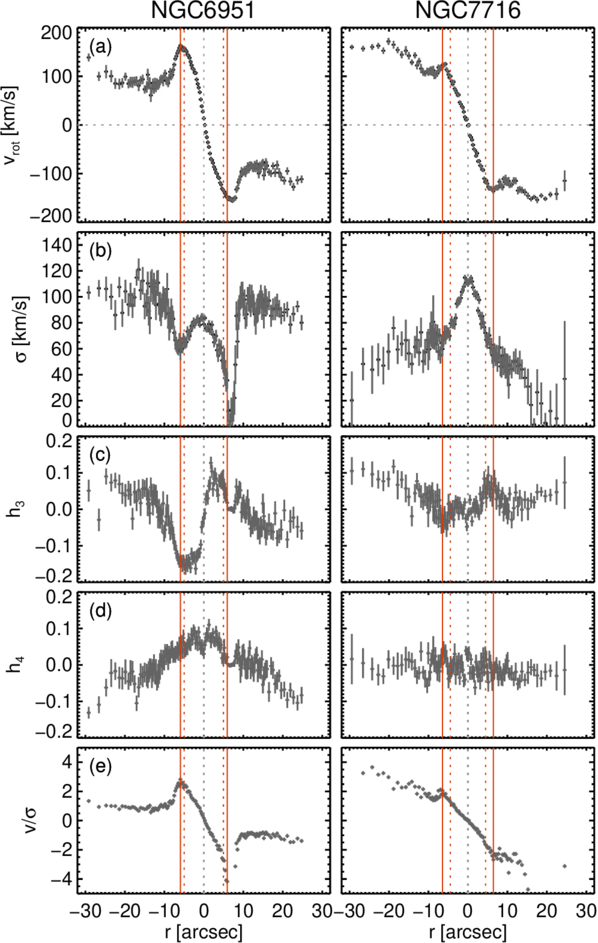
Figure 5. Profiles of the stellar velocity (vrot), velocity dispersion (σ), the asymmetric (h3) and symmetric (h4) deviations from a Gaussian, and v/σ for NGC 6951 (left) and NGC 7716 (right), arranged from top to bottom. All kinematic information is derived by applying pPXF to long-slit spectra aligned with the major axes of the disks. The uncertainties are estimated using Monte Carlo simulations with 100 iterations. The red solid lines represent the kinematic radius (Rkin) of the nuclear disk, while the red dotted lines indicate the deprojected sizes (rdeproj) of the nuclear ring in NGC 6951 and the nuclear bar in NGC 7716. The gray dotted lines mark the kinematic centers of galaxies.
Download figure:
Standard image High-resolution imageThe complex nuclear structures of our target galaxies are clearly evident across all kinematic profiles presented in Figure 5. The top panels show that the vrot profiles exhibit peaks around the nuclear structures, as indicated by the red vertical lines. These characteristics likely suggest the presence of dynamically decoupled components within the galaxies (E. Emsellem et al. 2001). Such components are typically identified by a sudden change in v, a drop in σ, an anticorrelation between h3 and v, or elevated values of h4 (E. Emsellem et al. 2001; H. Wozniak et al. 2003; A. Chung & M. Bureau 2004; J. Falcón-Barroso et al. 2006; D. A. Gadotti et al. 2020). These signatures of dynamically decoupled components are evident in both of our target galaxies.
The left panel of Figure 5(b) shows a broad decrease in the central region of the σ profile in NGC 6951, indicating the presence of a rotationally supported structure, a nuclear cold disk (H. Wozniak et al. 2003; H. Wozniak & N. Champavert 2006; D. A. Gadotti et al. 2020). While the central region of the σ profile in NGC 7716 (right panel) initially appears as a peaked nucleus, the zoomed-in profile in Figure 6 reveals a flat central region, characteristic of a σ-drop (J. Méndez-Abreu et al. 2014). A σ-drop typically appears as a flat section or a dip in the central region of the σ profile (E. Emsellem et al. 2001; I. Pérez et al. 2009; J. Méndez-Abreu et al. 2014). Meanwhile, the upturn observed within the σ-drop in NGC 6951 may be attributed to kinematically hot spheroids or large-scale outflows driven by active galactic nucleus (AGN) activity (I. Márquez et al. 2003; I. Pérez et al. 2009; A. Bittner et al. 2020). We note that NGC 6951 has been classified as either a Seyfert 2 galaxy (L. C. Ho et al. 1997) or a low-ionization nuclear emission-line region galaxy (T. Storchi-Bergmann et al. 2007).
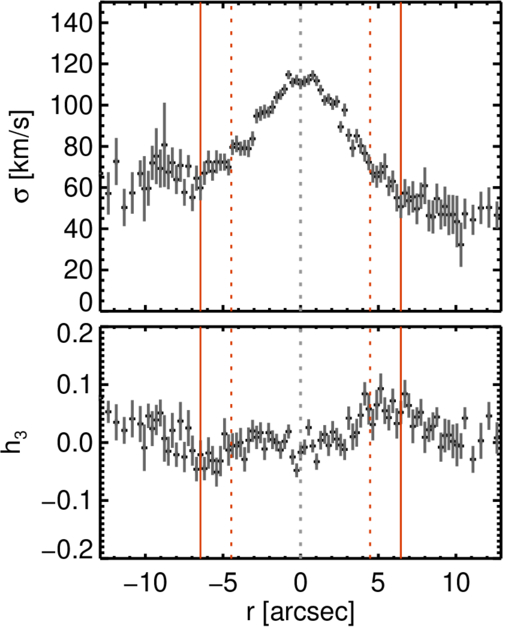
Figure 6. Zoomed-in profiles of σ (top) and h3 (bottom) for NGC 7716. The σ profile in the top panel appears flat in the central region, a characteristic of a σ-drop, while the h3 profile in the bottom panel shows an anticorrelation with vrot (the right panel in Figure 5(c)). The uncertainties are estimated using Monte Carlo simulations with 100 iterations. The vertical lines correspond to those in Figure 5.
Download figure:
Standard image High-resolution imageAdditionally, near-circular orbits are characterized by an anticorrelation between h3 and v, while elongated orbits exhibit a positive correlation between the two (A. Chung & M. Bureau 2004; M. Bureau & E. Athanassoula 2005; F. Iannuzzi & E. Athanassoula 2015; D. A. Gadotti et al. 2020). In both galaxies, we observe an anticorrelation between h3 (Figure 5(c)) and vrot (Figure 5(a)), which further supports the presence of a nuclear stellar disk. A zoomed-in view of the h3 profile of NGC 7716 is also shown in Figure 6. The small distortion in the central region of h3 in NGC 7716 could be attributed to the presence of the nuclear bar. In the case of NGC 6951, the elevated h4 (Figure 5(d)) further suggests the superposition of structures with distinct LOSVDs (R. Bender et al. 1994; D. A. Gadotti et al. 2020).
As a result, the kinematic profiles of both target galaxies consistently indicate the presence of dynamically decoupled nuclear stellar disks. The v/σ profile in Figure 5(e) provides the kinematic radius of the nuclear disk (Rkin), where the profile peaks due to the rapidly rotating disk (D. A. Gadotti et al. 2020). We present Rkin as the red vertical solid lines across all profiles in Figures 5 and 6, and we summarize both Rkin and the corresponding v/σ values at Rkin in Table 2. In our observations, both a nuclear ring and a nuclear bar, as indicated by the red dotted lines, are located within Rkin. Further discussion on the nuclear disk will be provided in Sections 5.1 and 5.2.
4. Bar Properties
Bars are typically characterized by three main parameters: the bar length, strength, and pattern speed (J. A. L. Aguerri et al. 2015), all of which are crucial for studying bar evolution. In this study, we measure the bar length and strength using i-band images obtained from the PS1 archive and calculate the bar pattern speed using the Gemini/GMOS long-slit spectra described in Section 2.3.
4.1. Bar Length and Strength
The bar length and strength were initially estimated through visual inspection (P. Nilson 1973; G. de Vaucouleurs et al. 1991; H. B. Ann et al. 2015; R. J. Buta et al. 2015), a practice still widely used thanks to contributions from citizen scientists participating in the Galaxy Zoo project (C. J. Lintott et al. 2008; K. L. Masters et al. 2011; B. D. Simmons et al. 2014, T. Géron et al. 2025). More recently, this visually driven approach has evolved into a scalable framework through machine learning trained on Galaxy Zoo classifications. Machine learning methods have shown remarkable performance in processing large-scale survey data, including those from the Dark Energy Spectroscopic Instrument (DESI; T. Géron et al. 2023; M. Walmsley et al. 2023).
On the other hand, automated techniques have also been developed to analyze the bar length and strength, enabling quantitative measurements and serving as powerful tools for detailed investigation of bar structures. To this end, we adopted three widely used methods: ellipse fitting (P. Martin 1995; H. Wozniak et al. 1995; S. Jogee et al. 2004), Fourier analysis (K. Ohta et al. 1990; E. Laurikainen et al. 2002, 2004), and the force ratio map (R. Buta & D. L. Block 2001; E. Laurikainen & H. Salo 2002; S. Díaz-García et al. 2016; Y. H. Lee et al. 2020). The bar lengths obtained from these methods are defined as R,
 , and
, and  , respectively, while the bar strengths are characterized by
  , A2, and Qb. Ellipse fitting and Fourier analysis are described in detail in Y. H. Lee et al. (2019), while the force ratio map method is explained in Y. H. Lee et al. (2020).
We applied all three methods using BarIstA (Y. H. Lee et al. 2019, 2020) on sky-subtracted PS1 i-band images. Figures 7 and 8 illustrate the procedure for measuring the bar length and strength. The observed image (panel (a)) was masked and deprojected, based on the orientation parameters listed in Table 1, as outlined by the gray dotted ellipses. The resulting image is shown in panel (b), where the disk outline has been transformed into a perfect circle. The red ellipse traces the bar identified through ellipse fitting, while the four crosses mark the four corners of the bar structure determined using the force ratio map, as detailed below.
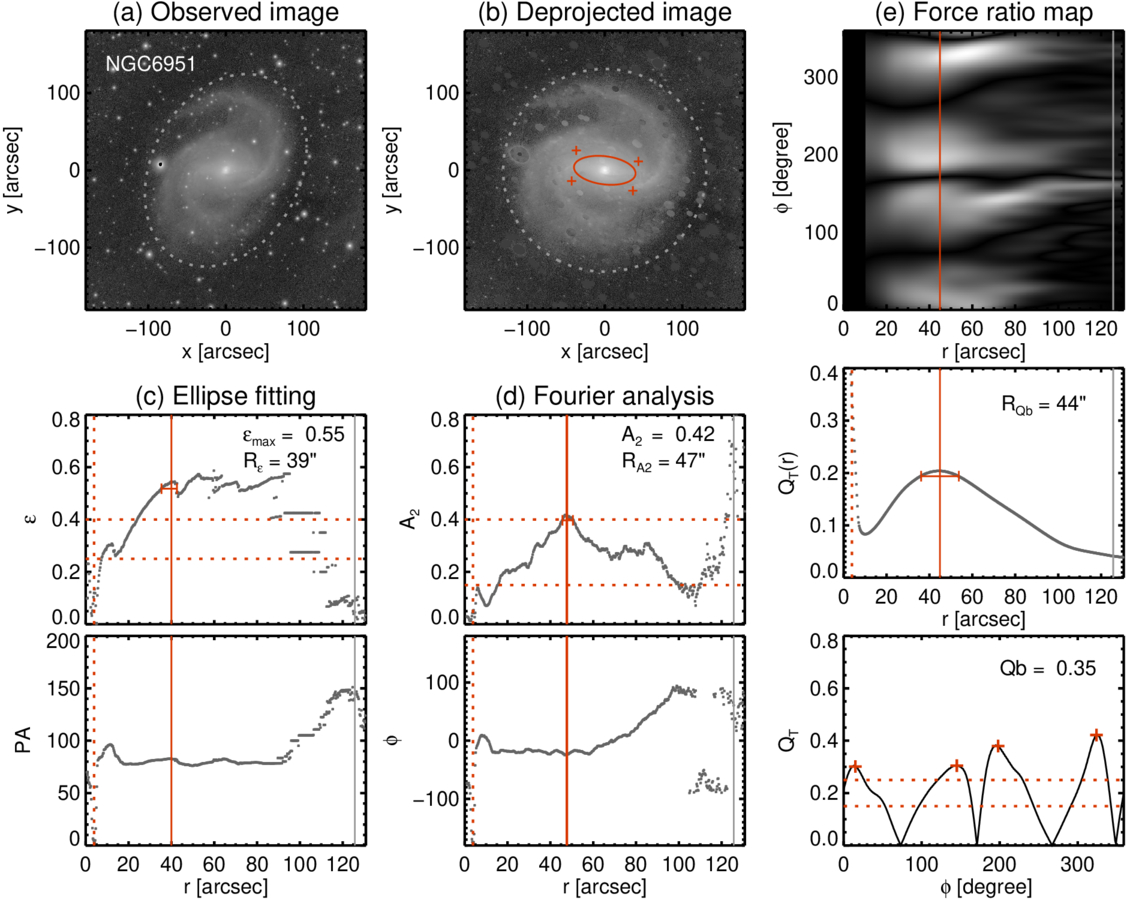
Figure 7. Procedure for measuring the bar length and strength of NGC 6951 using the three main methods with BarIstA. (a) i-band observed image from PS1; (b) deprojected image using orientation parameters; (c) ellipse-fitting method—ellipticity (top) and PA (bottom) profiles; (d) Fourier analysis—A2 (top) and ϕ (bottom) profiles; and (e) force ratio map method—force ratio map in polar coordinates (r, ϕ; top), QT radial profile (middle), and azimuthal profile at RQb (bottom). Disk shapes based on orientation parameters are overlaid by gray dotted lines in panels (a) and (b). The measured bar lengths and strengths are listed in the relevant panels. The red solid lines indicate the bar length, while the red horizontal dotted lines represent the criteria for defining weakly and strongly barred galaxies, respectively. The four red crosses mark the four corners of the bar structure in panel (b) and the bottom panel of (e). The errors in the bar lengths are indicated by the horizontal error bars in the middle row. The red vertical dotted lines indicate the deprojected size of the nuclear ring, as measured through ellipse fitting from the HST/PC image in Section 3. R25 is indicated by the gray vertical solid lines.
Download figure:
Standard image High-resolution image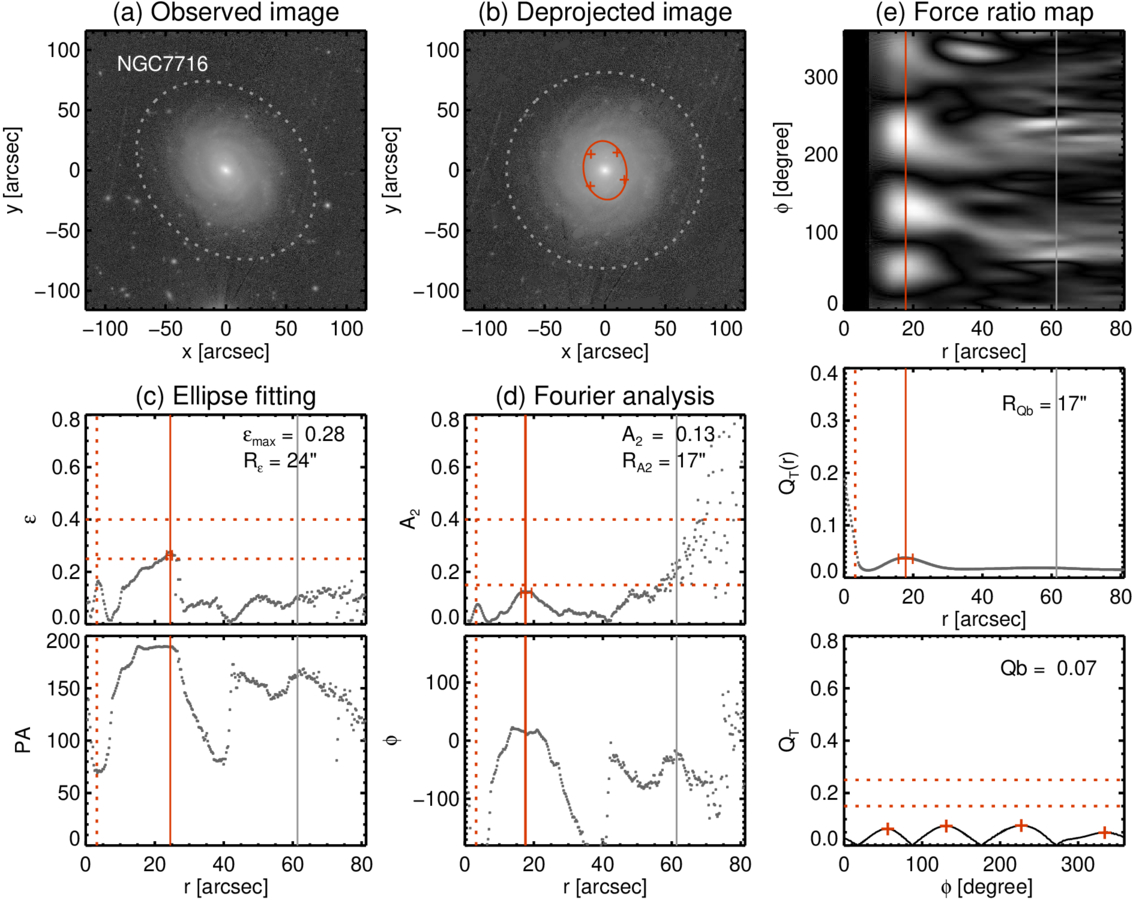
Figure 8. Similar to Figure 7 but for NGC 7716. The nuclear bar identified in the HST/PC image in Section 3 and indicated by the red vertical dotted lines is also detected through ellipse fitting (panel (c)) and Fourier analysis (panel (d)).
Download figure:
Standard image High-resolution imageThe results from ellipse fitting (panel (c)), Fourier analysis (panel (d)), and the force ratio map (panel (e)) are presented from left to right. In general, the bar strengths ( and A2) are defined by the maximum values in the
 and A2 profiles (P. Martin 1995; E. Laurikainen & H. Salo 2002; E. Laurikainen et al. 2002), as shown in the middle row. The bar lengths (R
, RA2, and RQb) are determined by the radii where the bar strengths are measured. The PA and phase (ϕ) are typically constant across the bar structures, remaining within ±10° (J. A. L. Aguerri et al. 2009; I. Marinova et al. 2009; Y. H. Lee et al. 2019), as shown in the bottom row. All the red solid lines in Figure 7 depict the measured bar lengths. For NGC 6951, however,
 appears along a spiral arm beyond ∼50″, aligned with the bar PA. Therefore, we adopted the local maximum near ∼40″ to determine the bar length and strength.
In Fourier analysis, A2 is defined as follows:
where a0, a2, and b2 are the Fourier coefficients (E. Athanassoula 2013; W.-Y. Seo et al. 2019; Y. H. Lee et al. 2022). We note that this value is half of that used in some previous studies, based on their definition (K. Ohta et al. 1990; E. Laurikainen et al. 2002; Y. H. Lee et al. 2019, 2020).
The rightmost panels (column (e)) illustrate the procedure of analyzing the force ratio map, which represents the transverse-to-radial force derived from the potential map (F. Combes & R. H. Sanders 1981; R. Buta & D. L. Block 2001; Y. H. Lee et al. 2020). When displayed in polar coordinates (r, ϕ), as shown in the top panel, the bar structures appear as four horizontal thick slabs, aligned with similar length (r) and width (ϕ) (Y. H. Lee et al. 2020). The force ratio is defined as follows:

where the radial force is described by

and the transverse force is given by
Here, Φ0 represents the m = 0 Fourier component of the gravitational potential (F. Combes & R. H. Sanders 1981; R. Buta & D. L. Block 2001).
The force ratio map (top panel) can be analyzed in both the radial (middle panel) and azimuthal (bottom panel) directions. The radial profile (middle panel) of the force ratio map, QT(r), is obtained by averaging QT over all azimuthal angles at each radius. This profile initially decreases in the bulge-dominated region and then rises to a maximum, which defines the bar length (RQb), marked by the red solid vertical line. The azimuthal profile (bottom panel), on the other hand, is constructed by plotting the QT values across azimuthal angles at a fixed radius. Notably, when the azimuthal profile is examined at RQb, it reveals four distinct peaks, as shown in the bottom panel. These four peaks correspond to the four corners of the bar, which also align with the four slabs in the force ratio maps (top panel) and are marked as the red crosses on the deprojected images (panel (b)). The bar strength (Qb) is calculated as the mean QT value at these four peaks (Y. H. Lee et al. 2020). All measured bar lengths (R, RA2, and RQb) and strengths (
 , A2, and Qb) are provided in the relevant panels of Figures 7 and 8, as well as in Table 2. The errors of the bar lengths are estimated from the widths of the peaks in the
 , A2, and QT(r) profiles, determined at the radii where
, A2, and QT reach 95% of their peak values, following the approach of V. Cuomo et al. (2021). For comparison, the deprojected sizes of the nuclear structures (the red dotted vertical lines) and the galaxy disk, measured at 25
 (R25, the gray solid vertical lines), are also included.
The three methods described above for measuring bar length and strength are useful for identifying barred galaxies (Y. H. Lee et al. 2019, 2020). While additional characteristics, such as the transition between a bar and a disk, and a constant PA or phase, should also be considered (H. Wozniak et al. 1995; E. Laurikainen et al. 2002; S. Jogee et al. 2004; I. Marinova & S. Jogee 2007; K. Menéndez-Delmestre et al. 2007; J. A. L. Aguerri et al. 2009; Y. H. Lee et al. 2019, 2020), each method provides specific criteria for the bar strength that aid in identifying barred galaxies. These criteria can be summarized as  , A2 ≥ 0.15, and Qb ≥ 0.15 (E. Laurikainen et al. 2002; I. Marinova & S. Jogee 2007; F. D. Barazza et al. 2008; I. Marinova et al. 2009; Y. H. Lee et al. 2019, 2020). While E. Laurikainen et al. (2002) suggested a criterion of I2/I0 > 0.3, this can be interpreted as A2 > 0.15, since I2/I0 is larger than A2 by a factor of 2. We overlay these bar strength criteria as the red horizontal dotted lines in the relevant panels of Figures 7 and 8. Additionally, we plot criteria of
  , A2 ≥ 0.4, and Qb ≥ 0.25 (S. Jogee et al. 2004; V. Cuomo et al. 2019a; Y. H. Lee et al. 2019, 2020), which have been used to indicate strongly barred galaxies.
Therefore, given the criteria for the bar strength, NGC 6951 can be classified as strongly barred, with  , A2 = 0.42, and Qb = 0.36. On the other hand, NGC 7716 only barely meets the requirement for barred galaxies with the criterion of
  and rarely satisfies the criterion of Fourier analysis. Moreover, the results from the force ratio map do not support the presence of a bar. Specifically, the four peaks in the azimuthal profile of the force ratio map (the bottom rightmost panel in Figure 8) are significantly low. Therefore, it is difficult to conclude that the oval feature surrounded by the inner ring of NGC 7716 represents a weak bar. We note that both of our target galaxies, NGC 6951 and NGC 7716, have been visually classified as SAB galaxies (i.e., weakly barred) in the Third Reference Catalog of Bright Galaxies (G. de Vaucouleurs et al. 1991), as summarized in Table 1.
The bar length tends to depend on the properties of the host galaxies, such as stellar mass or galaxy size (V. Cuomo et al. 2019a; P. Erwin 2019, 2024; T. Kim et al. 2021; J. A. L. Aguerri et al. 2023), which differs from the bar strength (S. Díaz-García et al. 2016; V. Cuomo et al. 2020; Y. H. Lee et al. 2022). In particular, the bar length is tightly correlated with the galaxy size, including the scale length (hr), effective radius (Reff), as well as the radii enclosing 50% (R50) and 90% (R90) of the total galaxy luminosity (H. B. Ann & S.-W. Lee 1987; T. Kim et al. 2021). As a result, the bar length is often examined as a relative size with respect to galaxy size, such as hr or R25 (B. G. Elmegreen & D. M. Elmegreen 1985; P. Martin 1995; K. Menéndez-Delmestre et al. 2007; J. A. L. Aguerri et al. 2009; Y. H. Lee et al. 2020). For our target galaxies, when investigating Rbar/R25, the bar size of NGC 6951 ranges from 0.32 to 0.38, while NGC 7716 ranges from 0.29 to 0.40, depending on the methods used. This will be discussed further in Section 5.3.
4.2. Bar Pattern Speed
The bar pattern speed, Ωbar, can be directly obtained from multiple long-slit observations using the TW method (S. Tremaine & M. D. Weinberg 1984; M. R. Merrifield & K. Kuijken 1995), which is expressed as follows:
where i, vsys, and x0 denote the inclination, systemic velocity, and center of the galaxy, respectively. The functions l(x) and  represent the mean luminosity and observed LOS velocity of stars at position x along the slit, respectively (S. Tremaine & M. D. Weinberg 1984; M. R. Merrifield & K. Kuijken 1995). The luminosity profile l(x) was derived from spectra collapsed along the wavelength axis. Consequently, 〈X〉 and 〈V〉 correspond to the luminosity-weighted position and velocity along each slit. In practice, each slit yields a pair of 〈X〉 and 〈V〉, and a linear fit to these pairs across multiple slits directly gives
  , as shown in the middle panels of Figure 9.
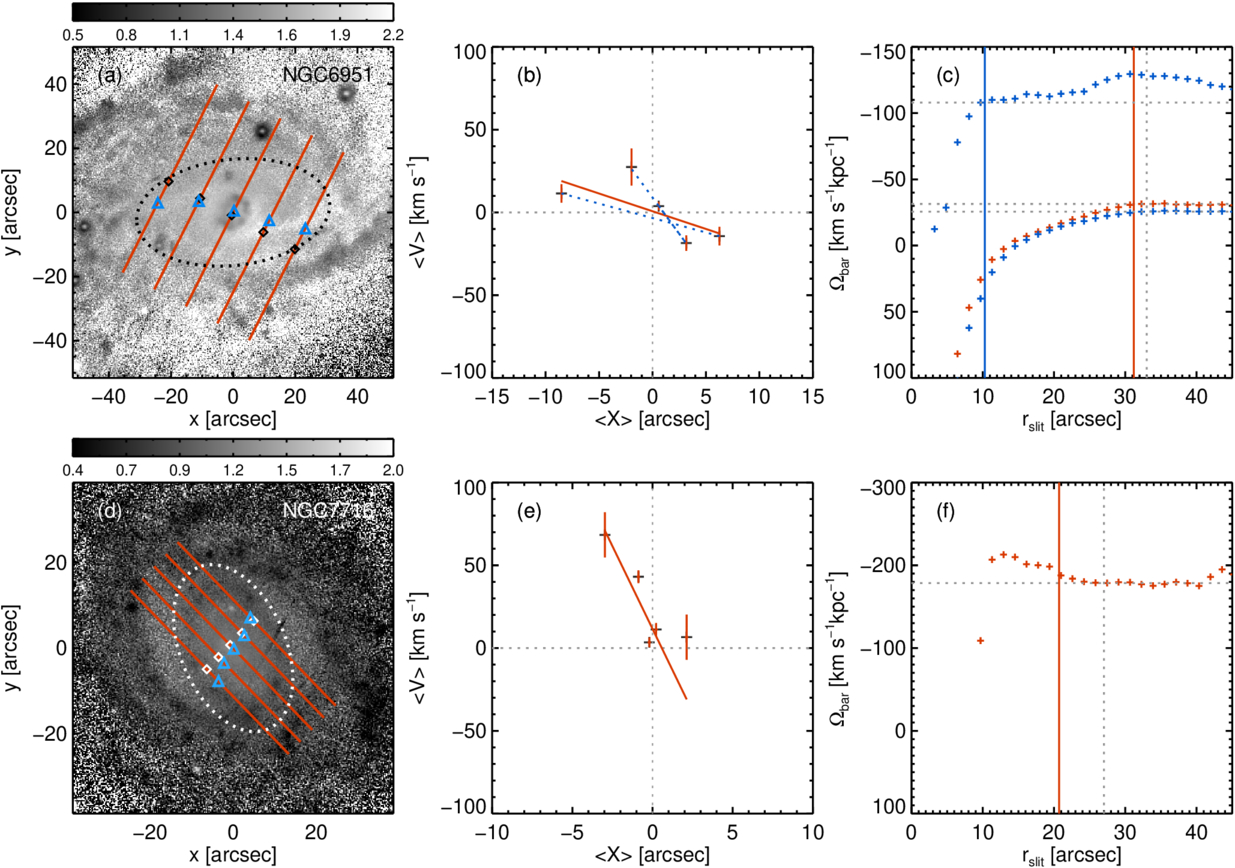
Figure 9. Luminosity-weighted positions, shown as the cyan triangles, are overlaid on the slits indicated by the red solid lines, while the black (top) or white (bottom) squares mark the midpoints of the slit (left column). g − i color maps serve as the background, with dotted ellipses outlining the bar structure. The corresponding color bars are displayed above each image. The luminosity-weighted velocity is plotted as a function of the luminosity-weighted position (middle column). Each slit yields one data point on this plane, with the uncertainties derived from chi-square minimization. The slope of the straight fitting line, indicated by the red solid lines, gives  . The blue dotted lines in NGC 6951 (panel (b)) show the results fitted with two different pattern speeds. The gray dotted lines serve as a guide, showing zero values of 〈X〉 and 〈V〉. The rightmost column shows Ωbar as a function of the slit length. The red plus symbols represent Ωbar derived assuming a single-component fit, while the blue plus symbols indicate the results from a two-component fit. The red solid vertical lines mark the bar length, measured from observed images using ellipse fitting. The gray dotted vertical lines indicate the radius where the S/N exceeds 3. The results at these radii are shown in the leftmost and middle columns. In panel (c), for NGC 6951, the blue solid vertical line represents the radius corresponding to an additional bar-like feature, as identified in the
 and PA profiles from HST/PC photometry, shown in the left panels of Figures 4(c) and (d).
Download figure:
Standard image High-resolution imageFigure 9 illustrates the procedure for measuring Ωbar in our target galaxies. The leftmost panels show the positions of the five long slits, marked with the red solid lines, aligned with the major axis of the disk. Luminosity-weighted positions, 〈X〉, are shown as the cyan triangles on each slit, while the black or white squares mark the slit midpoints. In the background, the g − i color maps highlight bluer features, such as nuclear rings, inner rings, or spiral arms. The bar shapes are outlined with dotted ellipses in panels (a) and (d).
For NGC 6951, in panel (a), the five 〈X〉 positions closely follow the major axis of the bar. Notably, they align with the dust lane, which appears as a lighter-colored region. In contrast, panel (d), for NGC 7716, shows that the 〈X〉 positions do not align with the major axis of the bar. This discrepancy may indicate that the contribution of the bar to the luminosity along each slit is not significant in NGC 7716. This may be partly due to the small angular offset between the major axis of the bar and that of the disk.
The luminosity-weighted velocity, 〈V〉, was directly derived by measuring the velocity from spectra collapsed along the spatial direction, which effectively weights the luminosity, as pixels with higher signal contribute more to the resulting 1D spectrum (M. R. Merrifield & K. Kuijken 1995; E. M. Corsini et al. 2007; J. A. L. Aguerri et al. 2015; V. Cuomo et al. 2019b). This method has the advantage of yielding higher S/N measurements compared to integrating the velocities measured at each pixel, weighted by the corresponding luminosity (Y. Zou et al. 2019). However, when collapsing over ∼400 pixels, we found that instrumental noise also accumulates. Although the noise per pixel is negligible, its combined effect can sometimes hinder pPXF. Therefore, we measured the velocity by fitting Gaussian profiles to the Ca II triplet lines, with the uncertainties estimated through chi-square minimization.
Finally, the five long-slit observations yield five data points for 〈X〉 and 〈V〉, as shown in the middle column of Figure 9. The slope of the best-fitting straight line, shown by the red solid line, corresponds to  . Using the galaxy inclination listed in Table 1, Ωbar is calculated as
  for NGC 6951 and
  for NGC 7716, which are summarized in Table 3. The uncertainties were estimated using Monte Carlo simulations with 1000 iterations. The errors in 〈X〉 are not considered, as they are negligible (J. A. L. Aguerri et al. 2015; R. Guo et al. 2019).
Table 3. Bar Pattern Speeds of Sample Galaxies
| Galaxy | Unit | One Component | Two Components | |
|---|---|---|---|---|
| Ωbar | Ωbar | ΩNSa | ||
| NGC 6951 |

| −3.2 ± 0.7 | −2.5 ± 0.8 | −10.9 ± 6.4 |
| km s−1 kpc−1 | −31.9 ± 7.1 | −25.5 ± 7.8 | −108.7 ± 63.5 | |
| NGC 7716b |

| −32.1 ± 4.8 | ⋯ | ⋯ |
| km s−1 kpc−1 | −177.3 ± 26.6 | ⋯ | ⋯ | |
Notes.
aΩNS is measured at r ∼ 10, where it begins to converge. bAlthough Ω can technically be measured in NGC 7716, it may be influenced by external factors and may not represent the actual Ωbar.Download table as: ASCIITypeset image
As described so far, this method is direct and straightforward. However, asymmetries caused by other structures, such as spiral arms or lopsidedness, could influence the measurements. It is therefore crucial to confirm that the contributions to the integrals primarily originate from the bar and not from other structures or artifacts (V. Cuomo et al. 2019b; Y. Zou et al. 2019). The positions of 〈X〉 in the leftmost column of Figure 9 demonstrate that 〈X〉 for NGC 6951 effectively reflects the contribution of the bar, whereas for NGC 7716, the bar contributes minimally to the luminosity integrals. In the middle column, the data points deviate from the straight-line fit, differing from the typical trend observed in Ωbar measurements (M. R. Merrifield & K. Kuijken 1995; V. Cuomo et al. 2019b, 2024). Therefore, further investigation is required, which will be discussed in Sections 4.2.1 and 4.2.2.
In addition, various factors that could influence the measurement of Ωbar have been examined, including the alignment of the slits (PAslit), slit length, slit width, number of slits, wavelength range, and others (V. P. Debattista 2003; V. Cuomo et al. 2019b, 2024; R. Guo et al. 2019; Y. Zou et al. 2019; L. Garma-Oehmichen et al. 2020). Among these, the misalignment between the slit position (PAslit) and PAdisk introduces the most significant uncertainties (V. P. Debattista 2003; Y. Zou et al. 2019; L. Garma-Oehmichen et al. 2020). In such cases, the axisymmetric light from the disk fails to cancel out, amplifying the error (L. Garma-Oehmichen et al. 2020). Thus, obtaining an accurate measurement of PAdisk is essential.
Regarding the slit length for spatial coverage, the integrals in Equation (7) theoretically extend from −∞ to ∞. However, in practice, a low S/N in the outer regions can introduce false signals (R. Guo et al. 2019), and beyond the bar, potential contributions from spiral arms must also be considered. Fortunately, Ωbar generally converges to a reliable value when the slit length slightly exceeds the bar length, Rbar (R. Guo et al. 2019; Y. Zou et al. 2019; L. Garma-Oehmichen et al. 2020). Therefore, we assess the convergence of Ωbar as a function of the slit length, as shown in the rightmost column of Figure 9. The red plus symbols show the variation of Ωbar with increasing slit length, while the blue plus symbols represent the case where Ωbar is analyzed with two components, as will be discussed in Section 4.2.1. The bar length, Rbar, measured from the observed images in the leftmost panels, is indicated by the red solid vertical lines, while the gray dotted solid lines indicate the slit length at which S/N > 3 per pixel is achieved. We find that Ωbar begins to converge when the slit length approaches Rbar in both NGC 6951 and NGC 7716. The values of Ωbar remain stable to some extent, even when the S/N at certain pixels does not reach 3. The leftmost and middle columns correspond to cases where the slit length ensures S/N > 3 per pixel. Last, factors such as the slit width, the number of slits, and the wavelength range generally do not introduce significant differences in Ωbar measurements (V. Cuomo et al. 2019b, 2024; Y. Zou et al. 2019).
4.2.1. Two Pattern Speeds in NGC 6951
The five data points from the long-slit observations of NGC 6951, shown in Figure 9(b), exhibit significant deviations from the single straight fitting line indicated in red. Instead, they are better represented by two separate straight lines, shown as the blue dotted lines, suggesting the presence of two distinct pattern speeds (E. M. Corsini et al. 2003; W. Maciejewski 2006; S. E. Meidt et al. 2009). This feature of the TW integrals resembles the results for NGC 2950, where E. M. Corsini et al. (2003) first identified two pattern speeds using the TW method, attributed to a rapidly rotating nuclear bar and a slowly rotating primary bar.
We also examine the convergence of Ωbar for the two components as a function of slit length, shown in blue, in panel (c) of Figure 9. The slower component of Ωbar converges when the slit length is approximately Rbar, whereas the faster component stabilizes more quickly, around 10″ of the slit length. Interestingly, this radius coincides with a bar-like feature in the and PA profiles from HST/PC photometry, as indicated by the blue dotted line in the left panels of Figures 4(c) and (d). This feature is characterized by an increasing
(
 at
at  ) and a nearly constant PA. Similar bar-like signatures are observed at a comparable radius in ellipse fitting and Fourier analysis using lower-resolution PS1 photometry (Figures 7(c) and (d)). However, neither the PC image nor the corresponding unsharp masked image (Figures 3(b) and (f)) provide clear evidence of an additional bar-like structure at this radius. Two pattern speeds of NGC 6951 are summarized in Table 3 and will be discussed further in Section 5.3.
4.2.2. Uncertain Bar Pattern Speed of NGC 7716
For NGC 7716, shown in Figure 9(e), the three rightmost data points are close to zero in 〈V〉, indicating that there are no dominant nonaxisymmetric components (Y. Zou et al. 2019). This result aligns with the discrepancy between 〈X〉 and the bar major axis in Figure 9(d), as well as with the classification of NGC 7716 as a nonbarred galaxy based on Fourier analysis and the force ratio map, discussed in Section 4.1.
However, the two leftmost data points exhibit a significant redshift compared to the others. We can determine whether these are genuine features or artifacts caused by noise in a few pixels by examining the velocity profiles along each slit, as shown in Figure 2. The left column of Figure 2, for NGC 6951, shows that the velocities in all slits are approximately symmetric with respect to the systemic velocity, as indicated by the red solid horizontal lines. In contrast, the top two panels in the right column exhibit prominent redshifts, corresponding to the two leftmost slits of NGC 7716 in Figure 9(d). This confirms that the redshifted data points in Figure 9(e) represent genuine features rather than noise.
Therefore, the kinematics of NGC 7716 appear more complex than anticipated, although the origin of the redshifted component remains unclear. We find a hint in a deep image from Sloan Digital Sky Survey (SDSS) Stripe 82, which reveals tidal streams around NGC 7716 with an r-band surface brightness of  (see Figure 7 in G. Á. Bakos et al. 2018; see also the DESI Legacy Survey images with an r-band surface brightness limit of
  ). These features suggest that tidal interactions may influence the observed kinematics. As a result, the slope of the fitted line in Figure 9(e) does not provide a reliable measurement of Ωbar for NGC 7716 (though our slope estimates are still listed in Table 3). Thus, NGC 7716 is excluded from the subsequent discussion of fast and slow bars and will instead be discussed separately in Section 5.2.
4.3. CR and Rotation Rate
Fast and slow bars are commonly distinguished using the rotation ratio,  (J. A. L. Aguerri et al. 2003, 2015; V. Cuomo et al. 2019a, 2020; R. Guo et al. 2019; L. Garma-Oehmichen et al. 2020, 2022; T. Géron et al. 2023), with RCR denoting the CR, the location at which stars rotate at the same angular velocity as Ωbar. A value of
  serves as the threshold, defining fast bars as
  and slow bars as
  , based on the simulation by V. P. Debattista & J. A. Sellwood (2000) using halos with different densities. RCR is typically calculated under the assumption of flat rotation (J. A. L. Aguerri et al. 2015; V. Cuomo et al. 2019a, 2024; R. Guo et al. 2019), while some studies have utilized rotation curves fitted with various functions, including arctan and tanh functions (S. Courteau 1997; L. Garma-Oehmichen et al. 2020; Y. Yoon et al. 2021; T. Géron et al. 2023; D. Jeong et al. 2025).
Figure 10 represents the rotation velocity of NGC 6951, obtained from pPXF applied to the same spectrum used in Figure 5. To extend the rotation curve to larger radii, the spectrum was binned to achieve an S/N of 10. The rotation curve on the blueshifted side provides data at greater distances. As discussed in Section 3.2, NGC 6951 hosts a dynamically decoupled nuclear disk superposed on the main disk. Stars in the nuclear disk rotate faster than stars in the main disk at the same radius (D. A. Gadotti et al. 2020). Therefore, the rotation curve of NGC 6951 cannot be effectively modeled using an arctan function. We instead modeled it with two components: a Gaussian fit for the nuclear region and a multiparameter function (S. Courteau 1997) for the residuals, as shown by the black solid line in Figure 10. The multiparameter function is described as follows:
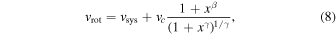
where x = 1/R = rt/r − r0. Here, vsys represents the systemic velocity and r0 is the galaxy center. vc denotes the asymptotic velocity, while rt is the transition radius between the rising and flat parts of the rotation curve. The term γ controls the sharpness of the turnover, and β accounts for the dropoff or steady rise in the outer part of the rotation curve (S. Courteau 1997). The uncertainties are estimated using Monte Carlo simulations with 1000 iterations, as indicated by the gray solid curve in Figure 10.

Figure 10. Blueshifted rotation curve of NGC 6951 obtained by pPXF to the long-slit spectrum along the major axis. The uncertainties are estimated using Monte Carlo simulations with 100 iterations. The cyan horizontal line represents the expected flat rotation with a 1σ deviation, while the black solid curve shows the rotation curve modeled with a multiparameter function after subtracting the nuclear region, which is modeled with a Gaussian. The ranges of uncertainties are indicated by the gray solid curves, obtained using Monte Carlo simulations with 1000 iterations. The red and blue solid lines illustrate the bar rotation fitted with one- and two-component models for Ωbar. The gray dotted vertical lines indicate the sizes of the structures, RND, R, RQb, and RA2, ordered from the center outward.
Download figure:
Standard image High-resolution imageThe anticipated flat rotation is depicted by the cyan solid horizontal line, with a value of 179 ± 18 km s−1, calculated as the average velocity from the maximum near 40″ to the endpoint of the obtained curve, with the uncertainty representing the 1σ error. Previous studies based on Hα observations have reported a similar flat rotation trend in NGC 6951 beyond 50″ (I. Marquez & M. Moles 1993; M. Rozas et al. 2002; S. Haan et al. 2009).
The bar rotation is also shown in Figure 10, where the red and blue solid lines represent the one-component and two-component models for Ωbar, respectively, as discussed in Section 4.2.1. RCR is determined at the intersection of the bar rotation (the red or blue solid line) and the rotation curve (the black or cyan solid line). We derived the errors of RCR by accounting for the uncertainties of both Ωbar and vrot.
The rotation rate  is then calculated as the ratio of RCR to Rbar. The uncertainties are estimated by propagating the uncertainties in both RCR and Rbar, as summarized in Table 4. Figure 11 visualizes the data from Table 4, showing how
  varies depending on whether a one- or two-component model for Ωbar is used, as well as on the methods applied to measure Rbar. The flat rotation and the rotation curve derived using a multiparameter function yield similar results. When we adopt the criterion of
  , NGC 6951 can be classified as a slow bar with the two-component bar model. In the case of the one-component bar model, only the ellipse-fitting method for Rbar barely falls within the slow-bar regime. Further discussions will be provided in Section 5.3.
Table 4. CR and Rotation Rate in NGC 6951
| Ωbar | vrot | RCR |

| ||
|---|---|---|---|---|---|
| (arcsec) | RCR/R | RCR/RA2 | RCR/RQb | ||
| One component | Flat |

|

|

|

|
| Multiparameter |

|

|

|

| |
| Two components | Flat |

|

|

|

|
| Multiparameter |

|

|

|

| |
Download table as: ASCIITypeset image

Figure 11.
 values for NGC 6951 as functions of the methods used to determine Rbar, Ωbar, and vrot. The x-axis indicates the different methods for measuring Rbar. The reddish and bluish colors represent the one- and two-component models for Ωbar, respectively, while the lighter and darker shades indicate the flat rotation and multiparameter fitted rotation curves. The uncertainties are propagated from the errors in RCR and Rbar.
Download figure:
Standard image High-resolution image5. Discussion
5.1. Bar-driven Nuclear Stellar Disk in NGC 6951
Figure 5 demonstrates the presence of a nuclear stellar disk in each of our target galaxies. In general, the σ profiles of galaxies follow an exponential law, peaking at the nucleus, where stars near the bottom of the potential well are expected to have the highest σ (E. Emsellem et al. 2001; S. Comerón et al. 2008; E. Portaluri et al. 2017). However, a central decrease in σ, known as a σ-drop, is observed in about 50% of disk galaxies when spectroscopic data with high spatial resolution are available (E. Emsellem et al. 2001; I. Márquez et al. 2003; J. Falcón-Barroso et al. 2006; S. Comerón et al. 2008; J. Méndez-Abreu et al. 2014). The σ-drop is understood as evidence for the presence of a cold nuclear disk with larger rotational support than the underlying main disk (H. Wozniak et al. 2003; H. Wozniak & N. Champavert 2006; E. Portaluri et al. 2017; D. A. Gadotti et al. 2020), often associated with nuclear rings, nuclear bars, pseudo-bulges, or AGN activities (E. Emsellem et al. 2001; I. Márquez et al. 2003; S. Comerón et al. 2008; E. Portaluri et al. 2017).
Nuclear disks are believed to form through star formation by dissipative gas funneled into the central regions, primarily driven by bars (R. H. Sanders & A. D. Tubbs 1980; S. M. Simkin et al. 1980; E. Athanassoula 1992, 2013; H. B. Ann & P. Thakur 2005; D. R. Cole et al. 2014; W.-Y. Seo et al. 2019; D. A. Gadotti et al. 2020). External gas accretion or mergers can also transport gas to the center, leading to nuclear disk formation (L. Mayer et al. 2008; M. C. Eliche-Moral et al. 2011; D. Chapon et al. 2013), but these mechanisms may leave distinct imprints on the resulting nuclear disk (M. C. Eliche-Moral et al. 2011; D. A. Gadotti et al. 2020).
The Time Inference with MUSE in Extragalactic Rings project (D. A. Gadotti et al. 2019) reported that bar-driven nuclear disks exhibit characteristic features, including a σ-drop, an anticorrelation between h3 and v, or elevated h4 (D. A. Gadotti et al. 2020). They also showed that bar-driven nuclear disks range in size (Rkin) from 200 to 1000 pc, which is strongly related to bar properties, including the bar length, strength, and the bar-to-total ratio (D. A. Gadotti et al. 2020).
In one of our target galaxies, NGC 6951, we find clear evidence for a bar-driven nuclear disk, including a σ-drop, an anticorrelation between h3 and v, and a central increase in h4, as shown in the left column of Figure 5. The measured values of Rkin and v/σ are 590 pc and 2.8, respectively, as listed in Table 2. These values fall within the typical range of observed bar-driven nuclear disks (D. A. Gadotti et al. 2020). Compared with the bar length and strength in Table 2, the nuclear disk of NGC 6951 follows the expected trends between Rkin and the bar properties as illustrated in Figure 8 of D. A. Gadotti et al. (2020). Interestingly, this nuclear disk appears as a superposed feature on the rotation curve in Figure 10, which may result from the superposition of different LOSVDs. This characteristic aligns with the elevated h4 observed in Figure 5(d).
Nuclear disks often contain substructures such as nuclear rings, bars, or spiral arms (H. B. Ann & H. M. Lee 2000; D. A. Gadotti et al. 2020). Nuclear rings are closely associated with bar properties, showing that their size is correlated with bar length but there is an anticorrelation with bar strength (J. H. Knapen 2005; S. Comerón et al. 2010; W.-T. Kim et al. 2012; Z. Li et al. 2015; M. C. Sormani et al. 2018; D. A. Gadotti et al. 2020). These relations are similar between nuclear disks and bar properties; this suggests a fundamental process in common, which is bar-driven (D. A. Gadotti et al. 2020). Specifically, nuclear rings (RNR) are typically located on the outer edges of nuclear disks (RND) and are considered to be part of them (D. R. Cole et al. 2014; A. Bittner et al. 2020; D. A. Gadotti et al. 2020). The left column of Figure 5 shows that RNR (the red dotted line) and RND (the red solid line) are consistent in NGC 6951 as well.
5.2. Large Nuclear Disk and Nuclear Bar in NGC 7716 Without a Primary Bar
NGC 7716 is also likely to host a nuclear disk with near-circular orbits. As shown in the right column of Figure 5 and in Figure 6, it exhibits a σ-drop and an anticorrelation between h3 and v. However, the nuclear disk in NGC 7716 appears larger than the typical RND observed in bar-driven nuclear disks. Its size, 1.2 kpc, slightly exceeds the typical range of 200–1000 pc (D. A. Gadotti et al. 2020). Using the values of Rbar from Table 2, we find that the ratio RND/Rbar ranges from 26% to 37%, depending on the method used to measure Rbar. This is significantly higher than the typical value of less than 10% (D. A. Gadotti et al. 2020).
For the nuclear bar within the nuclear disk in NGC 7716, the length (RNB) is measured to be 810 pc, based on visual inspection of the unsharp mask, as shown in Figure 4. While RNB is generally positively correlated with the stellar mass of the host galaxy (P. Erwin 2024), the nuclear bar in NGC 7716 is significantly longer than expected from the nuclear bar–stellar mass relation. Instead, it falls within the lower regime of the primary bar–stellar mass relation, suggesting that its size is more comparable to a short primary bar than a typical nuclear bar (see Figure 9 in P. Erwin 2024), assuming a stellar mass of logM* = 10.17 ± 0.08M⊙ (E. Aquino-Ortíz et al. 2018).
On the other hand, A. de Lorenzo-Cáceres et al. (2020) reported a bimodal distribution of RNB/Rbar, suggesting distinct formation or evolutionary pathways. For instance, based on TNG50 simulations, M. Semczuk et al. (2024) proposed that nuclear bars may form first, either in isolation via instabilities or through galaxy interactions. This mechanism could explain how nuclear bars grow longer relative to the primary bar, as observed in A. de Lorenzo-Cáceres et al. (2020). Notably, NGC 7716 hosts a large nuclear bar, with RNB/Rbar ∼ 18%–26%, depending on the method used to measure Rbar. These values could increase when using the decomposition method employed by A. de Lorenzo-Cáceres et al. (2020).
When it comes to the primary bar of NGC 7716, it appears as an oval structure surrounded by an inner ring (Figure 1(b)) and has been visually classified as a weak bar (G. de Vaucouleurs et al. 1991). This classification is supported by the ellipse-fitting method (Figure 8(c)). However, Fourier analysis and the force ratio map (Figures 8(d) and (e)) make it challenging to classify NGC 7716 even as a weak bar. In particular, the bar strength is notably low, with Qb = 0.07, which is well below the typical threshold of Qb = 0.15. Additionally, the minimal contribution of nonaxisymmetric components to the luminosity within each long-slit spectrum further supports the weakness of the bar structure (Figure 9(d)).
Therefore, the growth of a large nuclear bar in NGC 7716 may be facilitated by the absence or weakness of the primary bar, similar to the longer nuclear bars observed in TNG50 simulations (M. Semczuk et al. 2024). Considering the tidal stream revealed in the deep image (G. Á. Bakos et al. 2018), NGC 7716 may have undergone a more complex evolutionary history.
5.3. Two Pattern Speeds in NGC 6951
The possibility of two pattern speeds in NGC 6951, as discussed in Section 4.2.1, is also an intriguing aspect of this study. Previous N-body simulations have shown that galaxies can host independent structures, such as bars, spirals, and nuclear bars, each rotating with a different pattern speed (J. A. Sellwood & L. S. Sparke 1988; P. Rautiainen & H. Salo 1999; I. Minchev & A. C. Quillen 2006; I. Minchev et al. 2012; J. Baba 2015; K. Zouloumi et al. 2024). This finding is supported by observations detecting multiple RCR (I. Puerari & H. Dottori 1997; J. A. L. Aguerri et al. 1998) or multiple pattern speeds (S. E. Meidt et al. 2009). Slowly rotating spiral arms compared to a bar have been observed in the Milky Way (W. S. Dias & J. R. D. Lépine 2005; O. Gerhard 2011) and in other spirals (J. C. Speights & P. C. Rooke 2016).
In the TW method, a different pattern speed appears as a slope change in the straight-line fitting to the TW integrals (E. M. Corsini et al. 2003; V. Cuomo et al. 2021). A rapidly rotating nuclear bar was first observed in NGC 2950 using the TW method (E. M. Corsini et al. 2003). In Figure 9(b), we observe a slope change similar to that seen in NGC 2950, suggesting the presence of two pattern speeds in the central region of NGC 6951. Considering the offset between slits ( ), we expect the presence of a bar-like structure around r ∼ 10″. We also found several pieces of evidence supporting this structure. First, the
 and PA profiles show a bar-like structure at a comparable radius in both HST/PC and PS1 photometry (Figures 4(c)–(d) and 7(c)); Fourier analysis further supports this feature (Figure 7(d)). Second, the rapidly rotating pattern speed converges when the slit length approaches r ∼ 10″, similar to the convergence of Ωbar near Rbar. Nevertheless, neither the PC image nor the corresponding unsharp masked image (Figures 3(b) and (f)) provide clear evidence of a bar-like structure at this radius.
Similarly, several previous studies anticipated the presence of a nuclear bar in NGC 6951 but were unable to detect it (D. Friedli et al. 1996; E. Pérez et al. 2000; M. Rozas et al. 2002; S. Haan et al. 2009). E. Pérez et al. (2000) suggested the possibility of a gas-driven structure, such as a nuclear bar, based on the relatively high molecular-to-total mass fraction within r ≲ 6″, which is consistent with the size of the kinematic nuclear disk,  , measured in Figure 5(e). M. Rozas et al. (2002) and S. Haan et al. (2009) inferred it from the detection of strong noncircular motion near the nucleus. Therefore, the bar signature at r ∼ 10″ and the two pattern speeds observed in NGC 6951 in this study are consistent with the properties reported in previous studies (E. Pérez et al. 2000; M. Rozas et al. 2002). Instead of a bar-like structure at r ∼ 10″, previous studies have reported nuclear spirals and a nuclear oval within the nuclear ring (E. Pérez et al. 2000; S. García-Burillo et al. 2005; T. Storchi-Bergmann et al. 2007; T. P. R. van der Laan et al. 2011), which are likely smaller in size given the slit positions. Although we do not observe a distinct feature in the images, our results suggest that an oval structure of r ∼ 10″ could be responsible for inducing the rapidly rotating pattern speed.
5.4. Slow, Long, and Strong Bar in NGC 6951
When we adopt the two pattern speeds of NGC 6951, the galaxy is classified as a slow bar (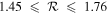 in Table 4). Moreover, all three methods used to measure the bar strength—ellipse fitting, Fourier analysis, and the force ratio map—consistently indicate that NGC 6951 hosts a strong bar (
 , A2 = 0.42, Qb = 0.36), despite its visual classification as a weak bar, as discussed in Section 4.1.
On the other hand, assessing whether a bar is long is somewhat complex. For instance, while visual inspection often relies on the relative bar length to distinguish between SBs and SABs (H. B. Ann et al. 2015; R. J. Buta et al. 2015; Y. H. Lee et al. 2019), the relative bar lengths measured using the three methods (R/R25, RA2/RR25, and RQb/R25) do not show significant differences in their distributions (Y. H. Lee et al. 2020). Moreover, the bar length depends on the morphological type or bulge-to-total fraction, with early-type spirals generally hosting longer bars in both absolute and relative terms (B. G. Elmegreen & D. M. Elmegreen 1985; P. Martin 1995; K. Menéndez-Delmestre et al. 2007; J. A. L. Aguerri et al. 2009; D. A. Gadotti 2011; T. Kim et al. 2014). More specifically, the relative bar length exhibits a bimodal distribution, increasing toward both ends of the Hubble sequence (E. Laurikainen et al. 2007; S. Díaz-García et al. 2016; J. Font et al. 2017, 2019; Y. H. Lee et al. 2020). Accordingly, when we compare the relative bar length of NGC 6951 to the distribution of relative bar lengths across the Hubble sequence (Figure 14 in Y. H. Lee et al. 2020), it is classified as a long bar in an Sbc galaxy (G. de Vaucouleurs et al. 1991). The relative bar lengths of NGC 6951, measured using three different methods, are higher than the mean values for SBbc galaxies. In particular, RA2/R25 and RQb/R25 exceed the mean by nearly a factor of 2.
As a result, based on all analyses presented in this study, we classify NGC 6951 as a galaxy with a slow, long, and strong bar. Additionally, NGC 6951 is a deeply isolated galaxy, with no nearby galaxies within 1 Mpc in projected distance, implying no significant gravitational influence from other galaxies for at least the past 109 yr (I. Marquez & M. Moles 1993). Therefore, we suggest that NGC 6951, with a nuclear ring, could be an ideal candidate for a slow, long, and strong bar evolved through interactions with a dark matter halo, as predicted in simulation studies (J. A. Sellwood 1980; V. P. Debattista & J. A. Sellwood 2000; E. Athanassoula 2002, 2003, 2014; W.-Y. Seo et al. 2019; D. Jang & W.-T. Kim 2023, 2024). This slow, long, and strong bar may significantly contribute to the formation of the nuclear structure, including its nuclear disk and nuclear ring.
6. Conclusions
In this work, we have observed two barred galaxies with nuclear structures, in order to search for examples of slow bars evolved through interactions with their dark matter halos. Using high-resolution spectroscopy from Gemini/GMOS long-slit observations and high-resolution photometry from HST/PC and PS1 archival data, we have investigated the properties of their nuclear structures and primary bars, including the bar pattern speed (Ωbar), length (R, RA2, and RQb), strength (
 , A2, and Qb), CR (RCR), and rotation rate (
 ).
).
Our main results are as follows:
- 1.High-resolution spectroscopy reveals kinematically decoupled nuclear disks in both target galaxies, while high-resolution photometry identifies a nuclear ring in NGC 6951 and a nuclear bar in NGC 7716. These nuclear structures are embedded within their respective nuclear disks.
- 2.Our findings suggest that NGC 6951 hosts a slow, long, and strong bar, which likely evolved through interactions with the dark matter halo. Both the nuclear disk and the nuclear ring in NGC 6951 appear to have formed through a common bar-driven mechanism. Additionally, we identify a rapidly rotating pattern speed within the primary bar, which may be driven by an embedded oval structure, although this feature is not clearly visual in the imaging data.
- 3.For NGC 7716, we observe unexpected results. The primary bar is too weak to be classified as barred, and we were unable to determine its bar pattern speed due to redshifted velocities observed in certain slits, which may be affected by external sources. Nevertheless, NGC 7716 hosts a large nuclear disk and nuclear bar. We suggest that the formation of its long nuclear bar may follow a different evolutionary pathway, potentially influenced by tidal interactions or by the weakness of the primary bar.
As a result, our findings suggest that slow bars may be more observed in galaxies with nuclear structures, which may have developed through interactions with dark matter halos. Furthermore, galaxy interactions may play a frequent and significant role in galaxy evolution, potentially affecting even the formation of nuclear structures.
Acknowledgments
We sincerely thank the anonymous referee for the detailed and insightful comments, which greatly helped to improve the paper. This research was supported by the Basic Science Research Program through the National Research Foundation of Korea (NRF) funded by the Ministry of Education (No. RS-2023-00249435) and by the Korean government (MSIT; No. 2022R1A4A3031306). H.S.H. acknowledges the support of the Samsung Electronic Co., Ltd. (Project Number IO220811-01945-01), the National Research Foundation of Korea (NRF) grant funded by the Korea government (MSIT; NRF-2021R1A2C1094577), and the Hyunsong Educational & Cultural Foundation. V.C. acknowledges support from the Agencia Nacional de Investigación y Desarrollo (Chile) through the FONDECYT Iniciación grant (No. 11250723). M.G.P. acknowledges the support from the Basic Science Research Program through the National Research Foundation of Korea (NRF) funded by the Ministry of Education (Nos. RS-2019-NR045193 and RS-2018-NR031074). T.K. acknowledges support from the Basic Science Research Program through the National Research Foundation of Korea (NRF) funded by the Ministry of Education (No. RS-2023-00240212). N.H., H.-J.K., and J.Y.S. acknowledge the support from the Korea Astronomy and Space Science Institute grant funded by the Korea government (MSIT; No. 2025-1-860-02, International Optical Observatory Project). The work of W.-T.K. was supported by the National Research Foundation of Korea (NRF) grant funded by the Korea government (MSIT; No. RS-2025-00517264). J.H.L. acknowledges the support from the Basic Science Research Program through the National Research Foundation of Korea (NRF) funded by the Ministry of Education (No. RS-2024-00452816).
This work was supported by the K-GMT Science Program (PID: GN-2023B-Q-303) of the Korea Astronomy and Space Science Institute (KASI). Based on observations obtained at the international Gemini Observatory, a program of NSF NOIRLab, which is managed by the Association of Universities for Research in Astronomy (AURA) under a cooperative agreement with the U.S. National Science Foundation on behalf of the Gemini Observatory partnership: the U.S. National Science Foundation (United States), National Research Council (Canada), Agencia Nacional de Investigación y Desarrollo (Chile), Ministerio de Ciencia, Tecnologìa e Innovación (Argentina), Ministério da Ciência, Tecnologia, Inovações e Comunicações (Brazil), and Korea Astronomy and Space Science Institute (Republic of Korea).
Facilities: Gemini:Gillett - Gillett Gemini North Telescope, PS1 - Panoramic Survey Telescope and Rapid Response System Telescope #1 (Pan-STARRS), SDSS - , HST - Hubble Space Telescope satellite.
Software: Dragons (K. Labrie et al. 2019), pPXF (M. Cappellari & E. Emsellem 2004), BarIstA (Y. H. Lee et al. 2019, 2020).
Footnotes
- 9
This is available from https://github.com/yhinastro/BarIstA.
- 10
The observations were conducted under band 3 observing conditions: 85th percentile image quality, 80th percentile sky background, and 70th percentile cloud coverage.