Abstract
It has recently been shown that the persistent emission of a neutron star low-mass X-ray binary (LMXB) evolves during a thermonuclear (type-I) X-ray burst. The reason of this evolution, however, is not fully known. This uncertainty can introduce significant systematics in the neutron star radius measurement using burst spectra, particularly if an unknown but significant fraction of the burst emission, which is reprocessed, contributes to the changes in the persistent emission during the burst. Here, by analyzing individual burst data of AstroSat/LAXPC from the neutron star LMXB 4U 1728–34 in the soft state, we show that the burst emission is not significantly reprocessed by a corona covering the neutron star. Rather, our analysis suggests that the burst emission enhances the accretion disk emission, possibly by increasing the accretion rate via disk. This enhanced disk emission, which is Comptonized by a corona covering the disk, can explain an increased persistent emission observed during the burst. This finding provides an understanding of persistent emission components and their interaction with the thermonuclear burst emission. Furthermore, as burst photons are not significantly reprocessed, non-burst and burst emissions can be reliably separated, which is required to reduce systematic uncertainties in the stellar radius measurement.
1. Introduction
Thermonuclear (type-I) X-ray bursts are intermittently observed from many neutron star low-mass X-ray binaries (LMXBs; Strohmayer & Bildsten (2006) and references therein). Such a burst originates from an unstable thermonuclear burning of the accreted matter accumulated on the neutron star surface (Joss 1977; Lamb & Lamb 1978; Strohmayer & Bildsten 2006). For most bursts, the observed X-ray intensity rises in ≈0.5–5 s, decays in ∼10–100 s as the neutron star surface cools down after the nuclear burning, and the typical recurrence time is a few hours to days (Galloway et al. 2008). The burst spectrum is traditionally described with a blackbody model, and the best-fit burst blackbody normalization, which can be identified as the burst emission area, usually matches well with the expected surface area of a neutron star (Hoffman et al. 1977; Swank et al. 1977). These motivated an effort to measure the neutron star radius using the burst continuum spectrum, where the normalization of the burst blackbody is expected to be proportional to the square of the stellar radius (e.g., van Paradijs 1978; Goldman 1979; van Paradijs 1979; van Paradijs & Lewin 1986). Note that such a radius measurement is extremely important to probe the superdense and degenerate core matter of neutron stars, which is a fundamental problem of physics (e.g., Lattimer & Prakash 2007; Bhattacharyya et al. 2017). However, a reliable radius measurement using this method has so far not been possible due to a number of systematic uncertainties, which include (1) burst emission from and the visibility of an unknown fraction of the neutron star surface and (2) plausible deviation of the burst spectrum from a blackbody, etc. (Bhattacharyya 2010; Bhattacharyya et al. 2010; Kajava et al. 2017a). Nevertheless, the use of continuum burst spectrum remains a promising method to measure the neutron star radius for the following reasons: (1) neutron star LMXBs provide many complementary methods to measure neutron star parameters, the joint application of which has a potential to significantly reduce the systematics (Bhattacharyya 2010) and (2) it was generally believed that the much more intense burst emission could be reliably distinguished from the persistent (i.e., non-burst) emission during the burst.
In the conventional method of distinguishing the burst and the persistent emissions, the latter is assumed unevolved during the burst, and the observed preburst spectrum is used as the background while fitting the spectrum during the burst (Galloway et al. 2008). Then, the net spectrum is usually fit with a blackbody model to estimate the burst temperature and the neutron star radius. But Worpel et al. (2013, 2015) showed that the persistent flux changes during bursts. Those authors fit the observed spectrum during a burst with the scaled (with a free factor fa) frozen best-fit model preburst spectrum plus a blackbody. This “fa method,” with best-fit fa values typically between zero and somewhat above 10, usually gave a better fit than the above-mentioned conventional method. This finding raised the following questions. (1) What is the true nature of the persistent X-ray emitting components, and how does a thermonuclear burst interact with them? (2) Does the shape of the persistent spectrum also evolve during a burst? Since the integration time for a burst spectrum is typically about a second, the statistics is not usually enough to investigate this. (3) What fraction of X-ray emission during a burst is actually the burst emission, and are the burst photons reprocessed to contribute to the enhanced persistent emission? These questions have significant implications for separating the burst emission from the persistent emission, and hence for a reliable measurement of neutron star radius.
There are also other reports on the persistent emission change during thermonuclear bursts. For example, Ji et al. (2013) found a shortage of hard X-ray (30–50 keV) photons during bursts in the hard spectral state of the neutron star LMXB 4U 1636–536. This was confirmed for other neutron star LMXBs, and was proposed to be due to a corona cooling by an enhanced number of soft X-ray seed photons from the burst (Chen et al. 2013; Ji et al. 2014a, 2014b, 2015). In fact, a decrease in coronal temperature has been detected during the hard state of the neutron star LMXB 4U 1728–34, but only by stacking many burst spectra in the 1–10 s intervals, in which the burst temperature significantly evolves (Kajava et al. 2017b). However, such a hard X-ray deficit is not found in the soft spectral state of neutron star LMXBs (e.g., Ji et al. 2013).
In this paper, for the first time to the best of our knowledge, we attempt to understand the reason of persistent emission evolution during thermonuclear bursts in the soft state of 4U 1728–34. This understanding requires spectral evolution study for individual bursts (i.e., without stacking them), because both the persistent and the burst spectra evolve during a burst, and properties of different bursts are usually sufficiently different. We, for the first time, use the Large Area X-ray Proportional Counter (LAXPC) instrument aboard the AstroSat space mission (Yadav et al. 2016; Agrawal et al. 2017; Antia et al. 2017) for such a science goal. Note that LAXPC, which has a large area and does not suffer from pile-up, is ideal to track burst spectral evolution. Two proposed models for an enhanced persistent emission during a burst in the soft spectral state are based on the following scenarios: (1) an increased mass accretion rate due to Poynting–Robertson drag on the accretion disk because of burst luminosity (Worpel et al. 2013), and (2) a spreading layer, which reprocesses the burst emission and covers a larger extent of the neutron star surface during a burst (Kajava et al. 2017a). The latter model implies a burst emission region almost entirely covered by a Comptonizing spreading layer, consequently an unknown fraction of burst photons being Comptonized, and hence a larger uncertainty in the neutron star radius measurement. Our systematic analysis suggests that the former model is more viable.
2. Observations and Spectral State
The persistent neutron star LMXB 4U 1728–34 was observed with AstroSat/LAXPC in the performance verification phase in 2016 March. The observations (obsId: T01_041T01_9000000362) spanned over 22 satellite orbits from 2016 March 07 16:53:11 to 2016 March 09 09:40:00. In the total 61.05 ks of useful LAXPC exposure, five thermonuclear bursts were detected. The times of these bursts, using 10% of the peak count rate for both start and end times, are (1) 2016 March 08 02:58:39.2–02:58:50.2, (2) 2016 March 08 13:52:10.0–13:52:23.4, (3) 2016 March 08 16:43:26.5–16:43:37.8, (4) 2016 March 08 23:25:24.0–23:25:36.1, and (5) 2016 March 09 03:13:56.1–03:14:08.8. Note that high-frequency timing features have already been reported from these LAXPC data (Verdhan Chauhan et al. 2017). In this paper, however, we focus on the spectral evolution during the five thermonuclear bursts. For this, we generate the total spectrum, the background spectrum and the response file using the laxpc software8 (Antia et al. 2017).
In order to interpret the results, it is useful to know the spectral state of the source during these observations. We therefore make the hardness–intensity diagram (HID) of 4U 1728–34 using the data from one LAXPC detector (LAXPC10) in the following way. The hardness is considered to be the ratio of background-subtracted LAXPC10 count rate in 8–25 keV to that in 3–8 keV. We also estimate this ratio for the closest LAXPC10 observation of Crab, for which the LAXPC10 gain was the same as for 4U 1728–34 observations, and normalize the 4U 1728–34 hardness with the Crab hardness (Figure 1). The intensity of the HID is defined as the background-subtracted 3–25 keV LAXPC10 count rate (typically ∼370) of 4U 1728–34 normalized by that (∼2491) of Crab. Note that expressing intensity and hardness in the Crab unit is useful, to meaningfully compare HIDs from the data of different instruments, and even from the data of different gain epochs of the same instrument (Bhattacharyya 2007). Figure 1 is for the 61.05 ks of useful LAXPC exposure, excluding the durations of five bursts, and each point is for a 128 s integration time. Each of the five bursts is represented in the HID by the 128 s duration point just before the burst. Comparing our Figure 1 with Figure 3 of Kajava et al. (2017b), we can conclude that 4U 1728–34 was in a high intensity soft spectral state during the AstroSat/LAXPC observations.
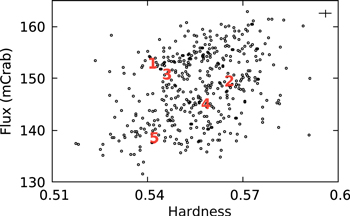
Figure 1. Hardness–intensity diagram of the neutron star LMXB 4U 1728–34 using AstroSat/LAXPC data of 2016 March. The definitions of the hardness and intensity are given in Section 2. Each point is for 128 s integration time, typical error bars for both hardness and intensity are shown, and red numbers represent persistent emissions just before thermonuclear X-ray bursts. This figure shows that 4U 1728–34 was in a high intensity soft spectral state.
Download figure:
Standard image High-resolution image3. Spectral Analysis and Results
For spectral analysis, we use LAXPC10 and LAXPC20, and exclude the third LAXPC unit (LAXPC30) due to its gain instability caused by a gas leakage. The dead time effect is taken care of by the correction of the count rate by the laxpc software. A 2% systematic error is applied for the fitting of spectra. As LAXPC cannot characterize the source below 3 keV, we use a fixed hydrogen column density of 2.3 × 1022 cm−2 (Galloway et al. 2010) in the multiplicative XSPEC software9 model component tbabs. The 90% errors of parameters are estimated using the MCMC technique with the Goodman-Weare algorithm, a chain length of 100,000 steps (30,000 in the initial burn-in phase) and 1000 walkers (e.g., Ingram et al. 2016).
The persistent or non-burst spectral components of a neutron star LMXB can be the following (Mukherjee & Bhattacharyya 2011): (1) a geometrically thin accretion disk emitting a multi-color blackbody or disk blackbody spectrum; (2) a boundary layer on the neutron star emitting a (single temperature) blackbody spectrum; and (3) one or more coronae (hot electron gas), which may partially or entirely cover the disk and/or the boundary layer, reprocessing (Comptonizing) the radiations from these components. Here, however, we aim to fit the preburst spectrum of 200 s exposure for each of five bursts with the simplest model, which gives a reasonable value of reduced χ2 (χ2/dof; “dof”: degrees of freedom). This is because our main goal is to study how the parameter values of a preburst spectrum evolve during the burst, and because there is a relatively small numbers of counts within a ∼1 s time bin during a burst, such a study could be feasible only if the number of preburst spectral parameters is small.
The simplest physical model, which describes the preburst spectra well, is a Comptonization model, and we choose it to be nthcomp (Zdziarski et al. 1996; Życki et al. 1999) in XSPEC. The nthcomp offers two options: the seed photons can be supplied by a single temperature blackbody (e.g., a boundary layer) or by a disk blackbody (e.g., an accretion disk). Hence, the sole nthcomp model component implies a Comptonizing layer (corona) entirely covering either a boundary layer or a disk, none of which is directly observed. Therefore, the nthcomp model is very convenient in the sense that it effectively represents two spectral components with small number of parameters. In Table 1, we show the results of spectral fits with both options for the preburst spectrum of burst-1. The nthcomp electron temperature is relatively low in both cases, which is expected as the source was in a soft state. Both the models are almost equally preferred based on the χ2/dof values, and hence from these fits we cannot conclude if the Comptonizing layer primarily covers the disk or the neutron star. However, we find that the seed photon temperature for a single temperature blackbody is significantly lower than that for a disk blackbody. These results are qualitatively same for four other preburst spectra.
Table 1. Best-fit Parameters (for XSPEC Model tbabs∗nthcomp) of the 200 s Preburst AstroSat/LAXPC Spectrum of Burst-1 from 4U 1728–34 (Section 3)
| Spectral | Blackbody | Disk Blackbody |
|---|---|---|
| Parameters | Seed Photonsa | Seed Photonsb |
| nHc | 2.3 (frzd) | 2.3 (frz) |
| Γe |

|

|
 f
f
|

|

|
 g
g
|

|

|
| Normh |

|

|
| Obs. fluxi | 2.83 | 2.83 |
| Unabs. fluxj | 3.88 | 4.38 |
| Reduced χ2 (dof) | 1.12 (122) | 1.08 (122) |
Notes.
aSeed photons for the thermal Comptonization component (nthcomp) are provided by a blackbody. bSeed photons for nthcomp are provided by a disk blackbody. cHydrogen column density (in 1022 cm−2) for tbabs. d“frz” indicates that the parameter value is frozen. eAsymptotic power-law photon index for nthcomp. fElectron temperature (in keV) for nthcomp. gSeed photon temperature (in keV) for nthcomp. hNormalization for nthcomp. iObserved flux (in 10−9 erg cm−2 s−1) in 3–25 keV. jUnabsorbed bolometric flux (in 0.01–100 keV using the best-fit model parameters; in 10−9 erg cm−2 s−1).Download table as: ASCIITypeset image
Then, we probe the spectral evolutions during bursts. For this, we divide each burst duration into several time bins, so that each bin (∼1–5 s) has at least 5000 background-subtracted counts, and perform spectral fitting for each time bin. First, we follow the conventional method of fitting, in which the preburst spectrum is used as the background spectrum (see Section 1). The results for burst-1 are shown in Table 2. Then we use the so-called “fa method” (see Section 1) for each of the two preburst models for burst-1, and Table 2 shows the results. As reported earlier (e.g., Worpel et al. 2013), the “fa method” provides a better fit than the conventional method. We notice that the persistent emission during burst-1, which first increases and then decreases, is always higher than the preburst emission. Moreover, the burst blackbody normalization, which is used to estimate the neutron star radius (Section 1), is usually lower for the “fa method” than for the conventional method. This shows that the conventional method can introduce systematic error in the estimated stellar radius. However, the fa value and burst properties are very similar for the two preburst models, hence, even from the Table 2, we cannot conclude if the Comptonizing layer mainly covers the disk or the neutron star. We note that very similar results are obtained also from the four other bursts.
Table 2. Best-fit Parameters of AstroSat/LAXPC Spectra of the Five Time bins of Burst-1 from 4U 1728–34 with Unevolved Shape of the Persistent Spectrum during the Burst (Section 3)
| Spectral | Time Bin 1 | Time Bin 2 | Time Bin 3 | Time Bin 4 | Time Bin 5 |
|---|---|---|---|---|---|
| Parameters | |||||
| Conventional method of burst spectral fitting (with XSPEC model tbabs∗bbodyrad) | |||||
| kTBBa |

|

|

|

|

|
| NormBBb |

|

|

|

|

|
| Unabs. flux | 17.74 | 26.96 | 21.53 | 11.05 | 5.32 |
| Reduced χ2 (dof) | 1.42 (124) | 1.36 (124) | 1.53 (124) | 2.41 (120) | 1.79 (124) |
| fa method of burst spectral fitting (for blackbody seed photons for nthcomp) | |||||
| fa |

|

|

|

|

|
| kTBBa |

|

|

|

|

|
| NormBBb |

|

|

|

|

|
| Unabs. flux (fa∗nthcomp)c | 8.92 | 9.35 | 12.69 | 14.74 | 7.18 |
| Unabs. flux (bbodyrad)d | 13.87 | 22.61 | 14.46 | 2.18 | 2.91 |
| Obs. flux | 18.80 | 27.10 | 21.87 | 12.34 | 7.13 |
| Reduced χ2 (dof) | 1.24 (123) | 1.24 (123) | 1.25 (123) | 1.45 (123) | 1.46 (123) |
| fa method of burst spectral fitting (for disk blackbody seed photons for nthcomp) | |||||
| fa |

|

|

|

|

|
| kTBBa |

|

|

|

|

|
| NormBBb |

|

|

|

|

|
| Unabs. flux (fa∗nthcomp)c | 9.94 | 10.34 | 14.10 | 16.21 | 7.88 |
| Unabs. flux (bbodyrad)d | 13.84 | 22.63 | 14.42 | 2.24 | 2.93 |
| Obs. flux | 18.81 | 27.11 | 21.88 | 12.35 | 7.13 |
| Reduced χ2 (dof) | 1.23 (123) | 1.24 (123) | 1.25 (123) | 1.47 (123) | 1.49 (123) |
Notes.
aThermonuclear burst blackbody temperature (in keV). bThermonuclear burst blackbody normalization. cUnabsorbed bolometric flux of the evolved persistent component fa∗nthcomp (in 0.01–100 keV using the best-fit model parameters; in 10−9 erg cm−2 s−1). dUnabsorbed bolometric flux of the burst component bbodyrad (in 0.01–100 keV using the best-fit model parameters; in 10−9 erg cm−2 s−1).Download table as: ASCIITypeset image
However, the “fa method” mentioned above, which assumes that the persistent spectral shape remains unchanged during a burst, may not be self consistent in some cases. Suppose the Comptonizing layer partially covers the neutron star during a burst. In such a case, a fraction of the burst photons can directly be detected by the observer, and the rest can be reprocessed by the Comptonizing layer giving rise to the nthcomp spectral component. Hence, the burst temperature, which can be obtained from the directly observed burst blackbody, should be same as the seed photon temperature of nthcomp. Consequently, this seed photon temperature would be different from the preburst value, and the persistent spectral shape would change during a burst. Therefore, next we follow a modified “fa method” starting from the results given in the middle section (the case of blackbody seed photons for nthcomp) of Table 2. We freeze fa, as well as the burst blackbody temperature and normalization, make the frozen nthcomp seed photon temperature the same as the burst blackbody temperature, and thaw the nthcomp photon index and electron temperature. However, the electron temperature should not be less than the seed photon temperature, and should not be more than the preburst electron temperature, as the burst photons may cool down the corona (Kajava et al. 2017b). Therefore, while fitting, we constrain the electron temperature in the range of burst blackbody temperature and preburst electron temperature. These gave unaccepted fits for all time bins of all five bursts (χ2/dof ∼ 3–800, and typically ∼100). Because we assume here that an unknown fraction of burst photons are reprocessed by the Comptonizing layer, it is reasonable to thaw both fa and the burst blackbody normalization. The results with such thawing for burst-1 are given in the first section of Table 3. The χ2/dof values, which are mostly above 2, show that fits are generally unacceptable. In fact, it was not possible to estimate the errors of the best-fit parameters in some cases. The best-fit nthcomp electron temperature also pegs at the nthcomp seed photon temperature for most cases, which implies essentially no Comptonization of burst photons. This is consistent with the fact that fa, hence the flux from the Comptonizing layer, are very low (Table 3). Similar results, i.e., generally high χ2/dof values and very low flux from the Comptonizing layer, are also found for the other four bursts. These show that burst photons are not significantly reprocessed by a Comptonizing layer, and a Comptonizing layer covering the neutron star cannot explain the observed spectra during bursts.
Table 3. Best-fit Parameters of AstroSat/LAXPC Spectra of the Five Time bins of Burst-1 from 4U 1728–34 with Evolved Shape of the Persistent Spectrum during the Burst (Section 3)
| Spectral | Time Bin 1 | Time Bin 2 | Time Bin 3 | Time Bin 4 | Time Bin 5 |
|---|---|---|---|---|---|
| Parameters | |||||
| Burst blackbody provides seed photons for the evolved persistent component nthcomp | |||||
| fa | 0.01 | 0.002 | 0.002 |

|

|
| Γ (nthcomp) | 10 | 10 | 10 |

|

|
 (nthcomp) (nthcomp) |
2.64 | 2.63 | 2.33 |

|

|
 (nthcomp) (nthcomp) |
|||||
| = kTBB (bbodyrad) | |||||
| (frz) | 2.64 | 2.63 | 2.33 | 1.69 | 1.30 |
| NormBB (bbodyrad) | 40.60 | 59.40 | 79.61 |

|

|
| Unabs. flux (fa∗nthcomp) | 0.28 | 0.06 | 0.04 | 3.26 | 2.49 |
| Unabs. flux (bbodyrad) | 21.23 | 30.59 | 25.25 | 11.80 | 6.42 |
| Obs. flux | 19.30 | 27.47 | 21.88 | 12.08 | 7.06 |
| Reduced χ2 (dof) | 2.82 (122) | 2.41 (122) | 2.41 (122) | 2.19 (122) | 1.51 (122) |
| The disk (which is not directly seen) provides seed photons for the evolved persistent component nthcomp | |||||
| fa |

|

|

|

|

|
| Γ (nthcomp) |

|

|

|

|

|
 (nthcomp) (nthcomp) |

|

|

|

|

|
 (nthcomp) (nthcomp) |

|

|

|

|

|
| kTBB (bbodyrad) (frz) | 2.64 | 2.63 | 2.33 | 1.68 | 1.30 |
| NormBB (bbodyrad) |

|

|

|

|

|
| Unabs. flux (fa∗nthcomp) | 14.23 | 14.38 | 16.66 | 18.06 | 11.02 |
| Unabs. flux (bbodyrad) | 9.5 | 18.67 | 11.76 | 0.74 | 1.12 |
| Obs. flux | 18.85 | 27.14 | 21.91 | 12.34 | 7.13 |
| Reduced χ2 (dof) | 1.22 (121) | 1.23 (121) | 1.26 (121) | 1.49 (121) | 1.39 (121) |
Download table as: ASCIITypeset image
Now, we probe the other scenario, i.e., the Comptonizing layer covering the disk and reprocessing its emission. As our spectral model does not explicitly include a disk component, we cannot tie a disk blackbody temperature with the nthcomp seed photon temperature. Therefore, we start from the results given in the last section of Table 2, and thaw the nthcomp photon index, seed photon temperature and electron temperature. However, as explained earlier, we constrain the electron temperature at or below its preburst value. We also freeze the best-fit burst blackbody temperature of Table 2, but we keep fa, which determines the overall normalization of the persistent nthcomp component, as a free parameter. The results of these fits for burst-1 are given in the last section of Table 3. The fits are acceptable, and the χ2/dof values are clearly much smaller than those for the reprocessing of burst emission case (given in the first section of Table 3). These results are generally similar for other four bursts, and show that the scenario of the Comptonizing layer covering the disk and reprocessing the disk emission is favored. Therefore, it is likely that the enhanced persistent emission during a burst is due to an increased accretion rate via disk (see Section 1).
Note that an increased accretion rate may imply a higher disk temperature during the burst, and generally a persistent spectral shape evolved from the preburst spectral shape. However, due to large errors of best-fit spectral parameter values, we can neither establish a persistent spectral shape evolution, nor rule out this possibility (Tables 1 and 3). Besides, a part of the enhanced persistent emission could be due to the reflection of burst photons from the disk. While the relatively small number of observed counts during a burst time bin does not allow us to test this rigorously, we did attempt to include a broad Gaussian emission component, representative of the broad Fe Kα emission line, as a proxy to the reflection spectral component. This is because this line can be the most prominent feature in the reflection spectrum (Fabian et al. 2000; Bhattacharyya & Strohmayer 2007). Because this Gaussian component is not significant (e.g., <2σ for burst-1 time bins), we conclude that the reflection of burst photons from the disk may not be substantial in this case.
4. Discussion
In this paper, we have analyzed individual thermonuclear X-ray bursts from 4U 1728–34 in the soft state observed with a new X-ray instrument AstroSat/LAXPC. We show that the burst emission is not significantly reprocessed by a Comptonizing layer (e.g., a spreading boundary layer) covering the neutron star. Rather, the burst emission possibly increases the disk emission by enhancing the accretion rate via disk, perhaps due to Poynting–Robertson drag on the accretion disk. This increased disk emission, Comptonized by a corona covering the disk, provides an enhanced persistent emission during a burst. This conclusion has the following implications: (1) it provides an understanding of persistent emission components, and suggests that the corona covers the accretion disk and reprocesses disk emission; (2) it provides an understanding of effects of the burst emission on persistent emission in the soft state and (3) as the burst emission is not significantly reprocessed by the corona, this emission could be reliably distinguished from the persistent or non-burst emission, which is required to reduce systematics in neutron star radius measurements using burst spectra. This is important because stellar radius measurement by this method is a goal of future X-ray instruments. Finally, we note that the burst ignition latitude could be inferred from the shape of the burst rising light curve (Maurer & Watts 2008; Chakraborty & Bhattacharyya 2014). We find that this shape depends on which method of spectral fitting is used.
We acknowledge the LAXPC Payload Operation Center (TIFR, Mumbai) and Indian Space Research Organization for their support.
Footnotes
- 8
- 9