Abstract
Metal-poor nearby galaxies hosting massive stars have a fundamental role to play in our understanding of both high-redshift galaxies and low-metallicity stellar populations. But while much attention has been focused on their bright nebular gas emission, the massive stars that power it remain challenging to constrain. Here we present exceptionally deep Hubble Space Telescope ultraviolet spectra targeting six local (z < 0.02) galaxies that power strong nebular C iv emission approaching that encountered at z > 6. We find that the strength and spectral profile of the nebular C iv in these new spectra follow a sequence evocative of resonant scattering models, indicating that the hot circumgalactic medium likely plays a key role in regulating C iv escape locally. We constrain the metallicity of the massive stars in each galaxy by fitting the forest of photospheric absorption lines, reporting measurements driven by iron that lie uniformly below 10% solar. Comparison with the gas-phase oxygen abundances reveals evidence for enhancement in O/Fe 2–4 times above solar across the sample, robust to assumptions about the absolute gas-phase metallicity scale. This supports the idea that these local systems are more chemically similar to their primordial high-redshift counterparts than to the bulk of nearby galaxies. Finally, we find significant tension between the strong stellar wind profiles observed and our population synthesis models constrained by the photospheric forest in our highest-quality spectra. This reinforces the need for caution in interpreting wind lines in isolation at high redshift, but also suggests a unique path toward validating fundamental massive star physics at extremely low metallicity with integrated ultraviolet spectra.
Original content from this work may be used under the terms of the Creative Commons Attribution 4.0 licence. Any further distribution of this work must maintain attribution to the author(s) and the title of the work, journal citation and DOI.
1. Introduction
Nearby star-forming dwarf galaxies beyond the Local Group are a crucial testbed for the physics of massive stars and gas at very low metallicities. The possible nature of these blue, H ii region–like galaxies as genuinely primordial systems captured during their first episodes of star formation was emphasized and debated soon after their discovery (e.g., Sargent & Searle 1970; Searle & Sargent 1972; Searle et al. 1973). A modern view paints these systems as different from true nascent galaxies in important ways, including their absolute mass scale and likely longer-term bursty star formation histories. While the debate continues regarding the precise differences with their high-redshift counterparts, metal-poor local dwarf galaxies remain the most accessible venue in which to empirically confront models for the very low-metallicity young stellar populations we expect to encounter at the highest redshifts.
The value of such rare very metal-poor dwarfs is particularly well illustrated by efforts to understand the strong C iv emission recently uncovered in the reionization era. In two of the first deep rest-ultraviolet (UV) spectra obtained for Lyα emitters at z ≳ 6, nebular emission in the resonant C iv λ λ1548, 1550 doublet is detected at implied doublet equivalent widths of 20–40 Å (Stark et al. 2015; Mainali et al. 2017; Schmidt et al. 2017). Strong limits placed on other UV lines in one of the systems support a stellar (over a power law) ionizing radiation source (Mainali et al. 2017), yet stellar models struggle to reproduce such prominent emission, only approaching the observed equivalent widths at extremely low metallicities. However, an empirical basis for this potential connection to very metal-poor stars remains elusive. Nebular emission in C iv is exceedingly rare at any strength in star-forming galaxies at lower redshifts, where this doublet is generally dominated by a broad P-Cygni profile powered in the winds of luminous OB stars (e.g., Prinja & Crowther 1998; Shapley et al. 2003; Steidel et al. 2016; Rigby et al. 2018). The canonical picture from observations of star-forming galaxies in the local universe with the initial complement of Hubble Space Telescope (HST) UV instruments supported this picture of C iv as a purely wind and interstellar medium (ISM) absorption feature (e.g., Leitherer et al. 2011). The prominent nebular C iv encountered in pathfinder z > 6 campaigns is a dramatic departure from this local context, and the resulting difficulty in interpreting this emission foreshadows potentially serious challenges in understanding rest-UV spectra at the highest redshifts with the James Webb Space Telescope (JWST).
Fortunately, the highly sensitive fourth-generation HST/Cosmic Origins Spectrograph (COS) has unveiled UV spectra of a dramatically different character than those found in previous local surveys. In particular, several HST/COS programs have now identified a population of star-forming galaxies with C iv in clear nebular emission alongside nebular He ii, at equivalent widths of ∼1–15 Å (Berg et al. 2016; Senchyna et al. 2017, 2019; Berg et al. 2019b, 2019a; Schaerer et al. 2022). These systems confirm that star-forming galaxies can power nebular C iv approaching the large equivalent widths observed at z > 6, but only at both sufficiently young effective ages (or high specific star formation rates; sSFRs) and extremely low metallicities (12 + logO/H ≲ 7.7; corresponding to Z/Z⊙ ≲ 10%), a parameter space occupied locally by primarily relatively low-mass galaxies missed by previous UV programs (Senchyna et al. 2019).
The establishment of this local reference sample of C iv emitters represents a unique opportunity to directly link high-ionization nebular emission to the fundamental properties of the underlying stellar populations, which are generally inaccessible at high redshift. However, several outstanding questions in the interpretation of these galaxies suggest our picture of them is not yet complete. While it is immediately clear that low gas-phase metallicities and young ages are a necessary condition for nebular C iv production in nearby star-forming systems, it is less obvious why galaxies with nearly identical Hβ equivalent widths and gas-phase metallicities would present such different C iv equivalent widths (Berg et al. 2019b; Senchyna et al. 2019). In addition, the significant gap between the largest C iv nebular emission equivalent width observed locally of 10–15 Å and the 20–40 Å emission measured at z > 6 is suggestive of potential differences between this reionization era population and these local metal-poor dwarfs of still unclear origin.
There is still a crucial quantity missing in our attempts to understand these findings: stellar metallicity. In a situation common to H ii regions and star-forming galaxies, strong optical nebular lines readily yield the gas-phase abundances of oxygen and nitrogen (and carbon through the UV C iii] line) as well as neon and argon, all of which except for nitrogen are α elements, synthesized and released mainly in intermediate-mass to massive stars on short timescales. However, iron and iron-peak elements play an outsized role in shaping the spectra of massive stars, whose numerous freed electrons and electronic transitions in the EUV–UV are crucial sources of opacity, especially near their surface wind-driving regions (e.g., Hubeny & Mihalas 2014; Vink 2021). The full promise of nearby star-forming galaxies as laboratories for studying young stellar populations and their impact on their environs cannot be fully realized without constraints on the stellar metallicity and in particular the stellar iron abundance.
Unfortunately, typical CNO gas-phase abundances tell us little about the total metallicity of the underlying massive stars. In contrast to the CNO and α elements, iron is released into the ISM for subsequent star formation mainly by Type Ia supernovae (SNe) which occur after a significant ∼ Gyr delay after a star formation episode. As a result, α/Fe ratios can be expected to vary dramatically with star formation history, generally decreasing significantly with time after a peak in star formation rate as α-rich yields from massive stars are slowly diluted by iron-rich Type Ia products. This is observed directly in the abundance patterns of individual stars in the Milky Way (MW), its satellites, and other Local Group galaxies (e.g., McWilliam 1997; Tolstoy et al. 2009). The natural expectation for assembling galaxies in the early universe which have just begun to form stars is thus a significant enhancement in α/Fe over the solar value, with magnitude dependent upon the uncertain contribution of Population III enrichment (e.g., Bromm & Yoshida 2011; Frebel & Norris 2015). An increasing number of reports suggest that such an enhancement is necessary to reconcile the low stellar metallicities relative to the gas-phase oxygen abundance inferred from observations of nebular emission and UV continuum light in massive galaxies at z ∼ 2 (e.g., Steidel et al. 2016; Strom et al. 2017; Sanders et al. 2020; Topping et al. 2020a; Cullen et al. 2021; Strom et al. 2022).
Despite this surge of interest at z ∼ 2, relatively little progress has been made in assessing the stellar abundances of extreme metal-poor star-forming galaxies nearby like the nebular C iv emitters. The optical absorption lines commonly used to assess stellar metallicities such as the Lick indices (e.g., Gallazzi et al. 2005) are washed out by light from the hot stars and nebular continuum dominating these high-sSFR systems, and regardless do not directly assess the abundances of the massive stars themselves. The gas-phase iron abundance can also be derived from collisionally excited lines of Fe iii–Fe v, but this is subject to significant systematic uncertainties in the ionization correction factors adopted and the assumed depletion onto dust (e.g., Izotov et al. 2006; Kojima et al. 2021; Berg et al. 2021). Another approach seeks to derive stellar metallicities based upon photoionization modeling of nebular lines with flexible stellar population synthesis models, where the leverage on [Fe/H] resides in the theoretical model-predicted changes in the shape of the ionizing spectrum with Z (e.g., Strom et al. 2017, 2018; Sanders et al. 2020; Runco et al. 2021). While insightful, these nebular-line-focused techniques remain indirect probes of the abundances of the massive stars themselves.
The most direct path toward stellar abundances in these systems is through their UV continuum light, and in particular, the photospheric iron lines encountered there (e.g., Bouret et al. 2003; Hillier et al. 2003; Rix et al. 2004). These lines probe iron in the atmospheres of the massive stars which dominate these galaxies and bypass the substantial modeling uncertainties inherent in the analysis of the stellar wind lines. Unfortunately, the generally single-orbit HST/COS spectra in which the strong nebular C iv emission was initially observed are too shallow to detect these blended absorption features; indeed, the target galaxies are often too low in metallicity for even the usually strong stellar P-Cygni wind profile in C iv to be detected in these spectra. To remedy this, we obtained new ultra-deep HST/COS G160M far-UV (FUV) spectroscopy with exposure times of 5–10 orbits per galaxy for six galaxies powering nebular C iv emission during HST Cycles 26 and 27. These new spectra provide a more detailed view of C iv and strong constraints on stellar wind and photospheric lines in the FUV continuum, allowing us to link this high-ionization emission to the fundamental properties of the underlying stellar populations.
This paper focuses on C iv and the stellar features in these new ultra-deep HST/COS spectra, and is organized as follows. In Section 2, we describe the target sample and derive constraints on their gas-phase metallicities and bulk stellar properties from their optical spectra. Section 3 presents the new HST/COS spectroscopic observations including their reduction and basic analysis. We describe our fits to the UV continuum with stellar population synthesis models to constrain the stellar metallicity in Section 4, and the results of these fits are presented in Section 5. Finally, we discuss these results in contexts ranging from local galaxy abundances to high-redshift nebular emission in Section 6, before summarizing and concluding in Section 7.
Unless otherwise stated, equivalent widths are reported as positive for emission and negative for absorption, and all logarithmic quantities presented herein should be assumed to be in base-10. When comparing with solar abundances, we adopt the composition assumed by our fiducial stellar population synthesis models from S. Charlot & G. Bruzual (in preparation, hereafter C&B; see Gutkin et al. 2016; Plat et al. 2019), which differ only slightly from the compilation adopted by the underlying parsec stellar evolution code as described in Bressan et al. (2012). In particular, this sets the present-day solar oxygen abundance at 12 + logO/H = 8.83 8 (corresponding to a gas-phase abundance with typical depletion of 8.71), solar iron at 12 + logFe/H = 7.52, and total metallicity at Z⊙ = 0.01524 (Caffau et al. 2008, 2011). 9
2. A Sample of Very Metal-poor Galaxies with Prominent Active Star Formation
While a population of nearby dwarf galaxies at 12 + logO/H < 8.0 and particularly high sSFR have been identified as sources of nebular C iv emission, the existing shallow HST/COS spectra of these galaxies preclude a detailed assessment of the stellar populations underlying this emission. We selected a sample of six of these local C iv emitters to follow up with deep FUV spectroscopy targeting both C iv and the photospheric signatures of their constituent massive stars. The target systems were selected from the HST/COS G140L samples assembled by Berg et al. (2016, hereafter B16) and Berg et al. (2019b, B19), and the G160M+G185M samples of Senchyna et al. (2017, S17) and Senchyna et al. (2019, S19), which together with Wofford et al. (2021) comprise the entire sample of local (z < 0.1) star-forming systems with reported nebular C iv detections. In particular, we selected our sample to include the two highest equivalent width nebular emitters in this doublet known locally at the time of the proposal (J104457 at 11 Å and HS 1442+4250 at 4 Å; S16; S19, see also Schaerer et al. 2022 who present two 10–15 Å detections at z = 0.3–0.4), two of the systems with the highest gas-phase metallicities still powering nebular emission in C iv (SB 2 and 82, at 12+logO/H ≃ 7.8–7.9; S17), and two metal-poor systems with extremely high equivalent width optical line emission yet relatively modest C iv equivalent widths < 4 Å (J082555 and J120202; B16; S17). These systems were targeted with HST/COS G160M/1533 spectroscopy with allocations of 5–10 orbits each over the course of two HST programs (GO:15646 and GO:15881, PI: Stark) which we describe in Section 3. The basic properties of this sample of C iv emitters are summarized in Table 1 and described in the remainder of this section.
Table 1. The Six Local Star-forming Systems Targeted for Deep G160M Spectroscopy
| Target | R.A. | Decl. | z | Distance | O32 | Hβ | E(B − V) |

| Optical |
|---|---|---|---|---|---|---|---|---|---|
| Name | (J2000) | (J2000) | (HST/COS) | (Mpc, CF3) | W0/Å | int. (Gal.) | Source | ||
| J082555 | 08:25:55.52 | +35:32:32.0 | 0.0024 | 13 | 16.1 ± 1.6 | 264 ± 21 | 0.06(0.04) | 7.44 ± 0.04 | SDSS+Bok |
| SB 2 | 09:44:01.87 | −00:38:32.2 | 0.0049 | 21 | 7.3 ± 0.8 | 276 ± 11 | 0.15(0.05) | 7.81 ± 0.05 | SDSS+MMT (S17) |
| J104457 | 10:44:57.80 | +03:53:13.1 | 0.0129 | 57 | 18.1 ± 2.0 | 264 ± 21 | 0.08(0.04) | 7.48 ± 0.06 | SDSS+Bok |
| SB 82 | 11:55:28.34 | +57:39:51.9 | 0.0172 | 77 | 9.6 ± 1.0 | 175 ± 3 | 0.14(0.03) | 7.93 ± 0.04 | SDSS+MMT (S17) |
| J120202 | 12:02:02.49 | +54:15:51.0 | 0.0120 | 58 | 9.2 ± 0.4 | 271 ± 8 | 0.05(0.01) | 7.50 ± 0.03 | SDSS (BOSS) |
| HS1442+4250 | 14:44:11.47 | +42:37:35.5 | 0.0022 | 11 | 10.2 ± 0.5 | 113 ± 4 | 0.02(0.01) | 7.66 ± 0.04 | MMT (S19) |
Note. Included here are the target names: the coordinates of the region targeted with HST/COS in the Sloan Digital Sky Survey (SDSS) imaging frame; the redshift measured from the HST/COS spectrum; the corresponding luminosity distance estimated from Cosmicflows-3 (CF3; Graziani et al. 2019; Kourkchi et al. 2020); and gas-phase measurements of O32 ([O iii] λ4959 + λ5007/[O ii] λ3727 flux ratio, extinction corrected), the rest-frame Hβ equivalent width, and direct-Te oxygen abundance (see Section 2.1 and 2.2).
Download table as: ASCIITypeset image
2.1. Gas-phase Conditions and Metallicities
The optical nebular emission lines provide key insight into the properties of the ionized gas in these galaxies including the abundance of oxygen in the gas phase. This is of particular interest as a point of comparison in the stellar abundance analysis that the new ultraviolet data enables. Leveraging the detections of the auroral [O iii] λ4363 line for all six, we derive a self-consistent set of gas-phase oxygen abundances via the direct-Te method (following the general procedure described also in S17 and S19). For this analysis we rely on the designated sciencePrimarySDSS spectrum for all of the targets except for HS 1442+4250 which does not have an SDSS spectrum. In this case, we rely instead on the MMT Blue Channel spectrum described in S19. First, we measure the flux and equivalent width of the necessary optical lines by fitting a Gaussian (or pair thereof for close doublets) plus linear local continuum model to each, using emcee (Foreman-Mackey et al. 2013) to compute the uncertainties on the fit parameters. The fluxes of these lines are corrected for reddening, first Galactic (using the Schlafly & Finkbeiner 2011 reddening map and assuming a Fitzpatrick 1999 reddening law) and then intrinsic assuming a Small Magellanic Cloud (SMC) extinction curve (Gordon et al. 2003). We use the pyneb library to derive constraints on the gas parameters of interest from these line measurements. 10 In particular, we adopt a standard two-zone H ii region model, computing the Te and ne relevant for the O+ and O2+ regions through cross convergence of the ne -sensitive S ii λ λ6731, 6716 ratio with the Te -sensitive ([O ii] λ λ3726, 3729, 11 [O ii] λ λ7320, 7330) and ([O iii] λ4363, [O iii] λ5007) ratios (respectively). The exception to this procedure is HS 1442+4250 for which [O ii] λ λ7320, 7330 is undetected in our MMT spectrum; in this case, we instead rely on the empirical relationship between Te (O II) and Te (O III) derived for metal-poor galaxies by Izotov et al. (2006) to estimate the temperature of the lower-ionization region. We estimate uncertainties in the final quantities of interest by bootstrap resampling the Gaussian line flux uncertainty distributions and recalculating all quantities of interest (with line ratio combinations recognized as invalid by pyneb according to our adopted atomic data discarded).
In addition to the primary SDSS and MMT spectra, these gas-phase measurements must also in four cases rely on shallow bluer spectra to obtain measurements of the [O ii] λ3727 doublet which remains below the 3800 Å blue cutoff of the original SDSS I/II spectrograph at these low redshifts (z < 0.02). 12 Specifically, SB 2 and 82 have [O ii] constraints from MMT Blue Channel spectra described in S17. We also rely on new Bok spectra to constrain [O ii] λ3727 for J082555 and J104457; both were observed with the Bok B&C spectrograph and the 300 g mm−1 grating (spanning 3500–7500 Å) with 3 × 15 minutes integrations on 2021 March 3. These data were reduced using standard longslit techniques in IRAF. As done also for the supplementary MMT spectra, we translate the measured [O ii] doublet flux measured in the Bok spectra to the SDSS flux scale by applying a correction derived from the ratio of the strong optical lines in common between the SDSS and Bok spectra, and adopt a conservative uncertainty of 10% in this rescaled doublet flux.
The resulting direct-Te oxygen abundances (Table 1) confirm that these C iv emitters harbor very metal-poor gas. The values range from 12 + logO/H = 7.44 in the lowest-metallicity case (J082555) up to 7.93 in the highest (SB 82). This corresponds to a range of 5%–15% of the solar photospheric oxygen value, with all but SB 2 and SB 82 falling below 10% and thus in the realm of designated extremely metal-poor galaxies (XMPs). Since these are measured in essentially the same way and with the same data as in S17 and S19, the metallicity measurements are by construction in very good agreement with those results. Our metallicity estimates are slightly different from those presented in B16 for J082555 (0.07 dex higher) and J104457 (0.03 dex higher), and from B19 for J120202 (0.13 dex lower). We attribute these generally small discrepancies to differences in our assumed atomic data and methodology (most significantly, our uniform [O ii] λ3727 access and our choice to estimate Te ([O ii]) from the [O ii] λ7325/λ3727 ratio).
We also measure uniformly large flux ratios O32 ([O iii]λ4959 + λ5007/[O ii] λ3727, after extinction correction) of 7–18, and generally very prominent gas emission relative to the stellar continuum with Hβ at (rest-frame) equivalent widths 13 of 113–276 Å. Together, these measurements paint a picture of systems dominated by recently formed stars with strong ionizing continua.
2.2. Bulk Stellar Properties
The optical spectroscopy and imaging (Figure 1) for these systems provide quantitative constraints on the age and mass of stars formed in their recent dominant star formation event. This can act as a valuable prior in the interpretation of the UV spectra that we will focus on in the remainder of this paper. To extract these optical constraints, we first measure 3″ diameter aperture photometry (corresponding approximately to the HST/COS 25 diameter aperture convolved with the median SDSS rband seeing of 1
3) in all five (
 ) SDSS broadband mosaics for each source centered on the spectroscopic target. We then fit these fluxes with beagle (Chevallard & Charlot 2016) alongside the equivalent width of Hβ measured in the optical spectrum for each. Together with the strong band contamination in
  and
and  produced by the [O iii] and Balmer lines at these low redshifts, these measurements provide constraints on both the total stellar mass and SFR of the current star formation event. The models employed here are the same as those used to fit the UV continuum described below (Section 4.1), but with an initial mass function (IMF) upper-mass cutoff of 300 M⊙ (minimal differences were found between the 300 and 600 M⊙ models in the photospheric metallicity results presented in Section 5) and with nebular emission lines included so as to self-consistently account for the strong line contributions in the optical broadbands. We perform this modeling assuming both a constant star formation history with variable age (or start time) and a simple (single, variable age) stellar population, representing two approximations of a recent “burst” of star formation (see also Section 4.1). In both cases we adopt uniform priors for the two corresponding star formation history parameters: age (allowed to vary from 1 to 100 Myr) and stellar mass (up to 109
M⊙). We allow the tied stellar and gas-phase metallicity (0.006–1.0 Z⊙), nebular
produced by the [O iii] and Balmer lines at these low redshifts, these measurements provide constraints on both the total stellar mass and SFR of the current star formation event. The models employed here are the same as those used to fit the UV continuum described below (Section 4.1), but with an initial mass function (IMF) upper-mass cutoff of 300 M⊙ (minimal differences were found between the 300 and 600 M⊙ models in the photospheric metallicity results presented in Section 5) and with nebular emission lines included so as to self-consistently account for the strong line contributions in the optical broadbands. We perform this modeling assuming both a constant star formation history with variable age (or start time) and a simple (single, variable age) stellar population, representing two approximations of a recent “burst” of star formation (see also Section 4.1). In both cases we adopt uniform priors for the two corresponding star formation history parameters: age (allowed to vary from 1 to 100 Myr) and stellar mass (up to 109
M⊙). We allow the tied stellar and gas-phase metallicity (0.006–1.0 Z⊙), nebular  (−4–−1), and dust attenuation (assuming an SMC curve,
  –2) to vary over their respective uniform priors.
The absolute magnitude of the mass and star formation rates derived from this fitting depend upon the assumed luminosity distance to these targets. While fortunately our analysis does not depend strongly on the exact value of these stellar masses or thus this distance, it is important to note that at very low redshifts z < 0.01 (corresponding to velocities <1000 km s−1) peculiar motions begin to approach and potentially exceed the velocity of the Hubble flow. Without a means of more robust distance measurement, our best option remains a comparison of the measured redshifts to a model for the peculiar velocity field in the local universe. We update our distance estimates in this analysis to the Cosmicflows-3 local flow model (Graziani et al. 2019; Kourkchi et al. 2020), first converting our heliocentric redshifts to the Local Sheet reference frame (Tully et al. 2008; Kourkchi et al. 2020) and then obtaining the corresponding distance from the smoothed Cosmicflows-3 model (none of our objects were found to have multiple degenerate solutions). The distances thereby obtained are displayed in Table 1. Differences from previous estimates relying on other local flow models are generally small. With respect to the published distances of S17 and S19 in particular, we find changes of ≤2 Mpc (≲10%) for SB 2, SB 82, and HS 1442+4250.
The resulting measurements of the effective young stellar population age and (distance-dependent) stellar mass within the spectroscopic aperture are presented in Table 2. These fits confirm that the broadband data for these systems are consistent with low-mass stellar populations ∼ 104–106 M⊙ with young effective ages in the range of 3–22 Myr assuming a constant star formation history or 2–3 Myr assuming a single-age stellar population, both of which are able to reasonably match the photometric data and Hβ equivalent widths. However, a more detailed view of the massive stars present requires deep UV spectra.
Table 2. beagle SED Fits to the Broadband SDSS ugriz Photometry
| Target | CSFH | SSP | ||
|---|---|---|---|---|
| Name |

| t/Myr |

| t/Myr |
| J082555 | 4.03 ± 0.03 |

| 4.25 ± 0.05 |

|
| SB2 | 5.14 ± 0.02 |

| 5.35 ± 0.01 |

|
| J104457 | 5.53 ± 0.02 |

| 5.67 ± 0.02 |

|
| SB82 | 6.29 ± 0.02 |

| 6.69 ± 0.01 |

|
| J120202 | 5.17 ± 0.21 |

| 5.22 ± 0.04 |

|
| HS1442+4250 | 4.60 ± 0.02 |

| 4.61 ± 0.03 |

|
Note. The BEAGLE fits naturally account for nebular line contamination to the broadband photometry; this contribution is additionally constrained by the explicit inclusion of the measured Hβ equivalent widths in the fits. We include the stellar mass and age assuming both a constant star formation history with variable start and a single-age stellar population model for the young stellar component that dominates the optical and UV for these systems.
Download table as: ASCIITypeset image
3. Ultra-deep COS Spectroscopy
In this section, we first summarize the new FUV spectroscopic observations we have obtained, designed to deliver detailed constraints on the massive stars in these C iv emitters (Section 3.1 and described in more detail in Appendix A). Then, we provide an overview of these new spectra and the strength of nebular and stellar features derived therefrom (Section 3.2) before proceeding to describe the detailed continuum fitting we perform in Section 3.1.
3.1. Summary of Observations
New extremely deep spectra of the six target C iv emitters were obtained for the target systems in two GO programs (proposal IDs 15646 and 15881, PI: Stark) selected and executed as part of Cycles 26 and 27. All of the spectroscopic observations for both programs were made using the new G160M/1533 Å central wavelength setting introduced in Cycle 26 (e.g., Fox et al. 2019). This setting produces spectra spanning 1339–1710 Å with the FUVA/FUVB detector gap at 1520–1530 Å, which at the low redshifts < 0.02 of our targets (Table 1) allows us to simultaneously access the C iv λ λ1548, 1550 and He ii λ1640 nebular and stellar wind complexes alongside the wind and photospheric complexes at ∼1350–1500 Å.
Given the uncertain nature of the strength of the target continuum features at these low metallicities, we allotted a uniform 10 (GO:15646) or 5 (GO:15881) orbits in total to each system. These exposure times were designed to ensure a minimum signal-to-noise (S/N) ratio per-resolution element (resel; 6 pixels, or 0.07 Å for G160M) of 10 (corresponding to S/N > 30 per Å). A detailed accounting of the observing strategy and calibration procedures is provided in Appendix A. In summary, the observations were conducted over the course of 16 visits total, including visits lost to guide star acquisition issues and those scheduled as repeats (summarized in Table 3). We used calcos to combine and calibrate all of the successful observations for each object. Our results confirm the appropriateness of the standard extraction techniques for these targets, but we derive a correction factor for the formal calcos uncertainties which we find are likely overestimated for the faint continuum sources in our sample.
Table 3. HST/COS UV Spectroscopic Observations
| Target | Proposal/ | Visits | Fλ (1450Å) | Total Exposure | S/N(1450 Å) per resel (0.07 Å) | |
|---|---|---|---|---|---|---|
| Name | Program ID | (UT start) | ×10−15 erg/s/cm2/Å | Time (s) | (calcos reported) | (corrected) |
| J082555 | GO:15881/LE4Z | 01 (2020-03-01) | 1.16 | 12869 | 8.4 | 12.5 |
| 02 (2020-04-24) | ||||||
| 03 (2020-02-18)‡ | ||||||
| 53 (2020-03-30)† | ||||||
| SB2 | GO:15646/LDXT | 03 (2020-04-05) | 0.87 | 26925 | 10.8 | 14.9 |
| 04 (2020-04-06) | ||||||
| J104457 | GO:15646/LDXT | 07 (2020-05-18) | 1.55 | 26365 | 15.7 | 21.0 |
| 08 (2020-04-07)† | ||||||
| SB82 | GO:15646/LDXT | 01 (2019-11-21) | 3.51 | 29256 | 24.0 | 28.2 |
| 02 (2019-11-21) | ||||||
| J120202 | GO:15881/LE4Z | 04 (2020-04-26) | 1.05 | 13498 | 7.7 | 10.9 |
| 05 (2020-04-26) | ||||||
| 06 (2020-04-12) | ||||||
| HS1442+4250 | GO:15646/LDXT | 05 (2019-10-11) | 2.08 | 27137 | 18.6 | 24.7 |
| 06 (2019-10-09)† | ||||||
| 56 (2019-12-26) | ||||||
Note. All executed visits are listed for each object and for the entirety of both proposals (GO:15646 and GO:15881). Visits with an exception report (some of which did not yield useful data as a result) are indicated with a † and discussed in Section 3; the one visit during which usable spectroscopic data was not taken at all is marked with a ‡. The final columns list the S/N per-resolution element (6 pixels, or ∼0.073 Å) averaged near 1450 Å both as initially reported by calcos in the reduced one-dimensional spectrum, and after correction based upon the observed scatter in the continuum (see text).
Download table as: ASCIITypeset image
The final combined and corrected G160M spectra all exceed the target S/N of 10 per resel at 1450 Å, sufficient for a detailed investigation of the stellar continuum in these extreme C iv emitters.
3.2. Overview of the New Spectra
In this section we provide a broad overview of the new, deep view of both ionized gas and the underlying massive stars that the new HST/COS spectra afford.
The most striking feature dominating the new G160M/1533 spectra of all six targets is the extraordinarily strong nebular emission from highly ionized gas species on which these galaxies were selected. Both components of the semiforbidden O iii] λ1661, 1666 doublet, the He ii λ1640 recombination line, and the C iv λ λ1548, 1550 resonant doublet are detected in all six systems. We fit these lines individually with Gaussians after rebinning the spectra to one resolution element (six pixels). Comparison with the vacuum wavelengths of these transitions yields the new systemic redshift measurements for our systems presented in Table 1 and utilized throughout our analysis. We find a small <10 km s−1 (≲1%) error in this redshift measurement based on the line-to-line variation and the formal fitting uncertainties in the central wavelengths, and thus the uncertainties in these redshifts are likely close to the uncertainty in the medium grating wavelength calibration of 15 km s−1 (Hirschauer et al. 2021). Measurements of these line fluxes are presented in Table 4.
Table 4. UV Nebular Emission Line Measurements and Stellar Absorption Indices
| Target | C iv λ1549 | Nebular Line Fluxes (10−15 erg/s/cm2) | Stellar Index Equivalent Widths (integrated, Å) | |||||
|---|---|---|---|---|---|---|---|---|
| Name | Nebular W0/Å | C iv λ1549 | He ii λ1640 | O iii] λ1661 | O iii] λ1666 | C iv λ1549 (P-Cygni) | Bl1425 | Fe1453 |
| J082555 | 2.14 ± 0.17 | 2.19 ± 0.16 | 0.15 ± 0.07 | 1.35 ± 0.09 | 2.83 ± 0.10 | −0.22 ± 0.18 | 0.02 ± 0.09 | 0.24 ± 0.13 |
| SB2 | 0.77 ± 0.12 | 0.66 ± 0.10 | 1.25 ± 0.06 | 1.50 ± 0.12 | 3.08 ± 0.13 | −0.53 ± 0.11 | −0.21 ± 0.08 | −0.41 ± 0.10 |
| J104457 | 10.60 ± 0.48 | 15.57 ± 0.45 | 3.12 ± 0.16 | 2.92 ± 0.13 | 7.13 ± 0.16 | 0.37 ± 0.09 | 0.24 ± 0.07 | −0.27 ± 0.07 |
| SB82 | 1.23 ± 0.08 | 3.67 ± 0.21 | 1.46 ± 0.10 | 2.19 ± 0.10 | 5.81 ± 0.14 | −2.37 ± 0.06 | −0.48 ± 0.05 | −0.77 ± 0.05 |
| J120202 | 1.46 ± 0.14 | 1.26 ± 0.11 | 0.67 ± 0.08 | 0.84 ± 0.07 | 2.02 ± 0.08 | 0.01 ± 0.17 | −0.12 ± 0.12 | −0.14 ± 0.13 |
| HS1442+4250 | 3.87 ± 0.11 | 7.09 ± 0.18 | 2.88 ± 0.07 | 1.40 ± 0.10 | 2.99 ± 0.10 | −0.54 ± 0.08 | −0.53 ± 0.04 | −0.64 ± 0.06 |
Note. Measured in the new G160M spectra. Nebular emission in C iv, He ii, and both O iii] components are detected in all six targets, and constraints on the integrated equivalent width of several key broad stellar absorption indices are also presented.
Download table as: ASCIITypeset image
These new deep FUV spectra are especially notable for providing an exquisite view of the multicomponent high-ionization C iv doublet, illustrating the power of deep UV spectra to probe the detailed physics of star-forming galaxies. While all of the targets were selected on the identification of nebular C iv emission in archival HST/COS spectra, these shallower spectra did not provide a complete picture of this doublet. In particular, J082555 and J120202 were previously only observed with the low-resolution COS/G140L grating in the FUV which affords nearly an order of magnitude lower spectral resolution than G160M, precluding clear disentanglement of the nebular emission profile from interstellar absorption. In addition, the broad (>1000 km s−1) and metallicity dependent stellar wind contribution to this complex was generally too weak to be confidently detected in the single-orbit spectra obtained previously for this metal-poor galaxy sample (though see Senchyna et al. 2019), leaving us with minimal information about the massive stars underlying this emission.
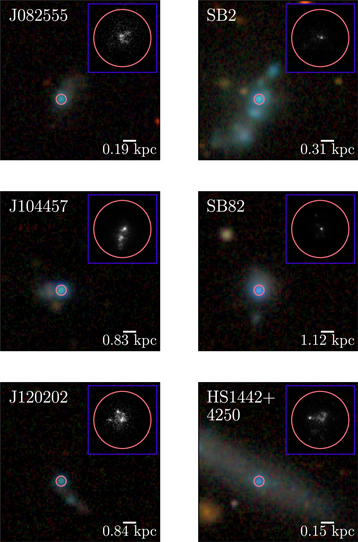
Figure 1. Optical g, r, i (RGB) SDSS images centered on our targets, with the 25 diameter HST/COS aperture indicated by a red circle centered on the target u-band centroid. An inset panel for each target displays one of the HST/COS NUV target acquisition images obtained for each, on a linear scale. A 3″ scalebar is also shown and labeled with the corresponding distance in comoving Mpc at the estimated distance of each target (Table 1).
Download figure:
Standard image High-resolution imageWe plot the new very high-S/N G160M C iv profiles obtained for all six target systems in Figure 2. All show very clearly detected emission in both components of the doublet. We directly integrate this emission for each component separately after first fitting and subtracting off any visible absorption components of MW and systemic C iv, yielding equivalent width measurements ranging from 0.8 to 10.6 Å (Table 4). In addition to finding stronger emission than previously reported for J082555 and J120202 (S19; B19), we detect clear evidence for non-Gaussianity in the narrow profiles of C iv in all six targets. To illustrate this, an inset panel for each spectrum is included in Figure 2 displaying the velocity profile of both C iv components and O iii] λ1666 for comparison (with redshift determined jointly from the O iii] and He ii lines in the same spectra). In all cases, the C iv profiles show structure not evident in the O iii] emission, with peaks of emission uniformly redder than the theoretically expected wavelengths.
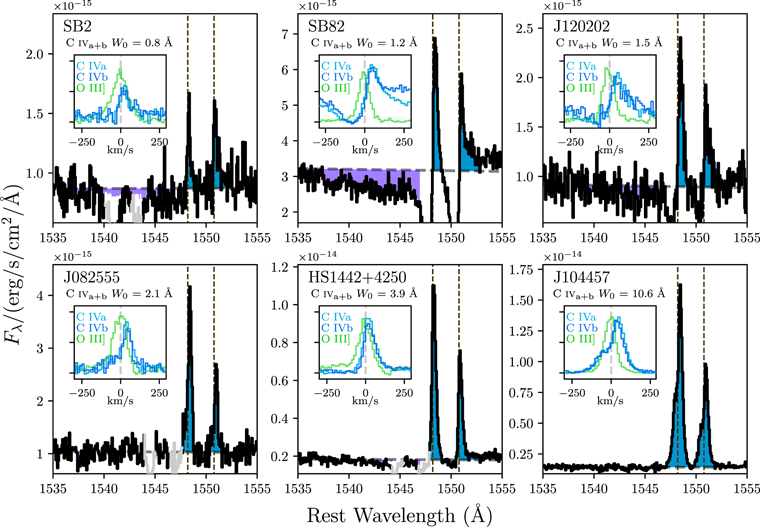
Figure 2. The new ultra-deep spectra presented in this paper provide a clear view of the C iv λ λ1548, 1550 complex, here ordered by the total equivalent width of nebular emission in this doublet (as indicated) and plotted after binning to 2 resels. The rest wavelengths of the two transitions are indicated by vertical dashed lines, and the redshift has been determined using joint fits to the O iii] λ λ1661, 1666 doublet, and He ii λ1640 line in the same spectrum. Stellar P-Cygni absorption is clearly detected in several of the targets and indicated by purple shading, while the nebular emission is highlighted in blue; the spectrum is shaded light gray at wavelengths impacted by intervening MW C iv absorption. Inset panels show a comparison between the profiles of the two narrow C iv components and O iii] λ1666 in velocity space. All six emit strongly (at 1–11 Å combined equivalent width) in this resonant doublet, indicative of a significant quantity of hot and highly ionized gas. However, a sequence is apparent from purely redshifted emission and blueshifted absorption in the lowest equivalent width emission profiles to broad and sometimes double-peaked emission in the most prominent emitters, likely a signature of resonant scattering.
Download figure:
Standard image High-resolution imageIntriguingly, this velocity structure in the narrow C iv profiles appears to correlate with the measured strength of emission in this doublet. The weakest nebular C iv emitters in the sample (<2 Å, top row of Figure 2) all show strongly redshifted emission, with either negligible emission or strong absorption blueward of zero velocity (P-Cygni features on the scale of 100–250 km s−1). In contrast, the three strongest emitters (bottom row) show no strong blue-side absorption and include two cases of double-peaked emission profiles (J082555 and J104457; the latter already noted and discussed extensively by Berg et al. 2019a). The detection of such a sequence, evocative of that followed by Lyα (Verhamme et al. 2006), strongly suggests that the C iv in these local systems is subject to resonant scattering in its escape from these galaxies (as argued by Berg et al. 2019a). We discuss the consequences of this point in more detail in Section 6.1.
The C iv profiles shown in Figure 2 also illustrate the power of these spectra to unveil features encoded directly in the stellar continuum. Strong stellar P-Cygni absorption is detected in SB 82 at −2.4 Å equivalent width in depth and in SB 2 and HS 1442+4250 with equivalent widths of −0.5 Å (Table 4; integrated from 1530 to 1550 Å after subtracting Gaussian fits to the ISM/MW and nebular lines and with linear continuum determined in the windows [1490, 1520] and [1560, 1590] Å). The other three systems with lower gas-phase metallicities are not formally detected via this full absorption trough integration at their achieved S/N (Table 4), but hints of broad stellar absorption at <1 Å EW in depth are still visible in their spectra (see also Figure 11). This high-velocity P-Cygni feature is produced by outflowing gas in the expanding atmospheres of the massive O stars powering the UV continuum in these galaxies. At the low metallicities of these systems, these metal line-driven stellar winds and their spectral signatures are usually far too weak to be detected in typical UV spectra. These spectra thus place some of the strongest and only constraints to date on the winds of massive stars below the metallicity of the Magellanic Clouds where individual stars can be studied en masse.
In addition to information about uncertain winds, the stellar continuum in these deep UV spectra also provides a rarefied view of photospheric absorption in the underlying OB stars, which yields direct leverage on the stellar metallicity. As a first attempt at quantifying this absorption, we measure and report the strength of several relatively broad indices probing stellar features that are commonly measured especially in low-S/N and low-resolution spectra of star-forming galaxies. In particular, we measure the Bl1425 and Fe1453 indices defined by (Fanelli et al. 1992, see also Vidal-García et al. 2017) which are dominated by many stellar photospheric lines of Fe v and in the former case, also Fe iv, C ii λ1429, and Si iii λ1417. In a similar pattern to the C iv P-Cygni strengths, we find strong absorption detections of 0.5–0.8 Å EW in depth in SB 82 and HS 1442+4250, weaker absorption in SB 2 of 0.2–0.4 Å, and a range of absorption largely ≲0.2 Å in magnitude and often undetected in these broad indices in the remaining three spectra of the lowest-O/H systems (Table 4).
These initial empirical measurements of the stellar continuum already show clear evidence for a range of stellar absorption strengths, potentially indicative of a significant spread in metallicities. At first impression, this trend appears broadly in line with the metallicity trend found in the gas-phase oxygen abundances. However, quantitative comparison of the new deep UV spectra to stellar models is necessary to extract robust constraints for comparison. At the high S/N and dispersion achieved in our spectra, our analysis can take advantage of a more detailed continuum comparison than usually possible, which is especially important in the low-metallicity regime where the very broad stellar indices just presented show relatively low dynamic range with variations in metallicity (e.g., Vidal-García et al. 2017). Section 4 is devoted to describing the model comparison methodology adopted in this work.
4. Ultraviolet Continuum Fitting
The ultraviolet continuum of star-forming galaxies is dominated by light that has been imprinted on by the photospheres and expanding atmospheres of massive OB stars. The resulting pattern of emission and absorption from various atomic species provides direct insight into the fundamental properties of the composite stellar population responsible for this light, including crucially the stellar iron content—both directly via the strength of photospheric absorption lines of ionized iron, and indirectly through the strength of wind features produced by the iron line-driven winds. In order to extract constraints on this metallicity and other stellar population properties, it is necessary to compare these patterns to composites of model stellar atmospheres. In this section, we describe our approach to this model comparison first by describing the stellar population model framework we utilize, followed by our description of the fitting procedure we follow to constrain the parameters describing this composite population.
4.1. Stellar Population Synthesis Models
First we must choose a set of stellar population synthesis models to which our deep UV continuum constraints can be compared. We choose to focus on the updated Bruzual & Charlot (2003) models (C&B), which have been iteratively improved since described by Gutkin et al. (2016). We refer the reader to Plat et al. (2019) for a more thorough description of the current state of these models, choosing here to highlight the details most pertinent to our continuum fitting analysis. While we focus on C&B, we also repeat our analysis with minor modifications for Starburst99 (hereafter S99; Leitherer et al. 2014) as well; these fits and results are described in Appendix B.
4.1.1. Stars
These evolutionary tracks followed by massive stars and the atmosphere models assigned to them on this journey are the most crucial ingredients shaping the emergent stellar features. The C&B models are underpinned by evolutionary tracks from the PAdova and TRieste Stellar Evolution Code (parsec; Bressan et al. 2012; Chen et al. 2015) which are used to predict the evolution of stars up to initial masses of 600 M⊙ from Z = 0.0001 up to 0.040 (corresponding to Z/Z⊙ = 0.0066–2.6). These models include modern treatments of mass loss and the Wolf–Rayet (WR) phase appropriate for such massive stars (Vink et al. 2011; Chen et al. 2015), extending to much lower metallicities than have previously been employed in such calculations. As described in (Plat et al. 2019, their Appendix A), these predictions have accordingly been coupled with updated high-resolution fully theoretical WR atmosphere models from the Potsdam WR group (PoWR; e.g., Todt et al. 2015, and references therein). This library provides line-blanketed, non-LTE, spherically expanding atmosphere predictions extensible to WNE, WNL, WC, and WO spectral types down to sub-SMC metallicities. It is important to note that these models generate WR and similar stars only through wind-driven mass loss, neglecting their expected production through binary mass transfer (e.g., Eldridge & Stanway 2009; Götberg et al. 2018, see also the discussion in Senchyna et al. 2021).
Next these stellar tracks and atmospheres are used to construct composite SSP spectral models. The C&B models are provided on a uniform moderate-resolution wavelength grid of 0.5 Å steps over the FUV and at 135 ages from 104 to 108 years, which we retain for comparison to the observed spectra. We adopt a Chabrier (2003) IMF and an upper-mass cutoff of 600 M⊙. This choice in maximum initial mass reflects the possibility that especially at very low metallicity where gas cooling is inefficient and wind-driven mass loss minimal, binary mass transfer and mergers may produce stars with masses well in excess of canonical limits (e.g., Schneider et al. 2014; Vink 2018). Conducting our analysis with both the Mup = 300 and 600 models suggests that for the current treatment in the C&B models, differences in the photospheric lines and related metallicities are not significantly impacted by this decision.
Finally, an assumption about the star formation history must be made to produce a composite spectrum. We consider both a constant star formation history (CSFH) starting at variable time t and combinations of single-age stellar populations (SSPs) to represent the young stellar populations underlying the FUV continuum. These star formation histories represent two extremes of approximation for the young stellar populations present in these galaxies. Comparing the results of both allows us to examine the spectral impact of different mixtures of young stellar populations resulting from potentially bursty recent star formation. While older generations of stars are likely present in these galaxies and unaccounted for in these young star formation histories, since they will not contribute significantly to the UV, we do not consider more temporally extended parameterizations that would include them. We explore the results of both choices in more detail below, but consider the CSFH results as our fiducial products.
4.1.2. Nebular Emission
At the young ages of these star-forming complexes, the contribution of the nebular continuum to the FUV is non-negligible, reaching up to ∼50% of the total continuum at 1450 Å at the lowest metallicities Z ≲ 0.001 and youngest ages ≲2 Myr. This additional radiation dilutes the stellar continuum and must be taken into account when analyzing the strength of stellar absorption features in such observed spectra. In the range of the considered FUV wavelengths, the nebular continuum emission is dominated by two-photon decay from the first excited state of hydrogen along the forbidden 2s → 1s pathway, with a much smaller contribution from free-bound recombination to the first excited state (Draine 2011). To account for this addition to the UV light, we utilize the nebular continuum predictions of the cloudy models (Ferland et al. 2017) computed self-consistently alongside the C&B stellar models. We use the standard ionization-bounded predictions and gas-phase abundances described by Gutkin et al. (2016) and Plat et al. (2019). We fix the gas density nH to 102 cm−3 (close to the median of 190 cm−3 we find from the optical S ii doublet in metallicity calculation), the dust-to-metal mass ratio ξd to 0.3 (which is close to the solar value: Gutkin et al. 2016), and the volume-averaged ionization parameter  to −2.5. This cloudy calculation also includes dust attenuation from the dust internal to the H ii regions computed in a physically consistent way which we apply to the stellar continuum. We effectively assume throughout that the stellar and nebular continua are both subject to the same dust column (i.e., we assume no differential reddening of the stellar continuum). This is likely appropriate for the very young stellar populations considered herein, which are unlikely to have dispersed significantly and are predominantly cospatial with the nebular emission they have excited (e.g., Charlot & Longhetti 2001; Senchyna et al. 2021).
For the purposes of this analysis, these nebular parameters are fixed to the above values and the nebular continuum with no emission lines is simply added to the stellar continuum for each SSP spectrum. We refer the reader to Appendix C.2 for an exploration of the effect of varying these nebular parameters on our results.
4.2. Spectra Comparison and Fitting
With stellar models assembled, we proceed to comparison with the observed FUV spectra. In this paper we are primarily interested in leveraging the information encoded in the forest of FUV photospheric absorption lines, which directly access ionized species including iron in the atmospheres of the massive stars present. We accomplish this through direct comparison of the measured spectra to the models, taking full advantage of the resolution and wavelength coverage of the ultra-deep spectra. To minimize the confounding effects of extinction (potentially a source of significant systematic uncertainty in the FUV even at the modest E(B − V) values of our sample; Table 1), we perform all of this model comparison in continuum-normalized space. In this subsection we describe the processing both the observed and model spectra undergo, and the Bayesian model comparison we then perform to extract constraints on the key model parameters of interest. We present and discuss the results of this fitting in the following sections.
First, we must ensure that the data and model comparison only include features that we wish to compare. Most crucially, the data are impacted by nebular line emission (Section 3.2), as well as narrow gas absorption lines both from surrounding or outflowing gas at the galaxy systemic redshift as well as from the MW halo (notably strong lines of Al ii, C ii, C iv, Si ii, Si iv, and Fe ii) which must be excluded if we are to compare the stellar continuum cleanly. We conservatively mask ±1.5 Å around the expected wavelength of each of these transitions, with wavelengths taken from the NIST Atomic Spectra Database 14 and the literature where appropriate, which we find is well beyond their typical measured width and is sufficient to remove them from consideration. We also mask the 1–2.5 Å closest to the FUV chip edges, which tend to be noisier and suffer from some residual calibration artifacts.
Our primary focus is on the photospheric lines, but the deep constraints on the winds lines provide important information about the massive stars present as well. In model comparison we choose to always mask the stellar wind lines O v λ1371 and Si iv λ λ1393, 1402; O v has generally poor morphological agreement between the data and models, and Si iv is strongly impacted by difficult-to-clean interstellar absorption. We generally also mask generously around the C iv λ λ1548, 1550 and He ii λ1640 wind lines as well, but the wings of the C iv and He ii wind profiles beyond the central regions impacted by nebular emission are in contrast straightforward to compare (and we include the uncontaminated portions of the C iv profile in some fits as described below).
Next, both the observed and model spectra must be continuum normalized in a self-consistent way. In both cases, we fit a cubic spline to the wavelength region from 1310–1710 Å (encompassing the rest-wavelength span of all of the G160M/1533 spectra presented here) after masking the strong wind lines (and other gas lines in the case of the observed spectra), with intermediate knots placed at in the relatively clean continuum at rest frame 1450 and 1590 Å. This common procedure ensures that data comparison occurs in a common normalized flux frame, but we also include a nuisance parameter in our fitting to account for a potential residual constant offset.
The actual model comparison proceeds as follows. First, the normalized model spectrum is assembled from the specified stellar metallicity and age (or other star formation history parameters). We linearly interpolate the flux in continuum-normalized space between the gridpoints so that the predicted flux is continuous in Z and t. Then, the raw continuum-normalized spectral data is corrected to the rest frame by redshift zadopt = fz z, where z is the systemic redshift estimated from the UV nebular emission lines in the same spectrum (Table 1) and fz is a free model parameter accounting for potential uncertainties in this correction. To account for the different spectral resolutions of the data and model spectra, the data are then smoothed by a Gaussian filter whose size σs in COS spectral pixels is allowed to vary as another free parameter. We then median-bin the data onto the model wavelength grid over the region of interest, with masked regions ignored. The uncertainties on the binned data are computed in the usual way, but with variance adjusted by a fractional amount fvar:

This variable fvar thus accounts for the possibility that our (already revised downwards; see Appendix A) COS spectral uncertainties might underestimate the real error. Our Bayesian likelihood function  assuming uncorrelated Gaussian uncertainties is then given as (modulo a constant)
where δ y is the freely varying constant adjustment to the model continuum normalization, and all fluxes F and uncertainties thereon σF are continuum-normalized quantities.
In total, we now have a model for our continuum-normalized spectrum consisting of ≥6 parameters Θ:
- 1.First, the ≥1 parameters describing the star formation history. This is simply the effective stellar population age
 in the case of a CSFH or SSP alone. We either allow this quantity to vary over a uniform prior spanning the model age grid, or (as discussed below) assume a narrow Gaussian prior (σ = 0.1 dex.) fixed to the values derived for each object from the optical by beagle (Table 2).
 - 2.We also consider combinations of this base SFH with an additional SSP. This adds two parameters: the age of this second SSP and its fractional contribution to the continuum at 1450 Å f+SSP.
- 3.The stellar metallicity,. We always allow to vary over a uniform prior from the minimum metallicity of the grid up to 0.5Z⊙, well above the metallicities preferred by these spectra.
- 4.The multiplicative adjustment to the measured redshift fz , which we allow to vary by ±3%.
- 5.The linear offset in the model normalization δ y, which we allow to vary over (−0.1, 0.1).
- 6.The Gaussian smoothing kernel size σs . For the C&B models, we allow this to vary from 30 to 70 pixels, corresponding to 0.4–0.8 Å.


As usual, we are now interested in estimating the posterior distribution  the likelihood as a function of these model parameters given this model M and our data
D
.
the likelihood as a function of these model parameters given this model M and our data
D
.
To explore this parameter space and obtain constraints on the parameters of interest, we utilize dynesty (Speagle 2020). This code implements both static and dynamic nested sampling (Skilling 2004, 2006; Higson et al. 2019), which is a method for estimating simultaneously both the evidence P( D ∣M) and the posterior by integration in shells of constant likelihood. Though this method has more stringent requirements for prior specification than for instance Markov Chain Monte Carlo, this also forces it to fully explore the specified prior volume, making it far less likely to miss regions of high likelihood. We use the static nested sampler, adopting the default configuration of uniform sampling with multiellipsoidal decomposition bounding (Feroz et al. 2009). We extract confidence intervals on the key parameters of interest from the weighted sample distributions and draw samples from the posterior using the helper functions built into dynesty for precisely these functions (see also Hol et al. 2006).
For illustration, we highlight the resulting posterior distribution in a corner plot presented in Figure 3 for J104457, whose FUV continuum SNR is typical for our sample. In general, the fit agreement to the photospheric continuum alone with wind lines masked is reasonable, with reduced χ2 of order unity and excellent morphological agreement with the highest-S/N spectra (Figure 4). Our photospheric fits with the C&B models uniformly support very small values for the multiplicative uncertainty factor fvar < 0.01, supporting the notion that our revised spectral uncertainties are not significantly underestimated. We discuss the fit results and their implied constraints on the stellar population properties of interest in the following section.
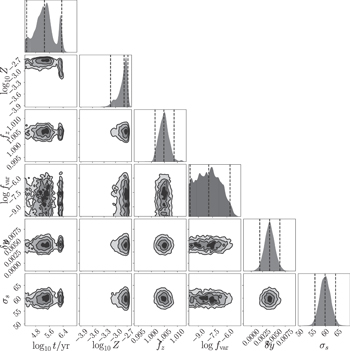
Figure 3. Corner plot for the dynesty fit to the full UV spectrum of J104457 (continuum S/N typical for our sample), with all wind features but C iv masked and assuming a variable-age CSFH and flat priors. All of the parameters including the “nuisance” quantities are reasonably well constrained, and in particular we find a single-peaked posterior distribution for the metallicity Z with minimal covariance.
Download figure:
Standard image High-resolution image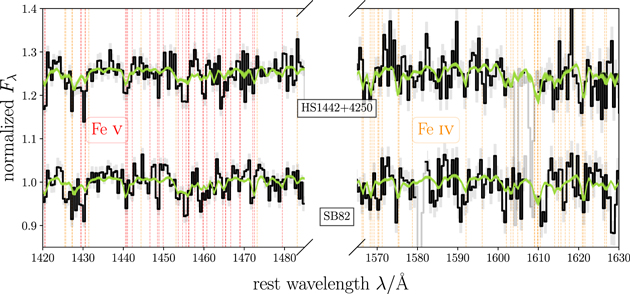
Figure 4. Zoom-in on stellar continuum fits at the photospheric complex near 1450 Å for the two highest-S/N spectra in our sample: SB 82 and HS 1442+4250. The observed continuum-normalized data binned to model resolution is overlaid by C&B model spectra drawn from the posterior found by dynesty, for the full cleaned G160M spectrum without stellar wind lines included. Many blended iron absorption features are detected at model resolution and well reproduced by the C&B model spectra.
Download figure:
Standard image High-resolution image5. Results
The UV continuum fitting described in the previous section yields Bayesian constraints on the basic properties of the massive star populations in the context of the assumed stellar models. We now examine these fitting results (with important derived quantities compiled in Table 5) and consider them in the context of the other measurements of these systems.
Table 5. Stellar Metallicities Inferred from Fits to the FUV Continuum
| Target | Photospheric | CSFH, no age prior | 2 SSPs |
 with stellar C iv with stellar C iv
| |||||
|---|---|---|---|---|---|---|---|---|---|
| Name |
 (fiducial) (fiducial) |

|

|

|

|

|

| CSFH | 2 SSPs |
| J082555 |

|

|

|

|

|

|

|

|

|
| SB2 |

|

|

|

|

|

|

|

|

|
| J104457 |

|

|

|

|

|

|

|

|

|
| SB82 |

|

|

|

|

|

|

|

|

|
| J120202 |

|

|

|

|

|

|

|

|

|
| HS1442+4250 |

|

|

|

|

|

|

|

|

|
Note. The fiducial stellar metallicity used in this paper is presented first, inferred from fits to the photospheric line-dominated normalized UV stellar continuum assuming a CSFH with age prior set by SED fitting. We also include stellar metallicities and ages inferred from fits with a flat prior to the same masked and normalized UV continuum assuming both a CSFH and a pair of SSPs with variable age below or above 5 Myr. Finally, we include metallicities derived given these two SFH assumptions when the broad stellar wind components of the C iv profile are fit directly alongside the photospheric lines.
Download table as: ASCIITypeset image
5.1. Metallicities from the Photospheric Continuum
5.1.1. Reproducing the Photospheric Lines
First, we examine how well the model spectra reproduce the forest of iron photospheric lines that provide direct leverage on the metallicity of the massive stars. In Figure 4 we compare model spectra drawn from the posterior distribution of the C&B fits against the observed binned spectra for the two highest-S/N spectra in our sample, SB 82 and HS 1442+4250, focusing on the regions 1420–1480 and 1570–1630 Å (the C&B and S99 fits for the other galaxies are included in Figure 10). These two regions of the spectrum of hot OB stars are expected to be dominated by a forest of Fe v and Fe iv lines (respectively), with minimal contamination from lines impacted by ISM absorption or stellar winds. By focusing on lines with minimal wind impact, we bypass much of the significant additional modeling uncertainties inherent to reproducing the structure of and radiative transfer through the expanding outer atmosphere of a wide variety of hot stars whose wide-ranging spectra must then be combined in the correct proportion (see Section 5.3). We indicate the expected vacuum wavelengths of the transitions predicted to be most prominent in hot stellar atmospheres for each of these iron species as reported by the Vienna Atomic Line Database (VALD3; Kurucz 2006; Ryabchikova et al. 2015, and references therein).
The comparison in Figure 4 reveals remarkably good agreement between the model and observed spectra in this region within the data uncertainties. In this wavelength range, a majority of the fluctuations in the observed binned continuum are due to real photospheric metal line absorption, detected cleanly at the resolution of the C&B SPS models. The fidelity with which the C&B model spectra are able to match most of the “wiggles” evident in the observed binned continuum in these systems attests both to the reality of these features in the data and to the precision of these model spectra. The lower-S/N spectra of the other targets (most notably J082555 and J120202) unsurprisingly reveal less striking agreement with the models (Figure 10). However, this is appropriately reflected in correspondingly large uncertainties in the derived metallicities.
We note that the wavelength region spanned by our spectra also provide access to several other strong photospheric lines of non-iron peak species. Most prominent and least likely to be contaminated by ISM absorption among these in our systems are O iv λ λ1338, 1343, O v λ1371, and S v λ1502. We highlight the oxygen line complexes in comparison to a prominent blend of iron transitions for our two highest-S/N spectra in Figure 5 (the constraints on these lines for the other targets and the S99 fits are visible in Figures 10 and 12). Our fits are driven primarily by the far more numerous lines of iron in the continuum, and the model spectra (both C&B and S99) that best match this iron line forest appear to systematically underestimate the strength of these lines of oxygen and other excited α-elements. This comparison is complicated by the fact that stellar winds can contaminate several of these transitions especially O v λ1371 whose strong model mismatch we discuss further in Section 5.3, though we note that only a small velocity asymmetry as would be expected from a wind contribution is detected in O iv λ λ1338, 1343. Modulo the uncertain wind contribution, this systematic inability to match the strength of these photospheric lines of α elements is qualitatively consistent with an overabundance of these elements with respect to iron in the observed galaxies relative to the solar chemistry assumed by the models employed here. We discuss the consequences of this possibility further in Section 6.2.
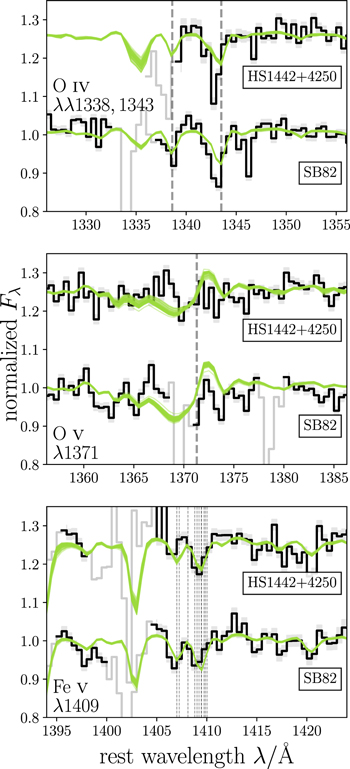
Figure 5. Zoom-in on C&B stellar continuum fits at several key lines of oxygen for the two highest-S/N spectra (HS 1442+4250 and SB 82): O iv λ λ1338, 1343, O v λ1371, and for comparison the strong blend of iron transitions near 1409 Å. The models that are predominantly constrained to match the numerous lines of Fe in the continuum appear to systematically underestimate the strength of O iv in these systems, qualitatively consistent with an overabundance of these elements relative to a solar chemistry. The stellar wind-dominated model profile of O v is strongly inconsistent with the data, indicative of deficiencies in the treatment of massive star winds in the underlying model atmospheres (Section 5.3).
Download figure:
Standard image High-resolution image5.1.2. Stellar Metallicity Constraints
The photospheric continuum fits provide Bayesian constraints on the stellar metallicity of these systems driven by the iron line forest. We present these constraints (medians and 68% confidence intervals) in Table 5 for several different sets of model assumptions. Here, we focus on the metallicity posterior derived assuming a constant star formation history with a Gaussian prior on age set by the ugriz SED fits to each system (Table 2, with Gaussian σ of 0.05 dex). We adopt this measurement as our fiducial metallicity for several reasons: it involves a minimal number of free parameters for the star formation history, and recovery of low metallicities near the edge of our metallicity prior is broadly successful even at S/N well below that reached by our sample with such an age prior (Appendix C.1). We note that minimal changes in the derived metallicity are observed when a conservative flat prior is adopted in age instead beyond a broadening of the posterior constraints, with the largest shift being a ∼ 1.9σ increase in Z for J104457 (Table 5). We discuss the other star formation history results in Section 5.3 and Appendix B.2, and the comparison with S99 in Appendix B.
The metallicities derived from the UV photospheric line fits are uniformly low. The UV spectra of these systems prefer metallicities below 10% solar ( ), with all but SB 2 confidently below this metallicity at > 1σ. This confirms that these systems are almost uniformly host to extremely metal-poor massive stars, despite the fact that two have Te
-derived oxygen abundances greater than the commonly adopted 10% solar cutoff at 12 + logO/H = 7.7 (Table 1). However, the results for our sample as a whole are also confidently not in the realm of nearly metal-free stars. All six have at least some photospheric metal line detection evident (Figure 10), and only the two lowest-metallicity and lowest-S/N spectra (J082555 and J120202) have posterior distributions approaching the bottom of our model metallicity range (and thus prior) at
), with all but SB 2 confidently below this metallicity at > 1σ. This confirms that these systems are almost uniformly host to extremely metal-poor massive stars, despite the fact that two have Te
-derived oxygen abundances greater than the commonly adopted 10% solar cutoff at 12 + logO/H = 7.7 (Table 1). However, the results for our sample as a whole are also confidently not in the realm of nearly metal-free stars. All six have at least some photospheric metal line detection evident (Figure 10), and only the two lowest-metallicity and lowest-S/N spectra (J082555 and J120202) have posterior distributions approaching the bottom of our model metallicity range (and thus prior) at  . The relatively confidently measured metallicities for the remaining four objects range from −3.2 to −2.9 in
  , corresponding to 4%–8% solar.
The highest photospheric metallicities we infer in our sample occur in SB 2 ( ), HS 1442+4250 (
 ), and SB 82 (
 ). These systems reveal the clearest detections of photospheric absorption lines (Figures 4, 10), with inferred model “wiggles” notably more prominent than those in the three other systems. These systems also reveal the three highest abundances of gas-phase O/H, with the other three lower-O/H galaxies all constrained to confidently (at the 84% confidence level)
  (<6% solar). Further detailed comparison of these three lowest-metallicity systems is challenging due to both weak continuum features and low S/N in the spectra for J082555 and J120202. However, the apparent first-order correspondence between the gas and stellar abundances is less clear when the three higher-metallicity systems are examined more closely. In the gas phase, these three highest-Z systems vary in O/H by 0.27 dex, with HS 1442+4250 at 12 + logO/H = 7.66 ± 0.04 and SB 82 at 12 + logO/H = 7.93 ± 0.04. However, their stellar metallicities are far more tightly clustered over ∼0.1 dex, with HS 1442+4250 and SB 82 in particular highly inconsistent in gas-phase O/H but with fairly tightly overlapping stellar metallicity distributions. The similarity in their inferred stellar Z is consistent with the qualitatively similar strength of photospheric absorption in their spectra (Figure 4) and empirically measured absorption indices (Table 4).
This analysis of the UV continuum features in these galaxies has revealed a crucial point: sorting these galaxies by gas-phase O/H yields a different rank ordering and a different spread than implied by the stellar photospheric lines. This immediately has important consequences for any work with local dwarf star-forming galaxies where only gas-phase abundances are known, which we discuss further in Section 6.1. It also strongly suggests that another variable is at play in setting the gas-phase oxygen and stellar iron abundances.
5.2. The O/Fe Abundance Ratio
Direct comparison of the iron-driven stellar photospheric metallicities and gas-phase oxygen measurements should yield an estimate of their relative abundance, and thereby insight into the α/Fe ratio in the star-forming ISM of these galaxies. Similar analyses conducted at z ∼ 2–4 have led to a strengthening consensus that super-solar O/Fe ratios are commonplace in star-forming galaxies at those redshifts (e.g., Steidel et al. 2016; Strom et al. 2018; Topping et al. 2020a), but the degree to which this applies to present-day bursting dwarf galaxies remains unclear. We plot our two abundance measurements in Figure 6, which immediately makes clear the lack of direct proportionality between these quantities as discussed in Section 5.1 and thus the possibility of a varying O/Fe ratio. However, comparing these abundances requires converting the ionized O/H measurement in hand to an estimate of total O/H commensurate with the stellar metallicity constraint. Correspondingly, Figure 6 also includes arrows representing gas-phase corrections and lines corresponding to solar abundance patterns with varying dust which we discuss in turn in this subsection.
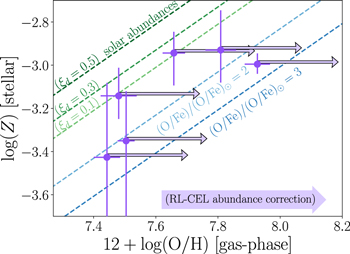
Figure 6. Comparing the gas-phase oxygen abundances derived from the direct-Te method and stellar metallicity constraints found from the ultraviolet photospheric continuum fits for the galaxies in our sample. We overplot green dashed lines corresponding to an assumed solar abundance scale with varying dust depletion factors ξd according to Gutkin et al. (2016), and two blue dashed lines indicating the enhancement expected from an O/Fe overabundance relative to solar of 2 and 3 times (with ξd = 0.3). We also highlight with arrows the shift introduced to the gas-phase abundances when accounting for an offset between the recombination line and collisionally excited line abundance scales (see Section 5.2). Even without any abundance scale shift, the measured stellar metallicities lie systematically below those expected given the gas-phase oxygen abundances under the assumption of solar abundances.
Download figure:
Standard image High-resolution imageFirst, in order to place our oxygen abundances confidently on an absolute scale, we consider the abundance discrepancy problem associated with ionized nebulae (e.g., Tsamis et al. 2003). The vast majority of integrated galaxy studies rely on gas-phase oxygen abundances derived from the strong collisionally excited lines (CELs) of [O ii] and [O iii], as derived for our systems with the direct-Te
method in Section 2.1. However, far weaker optical recombination lines (RLs) of oxygen detected in bright nearby H iiregions enable an alternative measurement of O/H, which is found to be systematically larger by a fairly constant factor of order 2 than that derived from the collisionally excited lines (e.g., Peimbert et al. 1993; García-Rojas & Esteban 2007; Esteban et al. 2014). The origin of this offset and the correct metallicity scale remains unclear (see Maiolino & Mannucci 2019, for more detailed discussion and references), especially at low metallicity where recombination line measurements are scarce to nonexistent (see e.g., Bresolin et al. 2016, for an argument for smaller corrections at low metallicity). To test this in metal-poor dwarf galaxies, we have obtained deep echelle spectra in a complementary program which yield oxygen RL detections for two of the targets in this sample: SB 2 and 82, from which we obtain preliminary RL metallicities of  and
and  , respectively (R. L. Sanders et al. 2022, in preparation). These measurements are 0.22 and 0.38 dex higher than the direct-Te
measurements we derived for these systems in Table 1, consistent with previous H iiregion samples presented above. Motivated by these local findings and for consistency with similar analyses of gas and stellar abundances at z ∼ 2 (e.g., Steidel et al. 2016; Sanders et al. 2020), we adopt the recombination line scale. For simplicity, since we do not have RL measurements for the full sample, we apply a constant + 0.24 dex offset (factor of 1.7) to the direct-Te
O/H abundances from Table 1 for each galaxy.
15
, respectively (R. L. Sanders et al. 2022, in preparation). These measurements are 0.22 and 0.38 dex higher than the direct-Te
measurements we derived for these systems in Table 1, consistent with previous H iiregion samples presented above. Motivated by these local findings and for consistency with similar analyses of gas and stellar abundances at z ∼ 2 (e.g., Steidel et al. 2016; Sanders et al. 2020), we adopt the recombination line scale. For simplicity, since we do not have RL measurements for the full sample, we apply a constant + 0.24 dex offset (factor of 1.7) to the direct-Te
O/H abundances from Table 1 for each galaxy.
15
Second, we must account for the fact that not all of the oxygen in the ISM is in the ionized gas phase. In particular, oxygen is depleted from the gas when it is locked into dust grains, depressing the O/H inferred from ionized oxygen relative to the total true ISM O/H. To account for this, we utilize the results of the detailed abundance analysis presented in Gutkin et al. (2016) which forms the basis of the C&B models. The scale of this depletion correction depends upon the assumed dust-to-metal mass ratio ξd (see solar abundance lines in Figure 6). We note that there is some empirical evidence for evolution in this ratio as a function of metallicity, with metal-poor nearby galaxies showing lower ξd on average but with substantial scatter (e.g., De Vis et al. 2019). For simplicity and with a lack of direct constraints on this quantity for these systems, we assume in this analysis a solar ξd = 0.3, which leads to a small correction upwards in O/H of ∼0.11 dex (corresponding to ∼30% depletion factor for oxygen). Assuming a lower ξd = 0.1 would lower this correction to ∼0.04, but we note that the adopted correction is close to that derived for similarly metal-poor galaxies from refractory depletion patterns (e.g., Peimbert & Peimbert 2010).
After these corrections, the resulting ISM O/H is readily converted to a total metallicity Z assuming solar abundances (Gutkin et al. 2016). Since as we have motivated our photospheric metallicity is driven by iron transitions, the stellar Z derived here corresponds to an estimate of Fe/H assuming the same abundance scale. We thus interpret the residual difference between this stellar Z and gas-phase oxygen-derived Z as an inference of ![$[{\rm{O}}/\mathrm{Fe}]\equiv \mathrm{log}\left({({\rm{O}}/\mathrm{Fe})/({\rm{O}}/\mathrm{Fe})}_{\odot }\right)$](https://content.cld.iop.org/journals/0004-637X/930/2/105/revision1/apjac5d38ieqn99.gif) . The corresponding measurements (accounting for the statistical uncertainties in our direct-Te
O/H measurement and the full posterior in stellar Z estimation) are presented in Table 6.
. The corresponding measurements (accounting for the statistical uncertainties in our direct-Te
O/H measurement and the full posterior in stellar Z estimation) are presented in Table 6.
Table 6. Inferred O/Fe from Comparison of the Stellar and Gas-phase Metallicities
| Target |

| Inferred |
|---|---|---|
| Name | (ξd = 0.3, RL corrected) | (O/Fe)/(O/Fe)⊙ |
| J082555 | −2.85 |

|
| SB2 | −2.48 |

|
| J104457 | −2.81 |

|
| SB82 | −2.36 |

|
| J120202 | −2.79 |

|
| HS1442+4250 | −2.63 |

|
| combined | ⋯ |

|
Note. We present the total metallicity Z corresponding to the gas-phase oxygen abundance measured using the direct-Te method (Section 2.1) derived assuming the Gutkin et al. (2016) solar abundances with ξd = 0.3 and further adjusted to account for the CEL–RL offset, and the (O/Fe) ratio relative to solar corresponding to the resulting offset from the photospheric-derived Z.
Download table as: ASCIITypeset image
Comparison of the stellar photospheric metallicities with the corrected gas-phase oxygen measurements provides strong evidence for systematically super-solar O/Fe ratios. This is immediately visible as a bias away from the solar abundance tracks in Figure 6, enhanced by the RL–CEL correction but present even in comparison with the direct-Te
metallicities. All six systems are inconsistent with solar O/Fe at at least the 1σ level (at over 5 for the well-constrained case of SB 82), with median ratios of 2–4 and a combined constraint over all six systems of  . While the empirically and theoretically motivated corrections just described both act to enhance this inferred ratio, they do not entirely explain it. Conservatively ignoring the larger 0.24 dex correction to the recombination line scale would still leave the combined sample at
  , inconsistent with solar at 1σ, and even ignoring both the RL and depletion corrections, SB 82 remains above solar at over 3σ. We examine these abundance constraints and their implications in Section 6.3.
5.3. Comparison to the Stellar Wind Lines
In addition to the photospheric transitions focused on in the previous section, the UV continuum region probed by our deep HST/COS spectra also contains several lines formed in stellar winds which are strongly constrained by our data (Section 3). In contrast to the photospheric iron lines, the wind lines are highly sensitive to a number of other uncertain assumptions made in the stellar population synthesis modeling. Most directly, the strength and morphology of the wind lines are dependent on the assumed mass-loss rates of luminous and metal-poor massive stars and the detailed modeling of momentum and radiative transfer in these stellar winds including often neglected factors such as wind clumping and shocks, all of which remains uncalibrated by resolved star observations at these low ≲10% solar metallicities (e.g., Bouret et al. 2003; Hillier et al. 2003; Bouret et al. 2015; Sundqvist et al. 2019; Puls et al. 2020). Our constraints on the stellar photospheric lines provide a unique opportunity to test state-of-the-art wind prescriptions in these models at unprecedentedly low stellar metallicities. If the atmospheres of the luminous hot stars in these galaxies are treated correctly, the posterior for our fits to the photospheric lines should span the observed wind line strengths. Issues in matching these lines in turn can be leveraged to provide insight into the massive stars in these galaxies and the assumptions made in their modeling.
As foreshadowed above, examining the O v λ1371 line provides a demonstrative illustration of the valuable information encoded in these features. This line is uniformly predicted by the models fit to the photospheric continuum to display a prominent P-Cygni morphology, yet it is in every case observed to instead display narrow absorption near line center with minimal emission or higher-velocity absorption (Figures 5, 12). One possibility for this discrepancy is that these galaxies are missing the very luminous and hot stars which dominate this feature in the models 16 , or that these stars are driving far weaker winds than predicted. But another modeling complication is likely at work in the case of this line: detailed atmospheric modeling of individual O-type stars has revealed that O v λ1371 is strongly affected by the inclusion of clumping in the modeling of stellar winds, with unclumped winds producing the strongest emission and high-velocity absorption (Bouret et al. 2003, 2005). A homogeneous wind structure is generally assumed in the models for high-mass stars employed in population synthesis codes, so this difference strongly suggests that the winds driven by the metal-poor stars in these galaxies are significantly clumped.
Comparison of our photospheric fits with the strongest wind lines in our spectral range, C iv and He ii, represents a crucial test for the stellar population models. The C iv λ λ1548, 1551 resonant doublet is observed in P-Cygni for normal OB star winds, while the He ii λ1640 recombination line is observed in broad emission in the dense winds driven by WR and other helium stars as well as very massive hydrogen-burning stars near the Eddington limit. We focus our analysis in this section on the two highest-S/N spectra in our sample: SB 82 and HS 1442+4250. In Figure 7 we plot their C iv and He ii profiles with nonstellar contamination masked; the wind comparison for the other spectra and for the bluer wind lines are included in Figures 11 and 12. First, consider HS 1442+4250, which has a very well detected C iv P-Cygni and broad He ii emission profile. The photospheric-only fit does remarkably well at reproducing the absorption trough of C iv and the broad He ii profile; the latter is a testament to the inclusion of new WR atmospheres in the latest C&B models (Senchyna et al. 2021). However, both the C&B and S99 models notably underestimate the broad redshifted stellar emission in C iv.
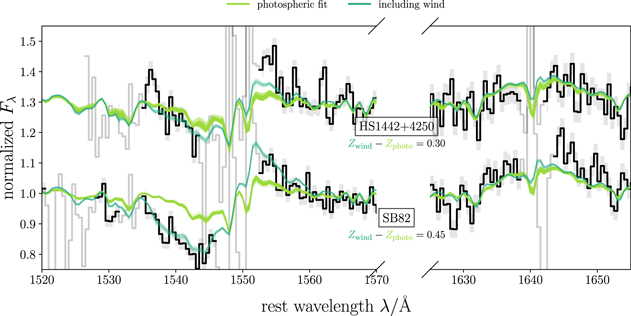
Figure 7. Same as Figure 4, but here highlighting the broad stellar wind features at C iv and He ii. While the stellar He ii profile is remarkably well reproduced in both cases, intriguingly the models for SB 82 and (to a lesser extent) HS 1442+4250 struggle to match the prominent stellar C iv profile at the metallicity preferred by the photospheric lines.
Download figure:
Standard image High-resolution imageThe highest-S/N spectrum for SB 82 provides an even greater challenge to the models. Despite a preferred photospheric metallicity similar to (and slightly below that) of SB 2 and HS 1442+4250, this system presents extremely prominent stellar C iv (with an absorption equivalent width of −2.4 Å) and strong He ii. While He ii is in reasonable agreement with the data, the fit to the photospheric continuum in this galaxy is in substantial tension with the C iv wind profile. Both the observed absorption trough and emission lobe are entirely missed by the model posterior constrained by the photospheric forest, which predicts a significantly weaker feature. This holds also for the S99 models, which prefer a similarly weak C iv profile when the photospheric continuum is fit in addition to missing He ii (Figure 11).
The C iv wind profile is in clear and significant tension with the photospheric continuum for SB 82 (and to a lesser extent HS 1442+4250), in the context of both the C&B and S99 models. Analyzed in isolation and at fixed population age, a stronger wind profile in an integrated galaxy spectrum would generally imply higher metallicities, as these winds are driven by metal line absorption (predominantly iron-peak elements) and the observed lines directly formed by ionic metal species. To explore this, we consider a second set of fits to the spectrum including the stellar C iv profile—the included wavelength range is indicated in Figure 7, and the resulting measurements are presented in Table 5. For both SB 82 and HS 1442+4250, better agreement with the C iv profile (Figure 7) is only found at substantially higher metallicity than implied by the photospheric fits; specifically, at +0.45 and +0.30 dex higher. This improvement in the wind line match comes at the cost of agreement with the photospheric lines; the reduced χ2 for the fit for SB 82 including the C iv profile is 69% larger than that for the photospheric-only fit, with the disagreement spread broadly throughout the continuum. The S/N and low metallicity of the other targets conspire to make a detailed analysis of their wind lines more challenging (Figure 11), but repeating this experiment and directly fitting the C iv wind profile results in a higher metallicity in four of the six cases, and overall a median change of +0.2 dex across the sample.
Another possible explanation for shifts in the strength of stellar wind lines is the effective age or recent star formation history of the galaxy. Since C iv and He ii are predominantly powered by hot and generally very luminous stars which power the most significant radiation-driven stellar winds while the UV continuum is produced by a broader range of OB stars, their strength in an integrated galaxy population is dependent on the mixture of these most luminous stars relative to their somewhat older brethren, and thereby on the precise shape of the recent star formation history. To explore whether this has a significant impact on the mismatch with C iv, we conduct an additional set of fits with a star formation history parameterized by two SSPs with independent age and relative UV contribution instead of the variable-age constant SFH (Section 4), to reflect a star formation mode composed of several entirely discrete cluster bursts rather than a more protracted recent star formation episode. The results are presented in Table 5 and Figure 13 and discussed in Appendix B.2. We find that while some improvement is made in matching the strong emission lobe of C iv in HS 1442+4250 (at the cost of good agreement with stellar He ii), adopting a bursty SFH has negligible impact on the strength of the C iv absorption trough in SB 82. As for the assumed CSFH, we find that matching the strength of the C iv P-Cygni profile in this system by explicitly fitting it with a 2-SSP model still requires invoking a metallicity significantly higher than that found for the photospheric lines (by 0.44 dex; Table 5). In short, uncertainties in the star formation history do not appear to resolve the difficulty we find in matching the stellar wind lines in these systems.
In summary, we find tension between the stellar photospheric and wind lines in these ultra-deep spectra. In particular, we find that C iv is notably underpredicted by the C&B and S99 models fit to the photospheric continuum alone. These differences are most prominent in SB 82 and HS 1442+4250, but we find a suggestion of a similar preference for higher stellar metallicities to match the strength of this wind line in several of the lower-S/N spectra as well. This is suggestive of tension in the stellar physics underlying these model predictions at these very low metallicities. We discuss this in more detail in Section 6.2.
6. Discussion
The massive star abundance constraints obtained here provide powerful and otherwise inaccessible insight into the star-forming regions under study, with implications for their constituent metal-poor massive stars and for their early universe counterparts. We divide our discussion of these results and their implications into three parts. First, we reevaluate the intense nebular emission observed in these systems and their relationship with high-redshift galaxies. Next, we discuss lessons learned regarding stellar modeling for metal-poor massive star populations. Finally, we consider their consequences for our understanding of abundances in high-redshift galaxy analogs.
6.1. Implications for Intense Nebular Emission both Locally and at High Redshift
Local star-forming dwarf galaxies have already played a crucial role in contextualizing the high-ionization C iii] emission detected at the tip of the reionization-era galaxy population (e.g., Rigby et al. 2015; Senchyna et al. 2017), but even with the recent discovery of a significant population of local star-forming C iv emitters (Section 1), several key questions about this higher-ionization triply ionized carbon emission remain unanswered. First, it remains unclear why local systems with otherwise very similar nebular properties display such a broad range of nebular C iv equivalent widths (e.g., Senchyna et al. 2019). And second, the highest equivalent width emission in this doublet yet detected locally 10–15 Å (Senchyna et al. 2019; Berg et al. 2019a; Schaerer et al. 2022) falls short of that encountered at z > 6 by a factor of 2–4. Without actual signatures of the massive stars underlying this emission or a clear view of the C iv profiles, attempts to answer these questions have thus far been restricted to correlations with gas-phase metallicities and other nebular properties which provide only a partial view of the underlying physics.
In this work we have targeted six of these local nebular C iv emitters with spectra deep enough to place strong constraints on stellar photospheric and wind signatures. These targets were selected primarily on this high-ionization emission, and span a significant range of inferred ages (2–20 Myr assuming a constant SFH; Table 2) gas-phase metallicities from 12 + logO/H = 7.5 (5% solar; J082555, J104457, J120202) up to the relatively oxygen-rich SB 82 at 7.93 (15% solar; Table 1). Surprisingly, even for SB 82 and 2 which lie above 10% solar in O/H (the traditional formal limit defining XMPs), the photospheric continuum features in all six targets prefer stellar metallicities Z (driven by Fe/H) below 10% solar ( ). That this sample of nebular C iv emitters with diverse nebular properties including SB 82 at nearly SMC metallicity in gas-phase O/H is uniformly populated by extremely metal-poor stars suggests that this emission indeed may require the hard ionizing radiation field these sub-10% stellar populations are capable of powering. This finding lends further support to the notion that nebular C iv may be a remarkably useful tracer of these extremely metal-poor stellar populations at high redshift where it is detected alongside other UV line ratios consistent with star formation and when [O iii] λ4363 will be intractable.
While this new dimension of stellar metallicity appears to help explain how SB 82 and 2 power nebular C iv at relatively high metallicity, it may not fully illuminate the scatter found in the strength of C iv among the other objects. In particular, consider the strongest nebular C iv emitter in our sample, J104457. This galaxy is clearly more metal poor in both stars (at  ) and gas (at 12 + logO/H = 7.5) than the next-strongest C iv emitter in our sample, HS 1442+4250 (
 , 12 + logO/H = 7.7). This is consistent with this picture in which a harder stellar ionizing radiation field (and potentially hotter gas temperature) serve to boost this emission at lower metallicities. However, the other two lowest-O/H galaxies in our sample J082555 and J120202 present nearly identical O/H and Hβ equivalent widths to J104457 (Table 1), yet power C iv at only 2.1 and 1.5 Å, 5 times smaller than J104457. If stellar metallicity were the only other variable at play, one might expect J082555 and J120202 to harbor more metal-rich stellar populations with correspondingly softer radiation fields. But while the broad constraints on their metallicity from the UV data do leave open the narrow possibility for slightly more metal-rich stars than J104457, both of these galaxies are likely at a similar
  (Table 5). Some other factor is likely at play to explain the wide range in C iv strengths between these three systems.
A clue as to another potentially crucial variable in determining the strength of nebular C iv resides directly in the high-resolution spectral profiles obtained for C iv itself. The profiles of both components of C iv in the three enigmatic lowest-O/H galaxies just discussed fall into the resonant scattering sequence described in Section 3.2 (Figure 2), from a small-scale absorbed P-Cygni profile in the weakest of the three (J120202) to pure broad and double-peaked emission in the strongest (J082555 and J104457). In other words, these profiles suggest that the emergent equivalent width of nebular C iv may be lower in J120202 and J082555 than in J104457 in part due to a significantly higher column density of outflowing triply ionized carbon along the line of sight into the former galaxies.
Our data support the idea that scattering plays a role in regulating nebular C iv, but the source of the responsible gas is not immediately clear. The column densities of C iv implied by such a scenario are difficult to produce in the H ii regions themselves or in a collapsed superwind (Berg et al. 2019a; Gray et al. 2019). However, substantial quantities of C iv-absorbing gas associated with z > 1 galaxies have long been noted in quasar absorption line spectra (e.g., Steidel 1990; Chen et al. 2001; Adelberger et al. 2005; Rudie et al. 2019) and HST/COS has revealed that this holds true for the circumgalactic medium (CGM) of a wide range of galaxies in the nearby universe as well (e.g., Chen et al. 2001; Borthakur et al. 2013; Bordoloi et al. 2014). In particular, the detection statistics of C iv absorption along quasar sightlines around low-z sub-L⋆ galaxies suggest a patchy distribution of C iv consistent with being virially bound, but with a particularly high covering fraction of absorption close to the star-forming subset (Bordoloi et al. 2014). This is suggestive of a picture similar to that encountered at high redshift, in which small-scale (∼100 pc) clumps of C iv gas sustained by the extragalactic UV background are present in the metal-enriched outflows or “fountains” powered by supernovae energy input in these star-forming galaxies (e.g., Rauch et al. 2001; Rudie et al. 2019). In this view, the strong blueshifted absorption in the C iv profiles of J120202 and SB 82 suggests that our line of sight to these star-forming regions is intercepted by a high column density C iv cloud in the target galaxy CGM, which suppresses the measured C iv flux. Conversely, the double-peaked emission profile in J104457 suggests relatively minimal C iv scattering, suggesting a comparatively clear line of sight in this case and potentially explaining in part its dramatically higher measured equivalent width of C iv. We illustrate this proposed situation schematically in Figure 8.
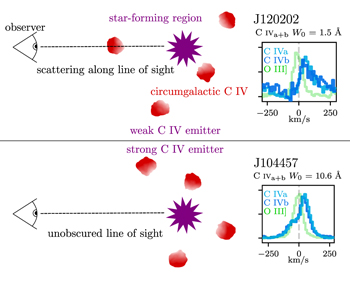
Figure 8. Schematic illustration of the C iv scattering picture we propose. Scattering in spatially compact (of order 100 pc) circumgalactic C iv “clouds” which in some cases intercept the line of sight to the target star-forming regions would naturally explain why some targets with otherwise very similar metallicities and inferred ages show a broad range of emergent nebular C iv equivalent widths. The C iv emission profile of the relatively weak emitter J120202 shows a P-Cygni profile with a strongly redshifted emission peak indicative of a high column density of interstitial C iv, whereas the prominent emission in J104457 is double peaked and suggestive of a relatively unobscured pathway out of the galaxy for C iv photons.
Download figure:
Standard image High-resolution imageA significant role for CGM scattering in C iv escape in these systems has important consequences for our comparison to high-redshift star-forming galaxies. One might expect that a CGM primarily enriched by stellar yields might be significantly lower metallicity in the early universe, and thus potentially less likely to reach high column densities in C iv. Blind absorption line system surveys conducted with very high-redshift quasars provide an opportunity to test this experimentally by constraining the incidence of C iv absorbers as a function of redshift. Interestingly, such surveys have revealed a dramatic decline in the incidence of C iv absorption systems above redshift z > 5, likely due to some combination of lower carbon abundances and a softer metagalactic ionizing background (e.g., Becker et al. 2009; Ryan-Weber et al. 2009; Cooper et al. 2019). The low rate of C iv absorption detection at these high redshifts suggests that the covering fraction of C iv in the CGM of high-redshift star-forming halos is substantially lower than in the local universe. If this holds, resonant scattering in the CGM is much less likely to significantly affect C iv emission powered by metal-poor stars in the highest redshift systems. This is qualitatively consistent with the high detection rate of very strong C iv in early reionization-era spectra, and would mean that C iv emission at these redshifts is likely to be an even more complete tracer of highly ionized gas around metal-poor massive stars than locally.
While variable optical depths to scattering plausibly explains some of the scatter in C iv strength among local systems and differences with the z > 6 universe, it does not resolve all of this tension. In particular, the narrowly double-peaked emission profile found for one of the strongest local emitters, J104457, indicates relatively minimal scattering; not enough to suggest an intrinsic unabsorbed equivalent width at the 20–40 Å encountered at z > 6. In other words, we have still not found any star-forming galaxies in the nearby universe with intrinsic C iv emission comparable to reionization-era detections—empirically, it remains unclear whether massive stars could power such prominent C iv.
However, our data strengthen the case that local UV samples simply do not yet reach the metallicities and ages where stars are able to power C iv most efficiently. The local record holder J104457 stands out as one of the most metal-poor galaxies in gas-phase O/H with UV coverage (Senchyna et al. 2019). However, our stellar continuum fits indicate that the stars in that system are not dramatically more metal poor than the gas. We infer an O/Fe ratio relative to solar of  (Table 6), whereas assembling systems at very high redshift might be expected to harbor significantly more alpha-enriched gas (near the pure Type II SNe limit of (O/Fe)/(O/Fe)⊙ ≃ 5; e.g., Nomoto et al. 2006) and correspondingly lower metallicity, hotter massive stars. The extremely young age of J104457 implied by its very high EW of 264 Å in Hβ is also noteworthy. While lower-O/H galaxies have been studied by HST/COS like I Zw 18 and SBS 0335-052E, the EWs of the optical nebular lines in the star-forming regions targeted are actually uniformly below 200 Å in Hβ and thus suggestive of less extremely young ages than in J104457 (Senchyna et al. 2019; Wofford et al. 2021). It is very possible that a combination of the hard ionizing radiation field from an extremely iron-poor < 5% solar and very young stellar population
17
combined with relatively high oxygen and carbon abundances
18
might lead to significantly stronger C iv equivalent widths than encountered in J104457. The lack of UV observations of extremely metal-poor dwarf galaxies dominated by recent star formation is largely a product of their typical faintness which has contributed also to their delayed discovery (e.g., Hsyu et al. 2018; Izotov et al. 2019; Senchyna & Stark 2019; Kojima et al. 2020), but measurement of nebular C iv and other high-ionization UV lines in exemplar systems in this regime would be of significant value in the interpretation of JWST spectra at the highest redshifts.
(Table 6), whereas assembling systems at very high redshift might be expected to harbor significantly more alpha-enriched gas (near the pure Type II SNe limit of (O/Fe)/(O/Fe)⊙ ≃ 5; e.g., Nomoto et al. 2006) and correspondingly lower metallicity, hotter massive stars. The extremely young age of J104457 implied by its very high EW of 264 Å in Hβ is also noteworthy. While lower-O/H galaxies have been studied by HST/COS like I Zw 18 and SBS 0335-052E, the EWs of the optical nebular lines in the star-forming regions targeted are actually uniformly below 200 Å in Hβ and thus suggestive of less extremely young ages than in J104457 (Senchyna et al. 2019; Wofford et al. 2021). It is very possible that a combination of the hard ionizing radiation field from an extremely iron-poor < 5% solar and very young stellar population
17
combined with relatively high oxygen and carbon abundances
18
might lead to significantly stronger C iv equivalent widths than encountered in J104457. The lack of UV observations of extremely metal-poor dwarf galaxies dominated by recent star formation is largely a product of their typical faintness which has contributed also to their delayed discovery (e.g., Hsyu et al. 2018; Izotov et al. 2019; Senchyna & Stark 2019; Kojima et al. 2020), but measurement of nebular C iv and other high-ionization UV lines in exemplar systems in this regime would be of significant value in the interpretation of JWST spectra at the highest redshifts.
Irrespective of the results of the search for the most prominent C iv in the local universe, extremely metal-poor galaxies nearby still provide our only opportunity to directly calibrate the ionizing spectra produced by low-metallicity stellar populations. These spectra will allow us to ask directly whether stellar population synthesis models are able to reproduce the high-ionization nebular emission lines including C iv at the age and (crucially, nonzero; e.g., Kehrig et al. 2018) metallicity inferred from the photospheric lines. We will reserve detailed modeling of the high-ionization nebular lines alongside the stellar continuum to a later paper, but note here that our results already provide several important lessons along these lines. First, we have argued that the CGM can significantly scatter resonant C iv emission; since this depresses the emergent flux in C iv captured in a spectroscopic aperture, the measured flux in nebular C iv must be interpreted as a lower limit on the intrinsic emission from the H ii region. While this may require more work to incorporate into photoionization modeling schema, these C iv lower limits still provide unique leverage on the ∼50 eV ionizing radiation field (e.g., Plat et al. 2019). In addition, our results suggest that conducting such an analysis with the stellar metallicity set to that implied by gas-phase O/H and solar abundances with no additional correction may lead to substantial errors (up to nearly an order of magnitude at maximal O/Fe) in the inferred stellar metallicity, 19 leaving any comparison to stellar models subject to systematic errors. Direct assessments of the stellar metallicity such as that conducted here bring this sort of analysis further beyond model testing and toward prescriptive calibration of the stellar ionizing spectrum as a function of fundamental stellar properties, a keystone for an era in which we hope to extract meaningful physical constraints from multiplexed high-redshift nebular spectra.
6.2. New Challenges to State-of-the-art Stellar Models
The interpretation of star-forming galaxy spectra in the era of the JWST and ELTs will increasingly depend on the accuracy of models for the evolution and atmospheres of massive stars at very low metallicity, and stellar winds remain a particularly crucial and uncertain component of these models. Stellar winds both directly modulate the hard ionizing spectrum so crucial to accurately interpreting nebular line emission, and via mass and angular momentum loss they shape the evolutionary channels that both isolated and interacting massive stars follow. In addition, the prominent resonant UV stellar wind lines themselves like C iv provide some of the most direct and accessible insight into the massive stars inhabiting distant faint galaxies, but any insight derived from these lines is only as valuable as their modeling is correct. Unfortunately, with only a handful of resolved OB stars accessible in the Local Group outside the Magellanic Clouds, and detections of weak stellar features exceedingly rare in unresolved metal-poor galaxies, testing models for these winds below 20% solar metallicity remains challenging.
The spectra presented in this paper provide some of the deepest constraints yet obtained on the UV continua of extremely metal-poor Z/Z⊙ ≲ 10% massive stars. Notably, these data provide access to both the integrated stellar wind signatures as well as the metallicity sensitive forest of iron photospheric absorption features, presenting a powerful challenge to stellar population synthesis models. The wind lines are subject to particularly uncertain physics adopted in the underlying models, especially the scaling of mass-loss rates with stellar metallicity and luminosity and the NLTE modeling of ionized gas in expanding atmospheres. If this physics is treated successfully, we should be able to find consistency with these wind line profiles when the photospheric continuum is fit alone.
But as explored in detail in Section 5.3, our experiment reveals signs of tension between the wind and photospheric line detections in our spectra. First, we find that the models preferred by the photospheric lines underestimate the strength of the C iv P-Cygni profile in the two highest-S/N spectra of our sample (SB 82 and HS 1442+4250). Direct fits to the wind lines require systematically higher stellar metallicities generally independent of the assumed star formation history, by up to 0.4 dex in the most extreme case of SB 82. While stellar He ii λ1640 is remarkably well matched to the data in most cases, the higher-ionization wind-sensitive line O v λ1371 is predicted by the models to display a strong P-Cygni signature which is not detected in our data. And finally, the models best matched to the iron forest also appear to underestimate the strength of several individual strong photospheric lines of α elements, particularly S v (Section 5.1).
This difficulty we have found in simultaneously matching the wind and photospheric lines is suggestive of discord in the modeling of the strong integrated stellar wind features in these young star-forming galaxies. In particular, our difficulty in matching the C iv P-Cygni profile echoes several other recent analyses where tension has been found between the UV stellar wind lines and other galaxy properties in extreme star-forming systems. First, Senchyna et al. (2021) found that the C&B models struggled to match the very strong stellar He ii wind line and to a lesser extent C iv when fit alongside the strong optical nebular lines in a sample of moderately metal-poor star-forming regions (near LMC metallicity, 12 + logO/H ≃ 8.2). In this case, the strongest wind profiles were only reproduced by invoking significantly higher stellar metallicities in clear tension with the gas-phase metallicity. In another recent study focused on the canonical extremely metal-deficient galaxy SBS 0335-052E (near the low end of the gas-phase metallicity range spanned by the targets in this work, at 12 + logO/H = 7.3–7.5 depending on method), Wofford et al. (2021) found that direct fits to the weak C iv P-Cygni profile detected in their deep-stacked G160M spectrum resulted in inferred metallicities substantially larger (by ∼0.5–0.7 dex) than inferred from the nebular gas lines. These results differ from our current analysis in several important ways, most crucially in their use of nebular gas lines as a metallicity reference rather than the stellar photospheric forest. However, they all concur that fits to the strong wind lines in young star-forming systems commonly result in metallicities systematically larger than those derived from other methods.
These findings have important implications for modeling metal-poor star-forming galaxies at all redshifts. By virtue of its prominence, the strong C iv P-Cygni feature is the most likely massive star signature to be directly detected in star-forming galaxies at high redshift. The resonant wind line complexes especially C iv have long been recognized as some of the most accessible UV abundance indicators for unresolved star-forming galaxies (e.g., Heckman et al. 1998; Keel et al. 2004; Crowther et al. 2006), and are likely to provide our most direct leverage on the metallicity of the massive stars in the brightest z > 6 galaxies with the JWST and ELTs (Matthee et al. 2022). However, our results and other recent results in the literature suggest that at present, direct fits with state-of-the-art models to these features especially in metal-poor and high-sSFR systems (as expected at high redshift) can yield metallicity estimates that are biased significantly (as much as ≳0.4 dex) toward higher values. Until the origin of this discrepancy is addressed, metallicity estimates driven by the UV wind lines should be treated with some caution.
While troubling from the perspective of galaxy abundance measurement, the tension we have found in modeling the wind lines may actually contain significant information about the metal-poor massive stars inhabiting these nearby galaxies. The discrepancy between the photospheric fit and the C iv profile especially evident in SB 82 is suggestive of a potential deficiency in the treatment of luminous stars driving strong winds in this system. This is less likely to be due to higher-order complexities in photospheric or wind modeling; the predominant effect of unaccounted for microturbulence would be to further depress the inferred photospheric metallicities (Appendix C), and the strength of the stellar C iv wind line is particularly robust to the inclusion of effects like clumping and X-ray emission from shocked gas in the wind which would naturally explain the difficulty we find in reproducing O v λ1371 (see Section 5.3; e.g., Bouret et al. 2005). Instead, either an underestimation of mass-loss rates for the very luminous stars in that galaxy or an overabundance of the most massive wind-driving stars relative to the IMF we have assumed (possibly produced by binary mass transfer; e.g., Senchyna et al. 2021) could potentially enhance the strength of C iv without substantially changing the effective equivalent width of the photospheric iron lines. Clues such as this revealed in the stellar features imprinted on integrated light spectra of star-forming regions may be one of our most direct opportunities to confront detailed massive star models in these particulars at very low metallicities.
However, another possibility that might also explain why SB 82 is much more discrepant with the models than the otherwise broadly similar SB 2 and HS 1442+4250 is that the highly α-enhanced abundances we have inferred for this system might significantly change the appearance of the massive stars in this system. While iron dominates the EUV opacities which control wind launching in the normal optically thin winds that P-Cygni C iv is produced in, an increase in the abundance of α elements by 0.6 dex can impact the strength of lines produced by α element species. The variation found in C/O abundance in addition to α/Fe further complicates this picture, but the UV O iii] and C iii] nebular lines in SB 82 suggest only a moderately low value of [C/O] = − 0.26 (typical for similar metal-poor dwarf galaxies; Senchyna et al. 2017) which combined with our inferred [O/Fe] = 0.64 results in a significant residual enhancement in carbon of 0.4 dex over the abundances assumed in the underlying stellar models. Intriguingly, Eldridge & Stanway (2012) performed an experiment varying the carbon abundance in WM-BASIC NLTE atmosphere models for O stars and found that the most dramatic changes to the emergent C iv P-Cygni profile with varied C/O occurred near a moderately low metallicity of Z = 0.004, quite close to the metallicity we infer for SB 82 from the fits incorporating the C iv profile.
Our results underscore both the power and the challenges inherent in studying the UV stellar continuum. While expensive to produce, a next-generation set of stellar population synthesis models with varied elemental abundance patterns in the massive star atmospheres themselves would allow us to disentangle the impact of these patterns on the emergent spectrum and strong wind lines. Developing such a grid would take us substantially closer to both confident interpretations of the most expensive rest-UV spectroscopy that the JWST will provide and robust constraints on the mass function and evolution of extremely metal-poor massive stars.
6.3. Abundances in Extreme Nearby Star-forming Galaxies and the Search for “Analogs”
One of the key questions facing those studying local star-forming galaxies as reference systems is how and to what degree these systems differ from their high-redshift counterparts. Abundance ratios and the α/Fe ratio in particular have been highlighted as a critical point of potential difference between star-forming systems in the early and present-day universe, with many authors emphasizing the idea that offsets between local and high-redshift galaxies might be explained by a near or complete lack of significantly α-enriched star-forming systems in the nearby universe (e.g., Steidel et al. 2016; Strom et al. 2017; Sanders et al. 2020; Topping et al. 2020b). But despite substantial interest, the α/Fe ratios and the corresponding shape of the long-term star formation histories of local unresolved metal-poor galaxies in general remain remarkably poorly constrained. Attempts to divine the long-term star formation history through direct detection of old stellar populations have proven extremely challenging even in the brightest and nearest metal-poor galaxies outside the Local Group (see for instance the long debate as to the age of I Zw 18: Searle & Sargent 1972; Hunter & Thronson 1995; Izotov & Thuan 2004; Annibali et al. 2013). The stellar metallicities necessary to constrain the relationship between massive star iron abundances and gas-phase oxygen require expensive space telescope UV observations or deep near-infrared data if red supergiants are present, and thus only a handful of quantitative measurements independent of the gas phase exist in unresolved local galaxies (e.g., Larsen et al. 2008; Lardo et al. 2015; Hernandez et al. 2017, 2019; Chisholm et al. 2019).
Our constraints on the photospheric iron in the massive stars inhabiting local C iv emitters provide our most direct view yet on the stellar abundances in extreme reionization-era analog galaxies. In Figure 9 we plot the [O/Fe] and Fe/H measurements for our systems alongside measurements for Galactic stars, Local Group dSph and dIrr stars, and the previous gas phase only estimates for blue compact dwarfs (see caption for references). Our galaxies are uniformly metal poor, all residing at [Fe/H] < − 1.0; old stars in the Local Group at these metallicities span from uniformly α-enhanced in the MW bulge and disk up to the Type II SNe limit at ∼5 times solar (e.g., Kobayashi et al. 2006; Nomoto et al. 2006) down to near-solar in some of the dwarf spheroidal galaxies (dSphs) with more protracted star formation histories. If our target dwarf galaxies had substantial stellar mass buildup at early times ≳1 Gyr ago and were strongly enriched by Type Ia SNe yields like these dSphs, we would expect to encounter similar near-solar values in our comparison of gas-phase oxygen and the iron in recently formed massive stars. However, instead we find evidence for uniform α-enhancement in the targeted C iv emitters, ranging from 2.1 to 4.4 times solar with a median of 3.1 and >1.5 solar at at least 1σ significance in all targets—physically consistent with slightly diluted Type II SNe yields and well within the broad locus of values measured in the dSphs and MW.
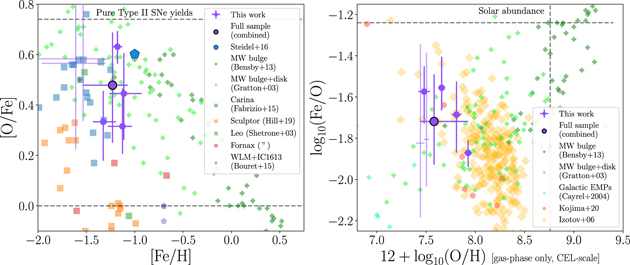
Figure 9. Iron abundances derived from the stellar photospheric lines in our ultra-deep HST/COS UV spectra and oxygen abundances from the nebular O,H lines in the optical, in the context of other complementary abundance samples in the local universe. In particular, we plot MW bulge and disk stars (Bensby et al. 2013; Gratton et al. 2003; Cayrel et al. 2004); Local Group dSph stars from Carina (Fabrizio et al. 2015), Sculptor (Hill et al. 2019), Leo, and Fornax (Shetrone et al. 2003); O stars in the dIrrs WLM and IC 1613 (Bouret et al. 2015); and on the right, blue compact dwarf galaxies with gas-phase iron abundances (plotted in absolute Fe/O space for consistency with previous nebular studies; Izotov et al. 2006; Kojima et al. 2021). We plot the two low-S/N systems (J0825555 and J120202) as fainter crosses and display an outlined point and error bar representing the average measurement integrated over our sample posterior. Note also that for ease of comparison with archival blue compact dwarf galaxy measurements, the gas-phase O/H measurement on the right panel x-axis is the direct-Te measurement without any correction for depletion or the RL–CEL scale difference.
Download figure:
Standard image High-resolution imageOur measurement of uniform O/Fe enrichment in the targeted C iv emitters confirms that galaxies with at least some of the crucial chemical imprints of legitimately “young” high-redshift galaxies can indeed be found nearby. The targeted systems appear to host a combination of iron-poor but oxygen-rich stars and gas comparable to the conditions encountered in the MW bulge or Carina in their early assembly (Figure 9). This high detection rate of α-enrichment is likely directly linked to the fact that we have selected our sample on the presence of high equivalent width nebular C iv emission, immediately ensuring they are especially high in sSFR and potentially preferentially identifying galaxies with particularly iron-poor massive stars (e.g., Senchyna et al. 2019). While the true fraction of such chemically young galaxies among local star-forming dwarfs is unclear, our results suggest that selections focused on high equivalent width and high-ionization nebular emission are likely one of the best ways to find nearby galaxies with stars and gas abundances comparable to those encountered in the early universe.
While having photospheric stellar abundances is the ideal case, the bulk of studies especially in a post-HST landscape will be forced to rely on optical spectroscopy. Gas-phase lines of ionized iron (primarily only of Fe iii, but in high-quality spectra spanning Fe ii–Fe v in the range 4200–5300; e.g., Izotov et al. 2006; Berg et al. 2021) provide an alternative way to estimate iron abundances in similar systems, especially at moderately low metallicities, albeit subject to potentially large systematic uncertainties in the ionization correction, depletion scale, and best available atomic data (e.g., Rodríguez & Rubin 2005; Izotov et al. 2006). In the right panel of Figure 9 we compare our measurements to those of other star-forming dwarf galaxies with oxygen and iron abundances from gas-phase emission line constraints (from Izotov et al. 2006; Kojima et al. 2021). The targets analyzed here are among the lowest metallicity in gas-phase O/H with measurements of iron abundances from any source. Recent analyses have found a broad range of Fe/O in the ionized gas, including measurements as high as the solar abundance of  at very low metallicity (Kojima et al. 2021; Isobe et al. 2022). In contrast, we find a systematically subsolar Fe/O across our sample (persistent even if we were to ignore the depletion and RL correction; Section 5.2), in closer agreement with the locus of the Izotov et al. (2006) sample at low O/H (where depletion effects should be smallest, though not necessarily negligible). This is further reinforced by the detailed study of Berg et al. (2021), where the gas-phase iron abundance in J104457 is estimated using four-zone photoionization modeling with multiple iron species resulting in Fe/O (though dependent on ICF) in broad agreement with our estimates. While the wide range of local results suggests some caution must still be applied, the agreement we find with Berg et al. (2021) suggests that at very low metallicity and with minimal dust the careful estimation of the gas-phase iron abundances may yield a complementary indirect path toward estimating stellar iron abundances locally.
The ratio of oxygen to iron we have inferred potentially contains significant information about the poorly constrained long-term enrichment and star formation histories of these isolated local dwarf galaxies. In a traditional closed-box view, our measurement of moderate to high α-enrichment would suggest that these galaxies are dominated to varying degrees by the yields from recent star formation and are in this sense broadly “young,” with a significant fraction of their total stellar mass built up recently. However, several factors neglected in this view are crucial to robustly quantifying this statement: notably pristine gas inflows and SNe-driven outflows (e.g., Dalcanton 2007; Chisholm et al. 2018) and the potential contribution of other exotic stellar enrichment events like hypernovae and pair-instability supernovae with different Fe/O yields than canonical core-collapse SNe (e.g., Nomoto et al. 2013; Isobe et al. 2022). While the targeted galaxies do appear to be relatively chemically young according to the canonical interpretation of the α/Fe clock, robust constraints on the possible star formation and chemical enrichment histories leading to their present state must await detailed modeling.
7. Summary
In this work we presented new ultra-deep HST/COS spectroscopy for six nebular C iv emitters in the nearby universe. These spectra provide a unique window into the massive star populations underlying their high-ionization emission. Our data place strong constraints on both the photospheric and wind features of these massive stars, as well as on the detailed profiles of the nebular emission that they power. We directly model the normalized stellar continuum and derive metallicity constraints driven by stellar iron absorption, which we then compare both to the gas-phase abundances and to the stellar wind profiles in the highest-S/N spectra in our sample. Our primary conclusions are summarized as follows:
- 1.The strength and profile of nebular C iv emission in these high-S/N spectra closely follow a sequence from weak emission with prominent blueshifted absorption to very high equivalent width emission with a broad double-peaked profile (Section 3.2). We suggest that this is strong evidence that resonant scattering is taking place in the escape of this C iv emission, and that this is most likely occurring in the circumgalactic medium of the target galaxies where C iv absorbers are frequently encountered (Section 6.1). This scattering may help explain some of the otherwise puzzling variation found in C iv strength observed locally, but there is good evidence to suggest that this is less likely to suppress C iv in z > 6 galaxies.
- 2.Despite the fact that our sample probes a fairly wide range of gas-phase metallicities 12 + logO/H ≃ 7.4–7.9, the photospheric metallicities we derive from the stellar continuum fits are uniformly low, at 2%–8% solar (Section 5). This further solidifies the notion that nebular C iv in star-forming galaxies is associated with the hard ionizing radiation fields produced in young stellar populations below 10% solar. Detailed comparison with the gas-phase oxygen abundances reveals evidence for α-enhancement, with [O/Fe] ranging from 2 to 5 across the sample (median Section 5.2). This enhancement persists at 1σ even in the conservative case of no correction to the gas-phase CEL abundance scale. This reveals that these galaxies are dominated by stars and gas with chemistry closer to that of their primordial high-redshift counterparts than to the bulk of the evolved low-redshift universe.
- 3.The strong constraints placed simultaneously on stellar photospheric lines and prominent stellar wind complexes represent a unique challenge for stellar population synthesis models. We find intriguing evidence for a mismatch between the prominent stellar C iv P-Cygni profiles and that predicted by the stellar models constrained by the photospheric lines in the highest-S/N spectra in our sample. In the context of the models, these wind lines in isolation require metallicities substantially higher (by 0.2–0.4 dex) than the photospheric lines prefer across our sample. Caution should thus be applied in interpreting metallicities derived from stellar wind lines directly as is routine at the highest redshifts. We suggest that this tension could reflect deficiencies in the treatment of winds for luminous metal-poor stars, but we cannot rule out the possibility that accounting for significant α-enhancement relative to solar abundances in the stellar atmosphere may also directly reproduce the anomalously strong C iv wind signature alongside weak photospheric iron absorption.

Our results forecast a promising future for the continued use of star-forming metal-poor dwarf galaxies as fundamental calibrators for both galactic and stellar astrophysics. Their importance in both roles will only increase as the next generation of large ground-based and space telescopes arrive on sky, revealing orders of magnitude larger samples of galaxies dominated by low-metallicity stellar populations. However, several key areas of attention must remain in focus as this work proceeds. First, the impending loss of ultraviolet spectroscopic capabilities from HST will severely hamper this work; observations of metal-poor star-forming galaxies are of especially high priority in the coming years, both as high-redshift templates and extremely low-metallicity stellar calibrators. A high S/N reference library of ultraviolet spectra for low-metallicity star-forming regions spanning as many of the photospheric and wind complexes in the FUV as possible will provide the empirical laboratory against which metal-poor stellar models can be usefully compared, for which this sample and the COS Legacy Archive Spectroscopic SurveY (CLASSY; Berg et al. 2022) represent a significant start. In addition, alternative pathways in the optical and infrared toward constraining the fundamental properties of the massive stars in these systems should be thoroughly explored. And second, the latest stellar population synthesis prescriptions are already being pushed to their limits in reproducing the detailed UV spectra of star-forming regions including those presented here. A next-generation sequence of stellar population synthesis models with underlying atmosphere grids where important properties including abundances and wind modeling parameters are varied in physically motivated ways will be necessary to fully explore the information content of these stellar continua, as well as to enable a full assessment of the quantitative systematic uncertainty these variables introduce to the modeling of integrated spectra at high redshift.
The authors thank the anonymous referee for very helpful comments which improved the clarity of this manuscript. This research is based on observations made with the NASA/ESA Hubble Space Telescope and supported by a grant from the Space Telescope Science Institute, which is operated by the Association of Universities for Research in Astronomy, Inc., under NASA contract NAS 5-26555. These observations are associated with programs GO:15646 and GO:15881. Observations reported here were obtained at the MMT Observatory, a joint facility of the University of Arizona and the Smithsonian Institution. Some of the computing for this project was performed on the Memex cluster. We would like to thank Carnegie Institution for Science and the Carnegie Sci-Comp Committee for providing computational resources and support that contributed to these research results.
P.S. was generously supported by a Carnegie Fellowship through the Carnegie Observatories during the completion of this manuscript. D.P.S. acknowledges support from the National Science Foundation through the grant AST-1410155. J.C. and S.C. acknowledge support from the ERC via an Advanced Grant under grant agreement No. 321323-NEOGAL.
This research made use of Astropy, a community-developed core Python package for Astronomy (Astropy Collaboration et al. 2013); Matplotlib (Hunter 2007); Numpy and SciPy (Jones et al. 2001); the SIMBAD database, operated at CDS, Strasbourg, France; and NASA’s Astrophysics Data System.
Appendix A: HST/COS Observations and Calibration
Here we provide a detailed accounting of the HST/COS observations and their calibration, as summarized in Section 3.1 and Table 3. All targets were observed with G160M/1533 for either 10 or 5 orbits. To maximize the ability of our observations to be scheduled, these allotted orbits were split between two (5+5 orbits) or three (2+2+1 orbits) separate telescope visits (respectively; see Table 3). Since our initial coordinates were based upon centroids of the SDSS u-band images which are well-aligned astrometrically, each visit began with a single ACQ/IMAGE exposure with the NUV camera (plus the standard follow-up confirmation image) to acquire and center the target star-forming regions in the primary science aperture (PSA). All acquisition exposures were conducted with the PSA and MIRRORA using exposure times based upon simple point-source ETC calculations and previous acquisition exposures for the targets (median on-source time of 60 s). As observed on prior acquisition of these targets, all resolve into a dominant compact star-forming region with outlying flux, consisting of some mixture of subdominant compact regions and diffuse flux (Figure 1).
After target acquisition, the remainder of each visit consisted of spectroscopic exposures in the TIME-TAG mode. Taking advantage of the faintness of the targets, the entire duration of each orbit was devoted to on-target exposure, with buffer dumps taking place during target occultation. Internal wavelength calibrations were conducted simultaneously using the recommended TAGFLASH (FLASH = YES) lamp flashes. To minimize the impact of fixed-pattern noise, the instrument was also shifted to a new FP-POS setting between orbits, cycling through all four for approximately equal exposure time spread over the course of the visit blocks for each target. All of the spectroscopic observations in both of the programs presented here were conducted at Lifetime Position 4 (LP4).
This nominal observing plan was disrupted by a handful of telescope exception events, some of which affected data acquisition and required repeat observations. We detail these events below in the order that they occurred:
- 1.On 2019 October 9 during Visit 6 of GO:15646, the HST Fine Guidance Sensors (FGS) lost guide star lock during the final exposure for that visit on HS 1442+4250. As a safety measure, this caused the shutter to close, losing approximately 10 minutes of the planned exposure time. A single additional orbit was awarded in response to Hubble Observing Problem Report (HOPR) 91647 to re-execute the failed exposure, which proceeded successfully (Visit 56).
- 2.While initiating Visit 3 of GO:15881 on 2020 February 18, the FGS failed to acquire the guide stars before the target acquisition sequence was scheduled to begin. As a result, following COS safety protocols, the shutter was not allowed to open for the ACQ/IMAGE exposure or the planned spectroscopic exposure. This failed visit was rescheduled as Visit 53 following HOPR 91715.
- 3.Full guide star acquisition was unexpectedly delayed during the rescheduled Visit 53 on 2020 March 30. However, the spectroscopic exposure proceeded for the planned duration, and the flux and S/N in the resulting spectrum were in good agreement with the prior observations of J082555 from this program. Thus, no repeat observations were necessary, and we proceeded with the collected data.
- 4.Finally, guide star acquisition was again delayed during Visit 8 of GO:15646. But as for Visit 53, the acquired spectrum closely matched the continuum level and S/N achieved in the previous identical Visit 7 also targeting J104457 which proceeded normally. We thus used the data collected during this visit as usual.
In summary, Visit 3 of GO:15881 and one orbit of Visit 6 of GO:15646 failed and required repeat observations, but the other exceptions were noncritical and did not affect the collected data.
The data for both programs was reduced, calibrated, and combined using calcos (version 3.3.10). This reduction was performed using the latest reference files (as of 2021 February) from the HST Calibration Reference Data System (CRDS). Briefly, calcos first corrects and calibrates the raw TIME-TAG photon event lists for each FUV spectroscopic exposure, including corrections for temperature and geometric distortion effects, pulse height filtering for cosmic ray and background rejection, flat-field correction, and wavecal offsets using the contemporaneous TAGFLASH exposures recorded in the same TIME-TAG table. These corrected photon event tables are then binned to a two-dimensional spectral image, from which a one-dimensional spectrum is extracted.
By default, the extraction is performed using the new TWOZONE algorithm for these FUV spectra. In this case, calcos first straightens and centroids the object trace, before summing flux over the object profile (with data quality flags assessed in a second “inner zone” subset of this full profile) and subtracting a per-column background level. However, since it was optimized for point sources, this algorithm might underestimate the flux of very spatially extended sources, whose flux might also overlap with regions of more significant gain sag. We visually confirmed that the bulk of the FUV light from all six of our sources is reasonably compact in the cross-dispersion direction in the calibrated two-dimensional .flt images, and in particular is well contained within the nominal extraction zone. To test quantitatively whether deviations from an unresolved source profile might still impact our final spectra, we also re-extract the spectra using the older BOXCAR algorithm (with TRCECORR and ALGNCORR both set to be omitted). The resulting one-dimensional spectra are in good agreement with those extracted using the TWOZONE method, with only a small (median 1%, all ≲4%) increase in the overall continuum flux level. Thus, we proceed with the preferred default TWOZONE extraction method for our analysis.
After extraction of each spectroscopic exposure, the data from all visits and exposures are joined to produce a final combined one-dimensional spectrum. The fluxes at each physical wavelength bin in all calibrated subspectra without serious data quality flags are combined, weighted by the individual exposure times. Including data taken at all four FP-POS settings ensures that no large data quality gaps interrupt the final spectrum, and minimizes the residual impact of fixed-pattern features which remain at low levels after flat fielding. We also produced x1dsum combined spectra for each visit which contributed to the final combined spectrum. We do not find any clear signs of either total flux variation or significant changes in spectral features upon a comparison of these temporally separated per-visit and combined spectra.
While HST/COS is well suited for observation of faint UV sources, some difficulties arise in calibrating realistic uncertainties for such observations. For instance, the uncertainty in the instrumental dark current correction represents a substantial portion of the calcos error budget for faint sources, but this value can be overestimated. As recommended in the COS Data Handbook (Rafelski 2018), we compare the reported calcos uncertainties to the observed scatter in the flux array to determine whether any correction to the uncertainties is required. In particular, we compare the standard deviation in the flux to the median-filtered error array at a resolution of 10 pixels (∼0.12 Å; a small enough wavelength range for noise to still dominate over real flux variation at the resolution of our spectra). This comparison reveals that the observed noise in the final spectrum is consistently smaller than predicted by the formal calcos uncertainty array. We find a fairly constant median value for this ratio for each spectrum, with only a small (≲15%) shift toward more inflated calcos uncertainties relative to observed scatter in the longer-wavelength Segment A of the FUV detector compared to Segment B. This ratio of observed to formally expected noise varies from ≃0.7 for the faintest FUV sources in our sample (SB 2, J120202, J082555) up to 0.85 in the brightest (SB 82), consistent with an origin in overestimation of instrumental noise sources dominant for faint targets in the calcos pipeline (see also e.g., Wakker et al. 2015, where similar findings were reported for G130M observations). We adopt this ratio as measured for each spectrum as a constant uncertainty correction factor, and multiply the calcos error spectrum for each target accordingly (Table 3).
Appendix B: On Other Stellar Population Synthesis Assumptions
B.1. Comparison to Starburst99
Differing assumptions in both stellar evolution and crucially atmosphere predictions for hot stars could lead to variation between assumed model frameworks in the stellar metallicities derived from the continuum fits described herein. To test this, we generate a grid of CSFH models from the latest public version of S99 (Leitherer et al. 2014) and repeat the same analysis as described in Section 4.2 with a few small differences. We focus on the fully theoretical UV spectral predictions output by S99 (Leitherer et al. 2010), which provides spectra at a resolution of 0.4 Å over the targeted wavelength regime. The sharp photospheric transitions evident in the raw S99 spectra relative to C&B evince the higher base resolution of the internal stellar atmosphere grids used in these models; we find similar agreement between models and data when the flexible Gaussian smoothing is applied to the model spectra rather than to the data as in the case of C&B. We generate a grid of CSFH models with a Kroupa et al. (1993) IMF and upper-mass cutoff of 100 M⊙ at ages from 0 to 100 Myr and at the full set of five metallicities provided from Z = 0.0004–0.05. We compare the resulting fits to the spectra alongside the fiducial CB results in Figures 10, 11, and 12.
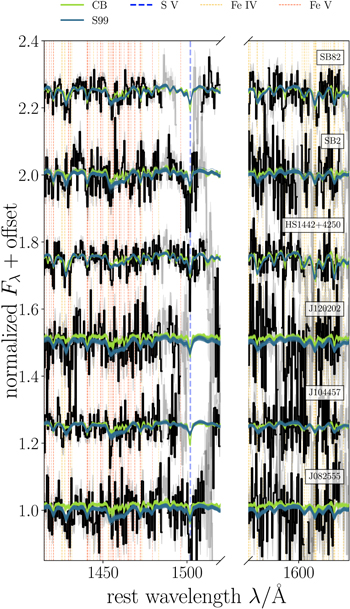
Figure 10. Fits to the photospheric continuum with both C&B and S99, focused on regions dominated by Fe iv and Fe v absorption.
Download figure:
Standard image High-resolution imageThe resulting metallicity estimates from the S99 CSFH fits with constrained age prior are displayed alongside our fiducial metallicities from C&B in Table 7. Morphologically, only small differences are visible in the key photospheric line complexes between these models. In general the results from the two models also agree remarkably well, with inferred metallicities in agreement within 1.5σwith only one exception: HS 1442+4250, for which S99 prefers a 0.36 dex lower metallicity (∼2σ). Much more significant disagreement is visible in the strength of the stellar wind lines especially He ii (Figures 11 and 12). This is attributable to the significant changes made to the treatment of luminous massive stars with WR-like atmospheres in the latest C&B models (see also Senchyna et al. 2021) and underscores the importance of treating inferences drawn from the wind lines with additional caution.
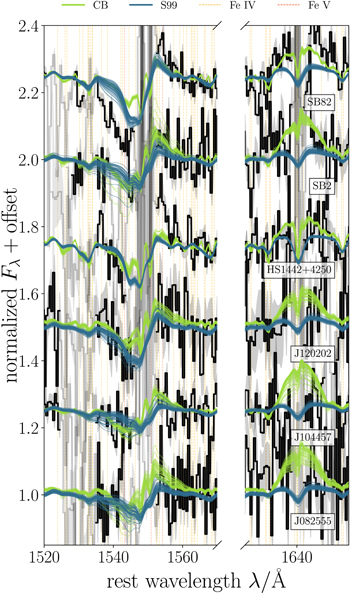
Figure 11. Same as Figure 10, but focused on the stellar wind line profiles of C iv and He ii.
Download figure:
Standard image High-resolution image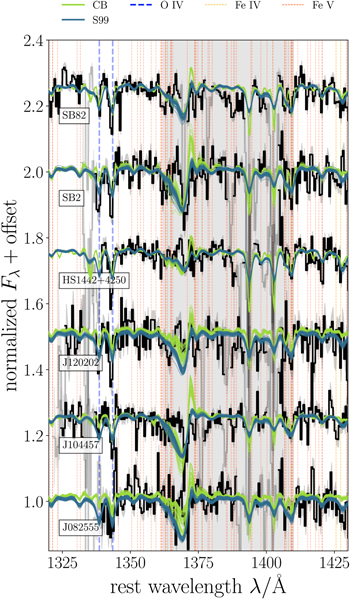
Figure 12. Same as Figure 10, but here focusing on the blue end of our G160M spectra, including the O v λ1371 and S iv λ λ1393, 1402 resonant doublet. The grayed-out wavelength region is never included in our fits to avoid issues in matching O v λ1371, Si iv λ1393, 1402, and the ISM-contaminated C ii lines present there.
Download figure:
Standard image High-resolution imageTable 7. Photospheric Stellar Metallicities Derived From C&B and S99
| Target |
 CSFH, With Age Prior CSFH, With Age Prior | |
|---|---|---|
| Name | C&B | S99 |
| J082555 |

|

|
| SB2 |

|

|
| J104457 |

|

|
| SB82 |

|

|
| J120202 |

|

|
| HS1442+4250 |

|

|
Download table as: ASCIITypeset image
B.2. On the Star Formation History
As discussed in Sections 4 and 5, a bursty star formation history as parameterized by a discrete combination of SSPs rather than a CSFH can change the relative impact of the most luminous stars on the UV continuum. The character of these effects is often degenerate with other potential deficiencies in the models including most obviously the high-mass IMF shape and cutoff. Here we briefly discuss the results of fitting the photospheric continuum with a combination of two SSPs rather than a CSFH, which are presented in Table 5. We also considered a combination of a CSFH model with a superimposed SSP both with variable age and UV contribution, with broadly qualitatively similar results. In general, we find that the impact on the photospheric metallicities is to add scatter at a level of ∼0.1–0.2 dex rather than introduce any systematic offsets, with a median change in  of −0.02 dex when the SFH is shifted from continuous to a two SSP formulation.
As visible in Figure 13, the effects on the wind lines are similarly scattered. The strength of the stellar He ii line shows the most variation, with the posteriors of the 2-SSP fits generally bracketing the CSFH fits but sometimes extending to significantly stronger or weaker signatures. The effect on the C iv P-Cygni profile is generally smaller. Most notably, the emission lobe of C iv in the best-fit models for HS 1442+4250 is significantly stronger and closer to the data in the 2-SSP case than in the CSFH model. We interpret this as a consequence of an increased proportion of luminous stars with WR-like spectra in the models. Though the C iv emission lobe is closer to that observed for HS 1442+4250, both it and the He ii are notably overpredicted by the posterior spread in this case. Crucially, essentially no impact is observed in the absorption trough for C iv; the observed profile for SB 82 is still substantially stronger than predicted by the models fit to the photospheric lines.
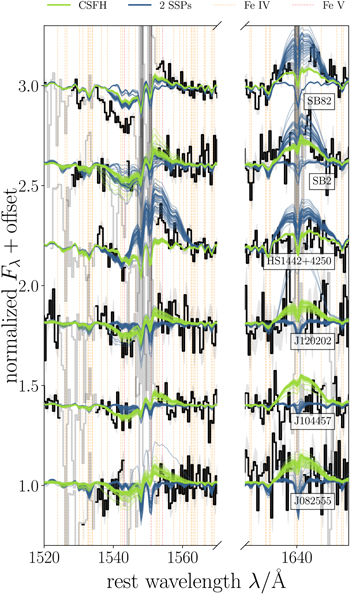
Figure 13. Comparison of fits to the photospheric continuum in predictions for the stellar wind lines C iv (left) and He ii (right) with the C&B models assuming a constant star formation history with variable age (CSFH, light green) and assuming a combination of two SSPs (dark blue). The primary effect of adopting a bursty SFH as in the latter case is an increase in scatter for the stellar He ii line, and in some cases (notably HS 1442+4250) additional flexibility in the emission lobe of the C iv profile—both of which are likely driven by WR spectra assigned to very luminous stars. Minimal impact is observed for the depth of the absorption trough of C iv which remains highly discrepant for SB 82.
Download figure:
Standard image High-resolution imageIn general, the wind morphological agreement is worse for the 2-SSP models than for the CSFH fits, and of the two high-S/N and discrepant models, only the C iv emission mismatch in HS 1442+4250 is aided by adopting a bursty SFH.
Appendix C: On the Robustness of Metallicities Derived from the UV Continuum
Here we explore several potential sources of systematic uncertainty which may generally impact the derivation of stellar metallicities from UV photospheric lines in unresolved star-forming galaxy spectra. As discussed, our main conclusions are unlikely to be impacted significantly by these considerations, but they should be considered in more detail moving forward as results at low and high redshift begin to rely on the increasingly precise inference of Z⋆ from such observations.
C.1. Metallicity Retrieval at Low S/N
One important concern in metallicity retrieval from stellar continuum fitting is the impact of S/N in the observed spectra. At low S/N, noise in the continuum could act to artificially mimic or enhance real variation due to the forest of photospheric absorption lines, potentially increasing the inferred metallicity (e.g., Topping et al. 2020b). In principle, our Bayesian approach to modeling the continuum accounting directly for the spectral uncertainties (including a model for potentially underestimated errors) should produce results consistent with the true metallicity even at relatively low S/N. To test this, we perform a series of simulations using our fiducial C&B models. For S/N per model wavelength pixel ranging from 5 to 50, we resample the model spectrum with Gaussian uncertainties added and run the resulting simulated spectrum through the same machinery described in Section 4.2 which has been applied to extract metallicities from our observed spectra. For the purposes of this experiment we focus on a CSFH model with “true” metallicity Z = 0.0002 and age 10 Myr; we find qualitatively similar (and generally more favorable) results at higher metallicities where the added noise less readily affects the stronger photospheric lines. We extract metallicity constraints from the fits to the same wind-masked regions probed by the observed spectra, specifically focusing on 1420–1510 and 1565–1630 Å.
We perform several sets of simulations at each S/N and plot the results as a function of this ratio in Figure 14. As expected, this experiment shows a bias toward higher inferred metallicities at low S/N (<20), likely a combination of both noise imitating photospheric features and regression of the posterior distribution toward the prior (flat in  ) as the data loses informative power. However, incorporating a Gaussian prior on the age centered on the true value significantly improves this outlook at low S/N, reducing the rate at which trials result in a posterior metallicity distribution inconsistent at 1σ with the true metallicity from ∼40%–50% to ∼20% in this low-S/N regime (broadly consistent with expectations for the 68% confidence interval utilized). Additionally, note that our deep COS spectra all reside at S/N > 20 per 0.5 Å model pixel (even assuming the conservatively large formal COS uncertainties: Table 3). In this regime, both sets of simulations suggest that bias in the inferred metallicities should be minimal and that such noise is unlikely to introduce error beyond that already accounted for by our uncertainty analysis.
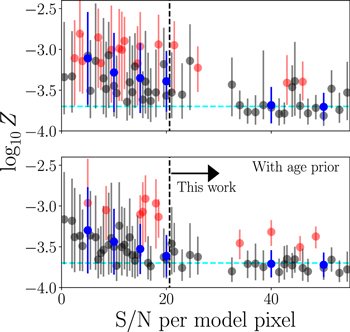
Figure 14. Demonstration of metallicity retrieval applying our photospheric continuum fitting code to mock spectra. Both panels display the derived 68% confidence interval on  from fits to different realizations of a mock spectrum (CSFH, 10 Myr, Z = 0.0002) resampled at S/N per 0.5 Å model pixel of [5, 10, 15, 20, 40, 50]. Each fit is a black point, offset on the x-axis for clarity, except for cases where the 1σ confidence range does not overlap with the true metallicity (indicated as a cyan dashed line), in which case the point is colored red. The median recovered metallicity and average uncertainty in each S/N bin are indicated by a blue point. The top panel displays the fits with a CSFH with flat priors in
  and
and  while the bottom shows results with a 0.05 dex Gaussian prior centered on the true age. For S/N ≳ 20, the vast majority of individual realizations produce results consistent with the true metallicity within 1σ, and results with a prior on age show negligible bias toward higher metallicities.
Download figure:
Standard image High-resolution imageC.2. Nebular Continuum Assumptions
Here, we briefly consider the impact of varying the nebular continuum parameters  and nH discussed in Section 4.1.2 on the predicted contribution of the nebular continuum to the FUV, and on the derived stellar properties.
First, we find that increasing the ionization parameter from the fiducial value of  has the effect of decreasing the relative contribution of the nebular continuum in the FUV. This is a consequence of the dust included in the spherical cloudy models used to generate the nebular continuum. An increase in the ionization parameter corresponds to an increase in the filling factor of gas and dust in these models at fixed Q and nH (Plat et al. 2019), so a larger proportion of the fixed number of ionizing photons is absorbed by dust rather than by the gas, reducing the total recombination rate and thus the UV nebular continuum. As a result, increasing
  will decrease the total continuum and increase the predicted equivalent width of the stellar absorption features at fixed other parameters, leading to a lower inferred metallicity for a given observed stellar continuum. However, we find that this effect is generally small, leading to downward offsets in the derived Z of <0.05 dex up to
  and 0.1–0.2 dex in the very worst case of
  (likely far larger than is appropriate even the most extreme systems in our sample; e.g., Berg et al. 2019a).
We also examine the impact of the gas density nH on the nebular continuum and our results. The two-photon emission channel which dominates the nebular continuum in this FUV range can be suppressed by collisional deexcitation at sufficiently high electron densities. Thus an increase in the assumed nH would qualitatively produce a similar effect to an increase in the model  diminishing the level of the nebular continuum and decreasing the inferred metallicity. However, we compute models with nH = 500 cm−3 (much larger than inferred in any of our galaxies) to test the magnitude of this effect, and find that the decrease in the nebular continuum relative to our primary 100 cm−3 models amounts to <10% over the considered wavelength range, leading to a much smaller effect than that induced by
  .
.
To summarize, we estimate that uncertainties in  and nH have only a small impact on our conclusions, and would produce a minor systematic error toward inferred metallicities ≲0.1 dex higher than reality if either
  or nH are underestimated by our fiducial model assumptions.
C.3. Other Considerations
A crucial parameter that has not generally been taken into consideration in the derivation of metallicities from integrated galaxy spectra is microturbulence. Detailed NLTE atmosphere modeling of individual OB star spectra in the Local Group has revealed the importance of including significant of order ∼10 km s−1 microturbulent velocities in order for the models to reach a consistent match for the important photospheric line strengths and profiles (e.g., Hillier et al. 2003; Heap et al. 2006; Bouret et al. 2013). Whether this finding corresponds to real physical microscopic motions or other physics remains unclear, but crucially, the modeled strength of the UV iron lines is found to increase with increasing microturbulent velocities, complicating iron abundance derivations (e.g., Bouret et al. 2015). The TLUSTY atmosphere grids undergirding the OB star predictions for the C&B models we have adopted assume a typical microturbulent velocity of 10 km s−1 (Lanz & Hubeny 2003, and Y. Chen, 2022, private communication). It is important to note that if a larger microturbulent velocity were adopted, we would expect to find stronger iron lines at fixed Z in the models and thus infer smaller stellar metallicities from our fitting, increasing the tension with the gas-phase abundances. Also, while complicated by the likelihood of subsolar α/Fe ratios relative to the models, the fact that the microturbulence-sensitive S v λ1502 line is not overestimated by the models lends further support to the notion that the assumed microturbulence is not overestimated (and thus that our iron abundances are not correspondingly underestimated).
Footnotes
- 8
- 9
For comparison, the also commonly employed and recently updated results of Asplund et al. (2009, 2021) prefer uniformly somewhat smaller present-day solar abundances by ∼10–20%: 12 + logO/H = 8.69, 12 + logFe/H = 7.46, and Z = 0.0139; note that choosing to adopt this slightly lower abundance baseline would not qualitatively affect the results of this paper.
- 10
Adopting the pyneb tabulated atomic and collisional data for O+ from Froese Fischer & Tachiev (2004), Wiese et al. (1996), Tayal (2007); for O2+ from Froese Fischer & Tachiev (2004); Storey & Zeippen (2000); Storey et al. (2014); and for S+ from Tayal & Zatsarinny (2010), Irimia & Froese Fischer (2005).
- 11
Unresolved in our observations, and hereafter referred to as [O ii] λ3727.
- 12
Note that J120202 was observed with the BOSS spectrograph as one of the 173 galaxies targeted in the Census of Nearby Galaxies ancillary program (following up systems identified in Palomar Transient Facility narrowband Hα imaging), and thus [O ii] is accessible in the original optical spectrum by virtue of its bluer cutoff.
- 13
The Hβ equivalent widths reported here are not corrected for underlying stellar absorption. Such a correction will be small for galaxies with such prominent nebular emission and young effective ages. Crucially, this absorption is self-consistently accounted for when we compare our uncorrected equivalent widths to the integrated model line fluxes in the following analysis (Section 2.2).
- 14
- 15
Note also that this offset is slightly larger but comparable to the difference observed between metallicities derived with the direct-Te method and those found from the same emission line measurements using photoionization modeling analysis with an earlier version of the C&B models and a sample of higher-metallicity star-forming regions in Senchyna et al. (2021). That is, adopting photoionization model-based metallicities rather than RL-corrected direct-Te metallicities in this analysis could be expected to yield similar final results.
- 16
- 17
As expected from photoionization modeling of high-redshift C iv emitters; e.g., Stark et al. (2015).
- 18
- 19
It is interesting to note however that this is not always the case. In particular, an enhancement in O/Fe of 2.2 over solar will effectively cancel out the RL–CEL and depletion corrections we have adopted in this work. In this context, previous work where these factors are neglected but an agreement between stellar and gas-phase metallicities are found (e.g., Chisholm et al. 2019) might instead be reinterpreted as evidence for modest α/Fe enhancement.