Abstract
Some evolved binaries, namely post–asymptotic giant branch (AGB) binaries, are surrounded by stable and massive circumbinary disks similar to protoplanetary disks found around young stars. Around 10% of these disks are transition disks: they have a large inner cavity in the dust. Previous interferometric measurements and modeling have ruled out these cavities being formed by dust sublimation and suggested that they are due to massive circumbinary planets that trap dust in the disk and produce the observed depletion of refractory elements on the surfaces of the post-AGB stars. In this study, we test an alternative scenario in which the large cavities could be due to dynamical truncation from the inner binary. We performed near-infrared interferometric observations with the CHARA Array on the archetype of such a transition disk around a post-AGB binary: AC Her. We detect the companion at ten epochs over 4 yr and determine the three-dimensional orbit using these astrometric measurements in combination with a radial velocity time series. This is the first astrometric orbit constructed for a post-AGB binary system. We derive the best-fit orbit with a semimajor axis of 2.01 ± 0.01 mas (2.83 ± 0.08 au), inclination (142.9 ± 1.1)°, and longitude of the ascending node (155.1 ± 1.8)°. We find that the theoretical dynamical truncation and dust sublimation radii are at least ∼3× smaller than the observed inner disk radius (∼21.5 mas or 30 au). This strengthens the hypothesis that the origin of the cavity is due to the presence of a circumbinary planet.
Original content from this work may be used under the terms of the Creative Commons Attribution 4.0 licence. Any further distribution of this work must maintain attribution to the author(s) and the title of the work, journal citation and DOI.
1. Introduction
It is well established that planet formation takes place in protoplanetary disks (PPDs) around young stars. These PPDs are extensively studied to trace the initial conditions and mechanisms of planet formation. Spatially resolved observations of these disks revealed the presence of a wide diversity of structures such as gaps, spirals, or warps (e.g., Calvet et al. 2002; Johansen et al. 2007; Andrews et al. 2011; Pinilla et al. 2012; Sheehan & Eisner 2018; Rich et al. 2022). These structures can be linked to planet formation, whether they are caused by already formed planets or will trigger planet-formation mechanisms is not yet understood. The first evidence for gaps and inner cavities in the dust disks around PPDs was deduced from spectral energy distributions (SEDs; e.g., Strom et al. 1989), where a lack of near-infrared excess was observed, while for a full continuous disk hot, thermal dust emission is expected to be observed at these wavelengths. Various interpretations for the origin of such extended disk cavities have been proposed, the most likely being the presence of a giant planet or a companion, or the action of disk dissipation through photoevaporation (e.g., Espaillat et al. 2014). The disks around young stellar objects which contain such cavities are called transition disks (van der Marel 2023).
Interestingly, the presence of disks in which large cavities were also detected have been around evolved stars, namely post–asymptotic giant branch (post-AGB) binaries (Hillen et al. 2015; Kluska et al. 2022; Corporaal et al. 2023). Post-AGB stars are luminous objects of low and intermediate initial masses (0.8–8 M⊙), but in their almost final stages of stellar evolution. A post-AGB star has lost its envelope in the AGB phase and is now contracting to become a white dwarf, crossing the Hertzsprung–Russell diagram at an almost constant high luminosity. The companion star is likely a main-sequence star reported from spectroscopic observations (Oomen et al. 2018). Post-AGB stars with a main-sequence companion are surrounded by massive dusty and gaseous disks, as indicated by a strong observational link between a disk-like infrared excess in the SED and the radial velocity detection of a companion (see the review by Van Winckel 2018, and references therein). These disks are strikingly similar to PPDs. They have similar masses (e.g., Sahai et al. 2011; Bujarrabal et al. 2015), are stable (i.e., in Keplerian rotation; e.g., Bujarrabal et al. 2013, 2015, 2018; Gallardo Cava et al. 2021), and can be modeled with radiative transfer models of PPDs (Hillen et al. 2015; Kluska et al. 2018). The disk’s inner rim can be resolved with infrared interferometry and is located at the dust sublimation radius for most of the targets (Hillen et al. 2016, 2017; Kluska et al. 2019, 2020; Corporaal et al. 2021).
Recently, the infrared excesses of all identified post-AGB binaries in the galaxy (85 objects) was studied to characterize these disks (Kluska et al. 2022). While most of the infrared excesses are compatible with full disks (categories 0 and 1 in Kluska et al. 2022) around 10% of the disks have a lack of near-infrared excess (categories 2 and 3 in Kluska et al. 2022). These disks are reminiscent of transition disks around young stars, as the lack of near-infrared excess emission points to an inner rim at several times the dust sublimation radius.
Moreover, it was found that post-AGB stars surrounded by such transition disks are more depleted of refractory elements (Kluska et al. 2022). This is a signature of a mechanism trapping the dust in the disk, and letting the volatile elements be accreted onto the binary stars. 13 A similar phenomenon is observed around Herbig stars, where the radiative nature of the stellar atmosphere makes it possible to relate the observed element abundances to the accretion history (Kama et al. 2015). As the remaining envelope material is low in mass in post-AGB stars, the accretion of depleted gas impacts much stronger on the surface abundances and depletion is much stronger than in Herbig stars (Jermyn & Kama 2018; Oomen et al. 2019). An efficient pressure bump in the disk, trapping the dust grains but letting the gas through, is expected to produce such depletion. Thus, the main hypothesis to explain the large cavities are either the inner binary which truncates the disk, or the presence of a third (planetary-mass) component in the system which truncates the disk and traps the dust in the disk (Kluska et al. 2022); only the latter mechanism provides a scenario for depletion.
In this work, we study the post-AGB system AC Herculis (AC Her, HD 170756, HIP 90697; Hillen et al. 2015), which is an F4Ibp spectral type and single-lined star spectroscopic binary with an orbital period of 1194 ± 6 days (Van Winckel et al. 1998; Oomen et al. 2018). It is located at a distance of 1402 ± 43 pc (Gaia DR3; Gaia Collaboration et al. 2016, 2022). We consider the Gaia DR3 “distance_gspphot” distance as its lower uncertainty in comparison to other reported distance measurements, see Section 3.3. In what follows, we stress that our angular scales are mainly distance independent, while the translation to physical scales is not. AC Her is considered as a prime example of a transition disk around a post-AGB binary and is classified as category 2 in Kluska et al. (2022). AC Her is a RV Tauri pulsator and some basic properties are given in the Table 1. Several tracers, including [Fe/H] of −1.5, reveal that the observed composition of the post-AGB star surface is depleted of refractory materials (Van Winckel et al. 1998), similar to post-AGB transition disks (Kluska et al. 2022).
Table 1. Properties of AC Her
| Parameter | Value | References | |
|---|---|---|---|
| Literature | Spectral type | F4Ibp | |
| Rin |
 au au | 1 | |
 mas mas | |||
| d | 1402 ± 43 pc | 2 | |
| L* | 2475 L⊙ | 3 | |
| 104 L⊙ | 4 | ||
| Teff | 5255 ± 125 to 5800 ± 250 K | 1,6 | |
| Measured | a | 2.83 ± 0.08 au | 7 |
| 2.01 ± 0.01 mas | |||
| e | 0.206 ± 0.004 au | 7 | |
| q | 0.52 | 7 | |
| Derived | Rtrunc | 9.03 ± 0.28 au | 7 |
| 6.44 ± 0.04 mas | |||
| Rsubli at L* = 2475 L⊙ | 3.2 au | 7 | |
| 2.3 mas | |||
| Rsubli at L* = 104 L⊙ | 9 ± 1 au | 7 | |
| 6.4 ± 0.5 mas |
Note. References: (1) Hillen et al. (2015), (2) Gaia Collaboration et al. (2022), (3) Bódi & Kiss (2019), (4) Miller Bertolami (2016), (5) Kluska et al. (2019), (6) Kluska et al. (2022), and (7) this work. The symbols are: Rin is the radiative transfer model and observed interferometric-data-fitted inner disk cavity radius, d is the Gaia DR3 distance, L* is the post-AGB star luminosity, Tsubli is the dust sublimation temperature, QR is the ratio of dust absorption efficiencies, q is the binary mass ratio, Rtrunc is the binary truncation radius, and Rsubli is the dust sublimation radius.
Download table as: ASCIITypeset image
Observations with the Plateau de Bure Interferometer in 12CO J = 2-1 show that the circumbinary disk around AC Her is stable, i.e., in Keplerian rotation, with an outer radius of ∼1000 au in gas (Bujarrabal et al. 2015; Gallardo Cava et al. 2021). Mid-infrared high angular observations with MIDI combined with a study using radiative transfer models of disks have shown that the inner disk cavity radius is  mas (
mas ( au using the Gaia DR3 1402 ± 43 pc distance), which is around ten times larger than the theoretical dust sublimation radius (Hillen et al. 2015; computed in the 1.5–5.0 au range). The disk is inclined (i = 50 ± 8)° with a position angle of PA = (305 ± 10)° (Hillen et al. 2015).
Here we investigate the origin of the large disk cavity in AC Her’s disk with high-angular-resolution observations in the near-infrared with the Center of High-Angular Resolution Astronomy (CHARA) Array (ten Brummelaar et al. 2005; Gies et al. 2022). The observation and data reduction are described in Section 2. The binary detection and detection limits, our best-fit orbital solution, and dynamical mass determinations are reported in Section 3. The binary truncation and dust sublimation resulting in disk cavities are computed in the discussion Section 4. In the final section, we summarize our findings and give conclusions.
2. Observations and Data Reduction
We used MIRC-X (Anugu et al. 2018; Kraus et al. 2018; Anugu et al. 2020a), a six telescope beam combiner instrument at the CHARA Array, to obtain observations of AC Her in H band (wavelengths λ = 1.4–1.72 μm). Between 2019 and 2022, we obtained observations at ten epochs. The CHARA Array delivers high angular resolution at optical/near-infrared wavelengths using baselines from 30 to 330 m corresponding to an angular resolution of, e.g.,  mas in H band. The MIRC-X instrument measures 15 squared visibilities (V2) and 20 closure phases (T3PHI) simultaneously.
The observations are obtained with a low spectral resolution of  , which provide eight spectral channels. The setup results in a ∼50 mas interferometric field of view that is enough to image the AC Her system (Anugu et al. 2020a). MIRC-X provides precision orbits with astrometric measurements of close binaries down to ∼10 μas level (e.g., Gardner et al. 2021). We used unresolved calibrator stars to calibrate the instrumental and atmospheric transfer functions. The details of the observational setup and instrument configurations with calibrators for each epoch are tabulated in the Appendix, Table 4. Our observations benefited from the recent installation of an adaptive optics system for the CHARA Array telescopes, which improved sensitivity by a magnitude (e.g., Che et al. 2013; ten Brummelaar et al. 2018; Anugu et al. 2020b).
The MIRC-X data are reduced with the standard mircx pipeline 14 version 1.3.5, which is publicly available (Anugu et al. 2020a). To increase the signal-to-noise ratio (S/N) of V2 and T3PHI, we reduced the data with an integration time equal to the atmospheric coherence time for each observation. We checked for any signs of binarity of the calibrators by calibrating the calibrators against each other and searched for binarity signals in them using the CANDID(Gallenne et al. 2015) software. No signs of binarity were found among the calibrators.
3. Orbital Solution and Dynamical Masses of the System
The reduced MIRC-X data (see Appendix Figure 5) show a significant nonzero closure phase signal. In this section, we present geometric models that show that these phase signals can be attributed to the binary system. We derive the relative astrometry for the two stars and fit the astrometric orbit.
3.1. Companion Detection
To reproduce the data, we used Python-based Parametric Modeling of Optical InteRferomEtric Data (PMOIRED; 15 Mérand 2022a). This software allows implementing geometric models with a combination of basic building blocks such as uniform disks, rings, and Gaussian intensity distributions and their emission characteristics to fit the measured interferometric data in Fourier space. We include a geometric model to fit the data (V2 and T3PHI), where our model consists of a binary and background flux, the latter to recover the overresolved visibilities at the short baselines. The model has thus seven parameters: the flux ratio of the companion (companion,f), the position (X, Y) of the companion relative to the primary post-AGB star, and the uniform diameters of the two stars (star,ud, companion,ud). Finally, the spectral indices of the companion uniform disk (companion,ind) and the background (background,ind). The total flux is fixed at 1. This means that the fluxes are fitted as ratios to the total flux.
The astrometric positions of the companion and the rest of the geometric model fitting parameters are tabulated in the Appendix, Table 5, with the associated statistical errors. Figure 1 shows the geometrical model images for the different epochs.
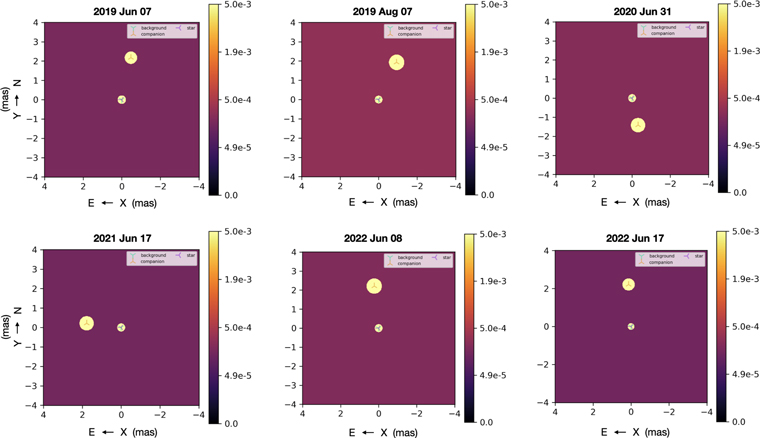
Figure 1. The best-fit images constructed for various epochs spanning four observing years. The epoch is denoted on the top of each image window. The images consist of the post-AGB star (smaller in size) and companion star (larger in size). The image is shown with a cut of 5 × 10⁻³ of the surface brightness. North is up, and east is to the left. The field of view of this image is 8 × 8 mas.
Download figure:
Standard image High-resolution imageWe find the companion at 10 epochs with separations from 1.46 mas to 2.22 mas. The derived astrometric positions match with those found with the CANDID 16 (Gallenne et al. 2015) binary search software to within <2σ, standard deviation error. The flux ratio of the companion to the post-AGB varies between 4.1% and 5.9% of the total flux. The variations in the flux are attributed to the pulsations of the post-AGB star (period 75.46 days; Samus et al. 2017).
The post-AGB primary uniform disk diameter is not resolved, i.e., <0.5 mas. On the other hand, the uniform disk of the companion is resolved and has a ∼0.75 mas diameter size (see the Appendix, Table 5). We note that this ∼0.75 mas size is too large (∼1 au) to be the photosphere of the main-sequence companion. We infer that this resolved component around the companion is likely the accretion disk, which launches the jet found in AC Her (Bollen et al. 2022). The study on the origin of the circum-companion disk and its connection to jets is out of the scope of this paper; however, a separate report is in preparation.
3.2. Astrometric and Radial Velocity Orbital Fit
We constructed a three-dimensional astrometric orbit by combining our interferometric astrometric positions with the already published radial velocity data (Oomen et al. 2018; publicly available on VizieR) from the HERMES spectrograph(Raskin et al. 2011) on the 1.2 m Mercator telescope, La Palma.
We employed the orbital fitting tools reported in Gardner et al. (2021) to fit a binary model simultaneously to the interferometric astrometric positions and radial velocity data.
The radial velocity data are polluted with a scatter with an amplitude of ∼15 km s−1 because of irregular pulsations of the post-AGB star (Oomen et al. 2018). We scaled the astrometric uncertainties by 1.86× and radial velocity uncertainties to 6.7 km s−1 uniformly for all points so that each data set, radial velocity and interferometric astrometry, contributed a fixed  . Figure 2 shows the best-fit orbit, and Table 2 presents the best-fit seven Campbell orbital parameters. The interferometric data mostly dominate the orbital fit. We obtain a median residual to the binary astrometry fit of 29 μas.
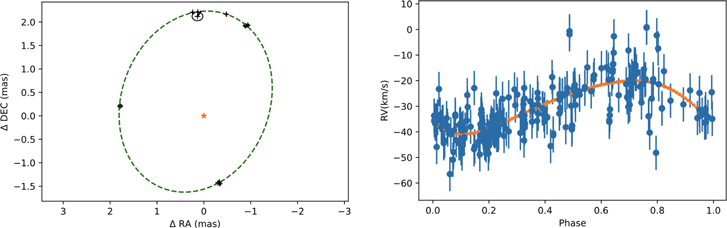
Figure 2. The best-fit relative orbit of the companion around the primary post-AGB star. Left: visual orbit of AC Her based on MIRC-X measurements at the CHARA Array. The primary post-AGB is fixed at the (0,0) position and denoted with orange “⋆” star symbol at the center. The astrometric positions and their uncertainties are denoted with black “+” and ellipse symbols. Right: radial velocity fit based on data from the HERMES spectrograph at the 1.2 m Mercator telescope. The orange color line is the best fit to the data, which are filled circled points with error bars in blue color.
Download figure:
Standard image High-resolution imageTable 2. Orbital Elements of the AC Her System Derived from Combined Interferometric Astrometry and Radial Velocity Data
| Orbital element | This work (Astrometry+RV) | Oomen et al. (2018) (RV) | Van Winckel et al. (1998) (RV) |
|---|---|---|---|
| Semimajor axis, a (mas) | 2.01 ± 0.01 | ⋯ | ⋯ |
| Inclination, i (°) | 142.9 ± 1.1 | ⋯ | ⋯ |
| Ω (°) | 155.1 ± 1.8 | ⋯ | ⋯ |
| ω1 (°) | 118.6 ± 2.0 | ⋯ | 114 ± 12 |
| T0 (MJD) | 59023.1 ± 2.2 | ⋯ | 47129 ± 35 JD |
| eccentricity, e | 0.206 ± 0.004 | 0.0 ± 0.05 | 0.12 ± 0.02 |
| Orbital period, P (days) | 1187.7 ± 0.7 | 1188.9 ± 1.2 | 1194 ± 6 |
| Mtotal (M⊙) | 2.13 ± 0.19 | 0.75 ± 0.03 | 1.8 ± 0.4 |
| M1 (M⊙) | 0.73 ± 0.13 | 0.6 (fixed) | 0.6 ± 0.2 |
| M2 (M⊙) | 1.40 ± 0.12 | 0.15 ± 0.03 | 1.2 ± 0.2 |
| K1 (km s−1) | 10.5 ± 0.5 | 10.8 ± 0.7 | 12.7 ± 0.3 |
| γ (km s−1) | −29.3 ± 0.4 | −27.0 ± 0.2 | −33 |
Note. RV stands for radial velocity. P denotes the orbital period, a the orbital semimajor axis, e the eccentricity, i the orbital inclination, T0 the time of periastron passage, K1 the semiamplitude in the radial velocity of the stellar components, and γ the velocity of the system’s center of mass. ω1 is the longitude of the periastron, measured from the ascending node of the companion, and Ω gives the longitude of the ascending node (i.e., the node where the motion of the companion is directed away from the post-AGB).
Download table as: ASCIITypeset image
The best-fit orbit solution shows the binary orbit is highly inclined, i = 1429 ± 1
1, and eccentric, e = 0.206 ± 0.004, with semimajor axis a = 2.01 ± 0.01 mas, i.e., 2.83 ± 0.08 au at the Gaia DR3 distance of 1402 ± 43 pc. Our measured orbital period P = 1187.7 ± 0.6 days is within 1σ of a previously published radial velocity orbit solution (Van Winckel et al. 1998; Oomen et al. 2018).
3.3. Dynamical Masses of the System
Using Kepler’s third law (P2 = a3/Mtotal), we obtain the system’s total dynamic mass of Mtotal = 2.13 ± 0.19 M⊙. We also computed this total mass for all previously reported distances as tabulated in Table 3. This Gaia distance was obtained using a single-star astrometric fit. The larger uncertainties in the Gaia measurements may be because of the poor astrometric fit of the data, which have a larger goodness-of-fit renormalized unit weight error (RUWE) ∼ 2.1.
Table 3. AC Her Binary System Dynamical Masses for All Reported Distances
| Source (References) | Distance (pc) | Mtotal (M⊙) | M1 (M⊙) | M2 (M⊙) |
|---|---|---|---|---|
| Hillen et al. (2015) | 1600 ± 300 | 3.1 ± 1.8 | 1.3 ± 1.1 | 1.8 ± 0.7 |
| Gaia DR2 geometric [1] | 1230 ± 44 | 1.44 ± 0.16 | 0.36 ± 0.10 | 1.08 ± 0.10 |
| Gaia DR3 geometric [2] | 1626 ± 94 | 3.3 ± 0.6 | 1.4 ± 0.4 | 1.88 ± 0.25 |
| Gaia DR3 photogeometric [2] | 1620 ± 76 | 3.2 ± 0.5 | 1.41 ± 0.31 | 1.86 ± 0.21 |
| Gaia DR3 “distance_gspphot” [3] | 1402 ± 43 | 2.11 ± 0.21 | 0.73 ± 0.14 | 1.40 ± 0.12 |
Note. [1]—Bailer-Jones et al. (2018); [2]—Bailer-Jones et al. (2021); and [3]—Gaia Collaboration et al. (2022).
Download table as: ASCIITypeset image
Table 4. Observation Log
| UT Date | Telescopes Combined | Calibrators |
|---|---|---|
| 2019-03-25 | 4T (No W1 and W2) | HD 169573 |
| 2019-06-07 | 6T | HD 169573 |
| 2019-08-13 | 6T | HD 174414, HD 181603 |
| 2019-08-14 | 6T | HD 166842, HD 178032, HD 184275 |
| 2020-07-29 | 6T | HD 174414, HD 178798 |
| 2020-07-30 | 6T | HD 166842, HD 163506, HD 178798 |
| 2020-07-31 | 6T | HD 166842, HD 169573 |
| 2021-07-17 | 6T | HD 161268, HD 169573, HD 166730 |
| 2022-06-08 | 6T | HD 184275, HD 194403 |
| 2022-06-17 | 6T | HD 154942, HD 167132 |
Note. CHARA MIRC-X observations of the AC Her binary system with observing configurations and calibrators. The UT date indicates the universal time at the beginning of the data recording.
Download table as: ASCIITypeset image
Table 5. The Main-sequence Companion Star Astrometry (Separation ρ and PA θ), Flux (fcomp), and Uniform Diameter (UDcomp) Derived from the MIRC-X Epochs
| UT Date | MJD | ρ (mas) | θ (°) | fcomp (%) | UDcomp (mas) | fstar |
|---|---|---|---|---|---|---|
| 2019-03-25 | 58567.4765 | 2.13 ± 0.10 | 3.7 ± 3.2 | 5.8 ± 0.2 | 0.7 ± 0.2 | 86.8 ± 0.2 |
| 2019-06-07 | 58641.3992 | 2.22 ± 0.02 | 347.5 ± 0.5 | 5.1 ± 0.2 | 0.7 ± 0.3 | 87.5 ± 0.1 |
| 2019-08-13 | 58708.2094 | 2.12 ± 0.04 | 335.2 ± 1.0 | 4.7 ± 0.2 | 0.8 ± 0.3 | 87.4 ± 0.3 |
| 2019-08-14 | 58709.2368 | 2.15 ± 0.03 | 334.1 ± 0.8 | 4.5 ± 0.2 | 0.8 ± 0.2 | 82.1 ± 0.2 |
| 2020-07-29 | 59059.2516 | 1.46 ± 0.01 | 191.9 ± 0.8 | 4.5 ± 0.3 | 0.8 ± 0.2 | 86.1 ± 0.1 |
| 2020-07-30 | 59060.2374 | 1.49 ± 0.04 | 193.4 ± 0.8 | 4.5 ± 0.1 | 0.8 ± 0.2 | 84.6 ± 0.3 |
| 2020-07-31 | 59061.1899 | 1.45 ± 0.02 | 193.3 ± 1.0 | 4.2 ± 0.3 | 0.7 ± 0.3 | 84.5 ± 0.1 |
| 2021-07-17 | 59412.2863 | 1.80 ± 0.05 | 83.3 ± 1.1 | 4.1 ± 0.2 | 0.7 ± 0.2 | 87.8 ± 0.2 |
| 2022-06-08 | 59738.3842 | 2.22 ± 0.02 | 6.2 ± 0.5 | 5.1 ± 0.2 | 0.8 ± 0.2 | 84.7 ± 0.1 |
| 2022-06-17 | 59747.2839 | 2.22 ± 0.02 | 3.3 ± 0.4 | 6.0 ± 0.2 | 0.7 ± 0.2 | 84.5 ± 0.1 |
Note. The PA is measured east of north for the vector from the post-AGB star to the main-sequence star. The primary post-AGB star is unresolved with size UDstar < 0.5 mas with flux (fstar). UT indicates the universal time of the observations.
Download table as: ASCIITypeset image
We measure the model-independent individual masses by substituting the binary orbital period (P), eccentricity (e), inclination (i), semiamplitude of the radial velocity of the stellar components (K1) in the binary mass function (e.g., Oomen et al. 2018):

From Equation (1), we get individual masses for the companion (M2 = 1.40 ± 0.12 M⊙) and post-AGB star (M1 = Mtotal − M2 = 0.73 ± 0.13 M⊙).
This mass estimate of the post-AGB star compares well with typical white dwarf masses. Considering the mass of the companion (M2 = 1.40 ± 0.12 M⊙), we corroborate that the companion is most likely a main-sequence star.
4. Discussion on the Origin of the Disk Cavity
The disk around AC Her is the best-studied example of a post-AGB disk with such a large inner rim cavity  au (Hillen et al. 2015). This inner rim size is the result of radiative transfer modeling taking into account the angular size derived from MIDI observations (Hillen et al. 2015).
Several processes can influence the size of the inner disk cavity, and in the next section we evaluate these mechanisms.
4.1. Dust Sublimation
First of all, dust grains sublimate when they are too close to the star, which creates a disk cavity that is indeed observed in the near-infrared disks around young stars (e.g., Monnier & Millan-Gabet 2002; Dullemond & Monnier 2010; Lazareff et al. 2017, 2017).
Kluska et al. (2019) compared the inner rim radii measured at H-band wavelengths of several post-AGB objects (23) to the theoretical dust sublimation radii, similar to other analyses of young stellar objects. Their comparison of the size–luminosity relation revealed that for the most of the post-AGB disks, the inner rim size is indeed ruled by dust sublimation (Figure 4 in Kluska et al. 2019). The remaining objects, which do not follow the dust sublimation rule are suspected to have transition disks like in AC Her.
The theoretical sublimation radius for the AC Her disk was computed by previous authors, who found a maximum of value of 5 au (Hillen et al. 2015; Kluska et al. 2019, 2022). Here, we estimate the upper bound of Rsubli from the size–luminosity trend in Kluska et al. (2019), using conservative luminosity estimates.
The determination of the luminosity is very dependent on the the distance estimate as well as on the total reddening and the latter is difficult to quantify for pulsating stars with a large amplitude in which part of the reddening can be circumstellar. We integrate the dereddened photosphere (E(B − V) = 0.37) and by assuming the Gaia DR3 distance we obtain L* = 4600 L⊙. This is larger than what the period–luminosity–color relation would give, which is L* = 2475 L⊙ (Bódi & Kiss 2019), but rather low in comparison to the luminosity expected for a white dwarf of 0.7 M⊙ (see Figure 11 of Miller Bertolami 2016), which is around 104 L⊙.
For L* = 104 L⊙, we get Rsubli = 9 ± 1 au by cross-matching with the size–luminosity relation in Figure 4 of Kluska et al. (2019). The Rsubli = 5 au value from Hillen et al. (2015) and the upper-limit estimation ∼9 au are significantly smaller (∼3 to ∼5 times) than the measured lower-bound cavity radius (26 au), ruling out dust sublimation as the origin of the disk cavity.
4.2. Dynamical Truncation of the Disk by the Binary
Another mechanism that might truncate the disk is dynamical interaction with the inner binary. Resonance torques exerted by the inner binary push the disk farther out, and the disk’s viscous evolution tries to close this cavity (Artymowicz & Lubow 1994). The cavity size increases with binary eccentricity and binary mass ratio q = M1/M2, and decreases with disk viscosity. The radius size of this cavity (the inner rim radius) is estimated to be between 1 to 4 times the size of the semimajor axis of the binary (Artymowicz & Lubow 1994; Hirsh et al. 2020). For AC Her, we found in Section 3 an eccentricity of e = 0.2 and a mass ratio q of 0.5. From Figure 9 of Hirsh et al. (2020), we estimate the cavity radius to be 3.2 times larger than the binary semimajor axis. As the semimajor axis is a ∼ 2 mas, we estimate the truncation radius Rtrunc to be 6.4 mas, which is ∼9 au for a distance of 1.4 kpc. Such a radius is still ∼3× smaller than the observed lower bound cavity radius (∼26 au). Therefore, dynamical truncation is not sufficient either to explain the observed cavity size.
4.3. Photoevaporation
As discussed in Kluska et al. (2022), photoevaporation is unlikely to create disk cavities as there is no evidence for high-energy photons in the system: the post-AGB star is too cool, with an effective temperature ranging from Teff = 5225 ± 125 to 5800 ± 250 K (Van Winckel et al. 1998; Hillen et al. 2015; Kluska et al. 2022).
4.4. Presence of a Third (Planetary) Body
Figure 3 describes the dust sublimation and binary truncation radii in the context of the observed disk cavity and our current understanding of the system’s configuration. The presence of (sub)planetary-mass bodies is the most promising explanation for cavities observed in transition disks around young stars (Pinilla et al. 2012), especially since the detections of planets in the transition disks of PDS 70 and LkCa 15 (Sallum et al. 2015; Keppler et al. 2018; Müller et al. 2018; Haffert et al. 2019; Benisty et al. 2021) were reported. A planet of sufficient mass can disturb the disk by exchanging angular momentum with it. This will create a gap or cavity in the disk resulting in a pressure maximum outside the planetary orbit. Such a pressure gradient is thought to be very efficient in trapping dust grains while letting the gas accrete onto the star(s) (Pinilla et al. 2012; Zhu et al. 2013; Pinilla et al. 2016). It was shown that such a process is efficient in trapping the dust outside the orbit of the planet (e.g., Francis & van der Marel 2020).
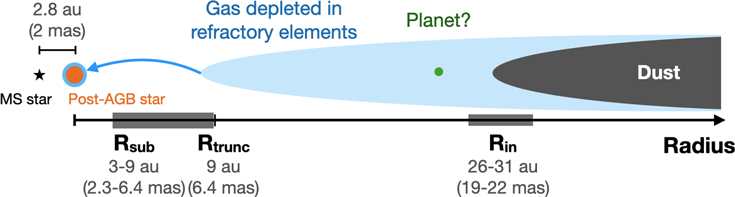
Figure 3. Sketch of the AC Her system including the radial sizes of the different disk truncation mechanisms at work compared to the derived inner binary orbit. This sketch is adapted from Kluska et al. (2022). The orbital separation and the expected truncation and dust sublimation radii are derived in this work. The disk inner rim radius is from Hillen et al. (2015). Note that the angular scales are independent of luminosity, while the translation to physical sizes is distant dependent.
Download figure:
Standard image High-resolution imageThe surface of the post-AGB star of this system is also depleted in refractory elements, pointing toward a mechanism which traps dust in the disk while also creating a gap (Kluska et al. 2022). We therefore conclude that a massive planet is the most likely scenario to date to explain both the cavity and the depletion of refractory elements in AC Her.
With our CHARA Array observations of AC Her, we are able to put an upper limit of detecting a point source inside this cavity. We used the PMOIRED detectionLimit feature of removing the detected companion and injecting an artificial companion with a random flux and position in the field of view and measure the flux leading to a 3σ detection (Gallenne et al. 2015). Figure 4 shows the detection level as a function of the position of the third component (left) and of its relative brightness so that it would have been detected at the 3σ level. Here, the median third star has a 3σ detection limit of 6.0 mag. For AC Her, PMOIRED could have detected the tertiary component if it would be brighter than the contrast difference of ΔH = 6 with respect to the post-AGB star. Such contrast puts a limit of ∼9 L⊙ on the luminosity of the putative companion, which is way above the planetary luminosity regime. We conclude that we cannot provide a stringent constraint on the presence of a third companion in the disk cavity with these observations.
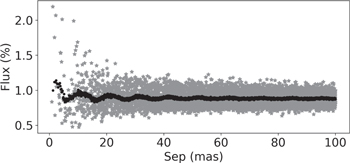
Figure 4. Derived detection limits for epoch 2021 July 8 as a function of radius from the central star. The flux is a percentage of the primary post-AGB star.
Download figure:
Standard image High-resolution image5. Summary
In this study, we have presented CHARA/MIRC-X observations of AC Her that resolve the inner binary system by exploiting submilliarcsecond angular resolutions in the near-infrared.
We derived the first three-dimensional orbital solution for a post-AGB binary system. Subsequently, we constrained the dynamical system masses of the post-AGB primary (0.73 ± 0.13 M⊙) and companion (1.40 ± 0.12 M⊙).
We computed the theoretical sublimation radius Rsubli using conservative luminosity estimates and the binary truncation disk cavity radius Rtrunc using the binary orbital parameters and then compared both of these values with the previously measured inner disk radius. We found that neither dust sublimation nor binary truncation explains the large disk cavity. This further strengthens the hypothesis that a planet might be clearing the disk cavity and might be responsible for the observed depletion of refractory elements on the post-AGB star. However, our observations cannot reach enough contrast to set stringent constraints on the presence or mass of a third companion in the cavity.
We are planning to study this system with CHARA/MYSTIC K-band observations (Monnier et al. 2018; Setterholm et al. 2022). The K-band observations probing the dust can help further constrain the circum-companion emission (see Section 3.1).
High-angular-resolution observations in the thermal infrared (e.g., VLTI/MATISSE) and millimeter wavelengths (e.g., with the Atacama Large Millimeter/submillimeter Array) are crucial to study the disk structure in detail and further probe the planetary hypothesis by revealing the detailed structure of the inner disk and the cavity.
Acknowledgments
We thank the anonymous referee for their constructive comments and suggestions that substantially improved the clarity of the paper. This work is based upon observations obtained with the Georgia State University Center for High Angular Resolution Astronomy Array at Mount Wilson Observatory. The CHARA Array is supported by the National Science Foundation under Grant No. AST-1636624, AST-1715788, and AST-2034336. Institutional support has been provided by the GSU College of Arts and Sciences and the GSU Office of the Vice President for Research and Economic Development. MIRC-X received funding from the European Research Council (ERC) under the European Union’s Horizon 2020 research and innovation program (“ImagePlanetFormDiscs,” Grant Agreement No. 639889). J.D.M. acknowledges funding for the development of MIRC- X (NASA-XRP NNX16AD43G, NSF-AST 1909165) and MYSTIC (NSF-ATI 1506540, NSF-AST 1909165). N.A., S.K., and C.D. acknowledge funding from the same ERC grant and from an STFC University of Exeter PATT travel grant (ST/S005293/1). N.A. acknowledges support from the Steward Observatory Fellowship in Instrumentation and Technology Development. J.K. acknowledges support from FWO under the senior postdoctoral fellowship (1281121N). S.K. acknowledges support from an ERC Consolidator Grant (“GAIA-BIFROST,” Grant Agreement No. 101003096) and STFC Consolidated Grant (ST/V000721/1). L.S. acknowledges a grant from the Marcos Moshinsky foundation. Some of the time at the CHARA Array was granted through the NOIRLab community access program proposal id: 2020A-0274 and 2021A-0267 (PI: N. Anugu). This research has made use of the Jean-Marie Mariotti Center SearchCal service. 17 This research has made use of the Jean-Marie Mariotti Center Aspro service. 18 This work has made use of data from the European Space Agency (ESA) mission Gaia (https://www.cosmos.esa.int/gaia), processed by the Gaia Data Processing and Analysis Consortium (DPAC; https://www.cosmos.esa.int/web/gaia/dpac/consortium). Funding for the DPAC has been provided by national institutions, in particular, the institutions participating in the Gaia Multilateral Agreement.
Facilities: CHARA Array (MIRC-X) - and Gaia. -
Software: CANDID (Gallenne et al. 2015), PMOIRED (Mérand 2022b), and Aspro.
Appendix: Observations and Derived Astrometry
Table 4 lists the CHARA/MIRC-X observing configurations and calibrators list. The angular diameters of the calibrators are adopted from the vizier II/346/jsdc_v2 catalog. Figure 5 shows the data and fitting residuals for the geometrical model described in Section 3.1. Table 5 lists the astrometric positions, fluxes, and diameters derived from the PMOIRED geometrical modeling.
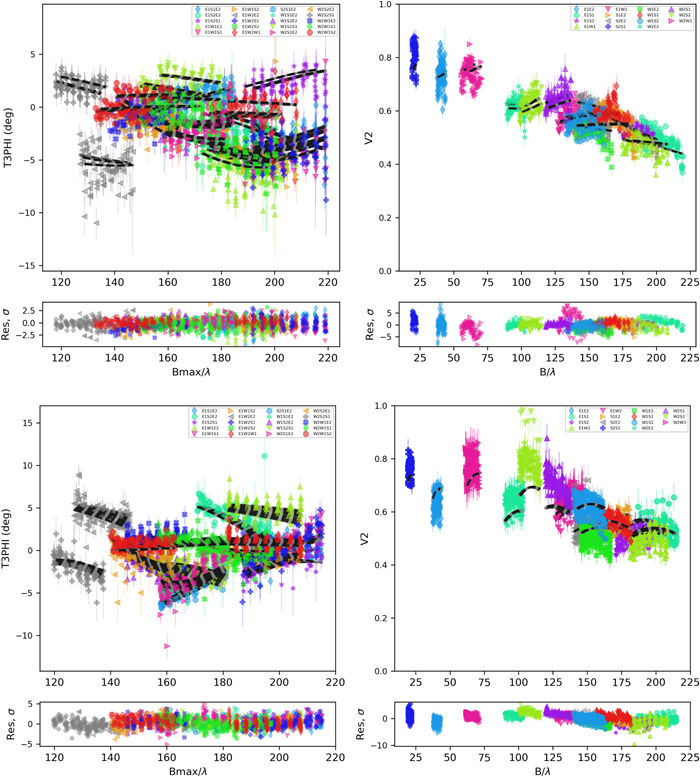
Figure 5. The geometrical fit residuals to the interferometric observables recorded for AC Her with CHARA/MIRC-X on UT 2020 July 31 and 2022 June 8. The squared visibilities and closure phases are denoted with V2 and T3PHI, respectively. The bottom panels are the best-fit residuals in σ. The solid black line is the model fit, and the other colors are the observed data. The bottom panels are the best-fit residuals of T3PHI and V2. V2 is a measure if the object is spatially resolved, i.e., decreasing V2 with spatial frequency (B/λ), meaning that the observed object is spatially resolved. A nonzero closure phase indicates the source is not point symmetric, which is caused by binary and disk signals. Colors are for different baselines/closure triangles.
Download figure:
Standard image High-resolution imageThe uncertainties of the geometrical model parameters were determined using the bootstrap fitting algorithm available in PMOIRED. This algorithm estimates realistic uncertainties by doing a bootstrap on the data and multiple fits to estimate the scatter of the fitted parameters and mitigate the effects of correlated data. We used 5000 multiple fits. The bootstrap fits are filtered using a recursive sigma clipping algorithm. Figure 6 presents a corner plot where we used 4.5 sigma clipping.
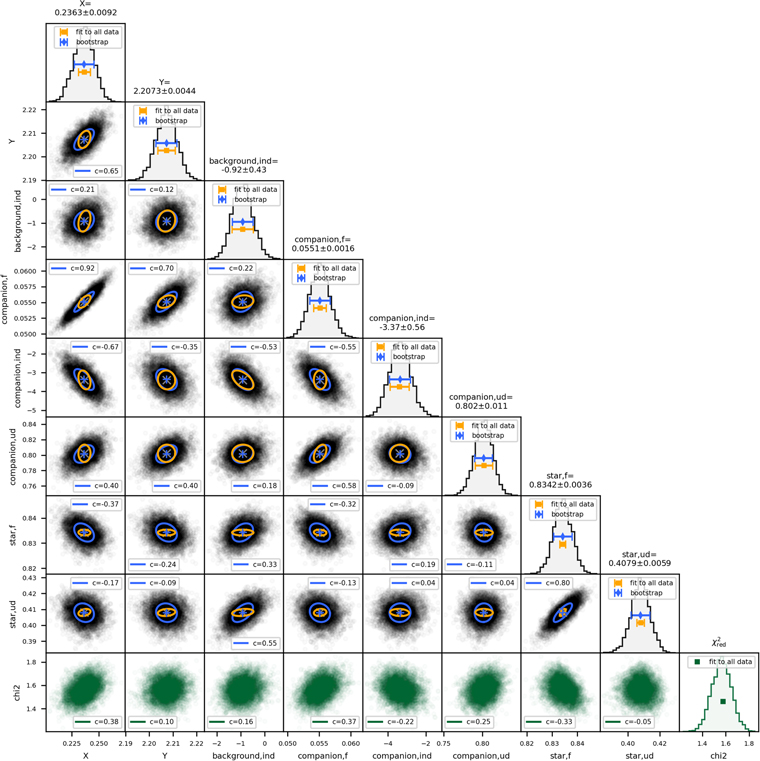
Figure 6. Estimation of the uncertainties by mitigating correlated systematic using the bootstrap fitting for the 2022 Jun 08 epoch. star,ud and star,f are the primary post-AGB star uniform disk diameter in mas and its flux. companion,ud, companion,f, and companion,ind are the companion star uniform disk diameter in milliarcseconds, its flux, and its spectral index. X and Y are the astrometric differential positions of the companion. background,ind is the index of the background emission.
Download figure:
Standard image High-resolution imageFootnotes
- 13
The main-sequence companion is too faint compared to the primary post-AGB to be able to derive abundances; however, we assume both the primary and the companion accrete the depleted gas from the circumbinary disk.
- 14
- 15
- 16
- 17
available at http://www.jmmc.fr/searchcal_page.htm
- 18
Available at http://www.jmmc.fr/aspro