Abstract
X-shaped radio galaxies (XRGs) are those that exhibit two pairs of unaligned radio lobes (main radio lobes and wings). One of the promising models for the peculiar morphology is jet reorientation. To clarify this, we conducted a 5 GHz observation with the European VLBI Network (EVN) of XRG J0725+5835, which resembles the archetypal binary active galactic nuclei (AGNs) 0402+379 in radio morphology, but it is larger in angular size. In our observation, two milliarcsecond-scale radio components with nonthermal radio emission are detected. Each of them coincides with an optical counterpart with similar photometric redshift and (optical and infrared) magnitude, corresponding to dual active nuclei. Furthermore, with the improved Very Large Array (VLA) images, we find a bridge between the two radio cores and a jet bending in the region surrounding the companion galaxy. This further supports the interplay between the main and companion galaxies. In addition, we also report the discovery of an arcsecond-scale jet in the companion. Given the projected separation of ∼100 kpc between the main and companion galaxies, XRG J0725+5835 is likely associated with a dual jetted-AGN system. In both EVN and VLA observations, we find signatures that the jet is changing its direction, which is likely responsible for the X-shaped morphology. For the origin of jet reorientation, several scenarios are discussed.
Original content from this work may be used under the terms of the Creative Commons Attribution 4.0 licence. Any further distribution of this work must maintain attribution to the author(s) and the title of the work, journal citation and DOI.
1. Introduction
Astronomical observations show that supermassive black holes (SMBHs) are located at the center of most massive galaxies (e.g., Kormendy & Ho 2013). According to the hierarchical model of structure formation, galaxy mergers occur frequently in the early Universe (Volonteri et al. 2003), which naturally results in two SMBHs that sink to the center of a newly formed galaxy due to dynamical friction and form a binary system. Moreover, galaxy mergers can efficiently drive gas inflow to fuel the SMBHs, thus stimulating the active galactic nuclei (AGNs) and nuclear starburst (Hopkins et al. 2006; Di Matteo et al. 2007; Montuori et al. 2010). To establish a complete view of galaxy merger evolution, one needs to further explore, e.g., how the strength of star formation, AGN accretion, and feedback evolve with the merger sequence. Even though dual and binary AGN candidates with separations ranging from 100 kpc down to scales of a few parsec have been detected (Komossa et al. 2003; Bianchi et al. 2008; Comerford et al. 2011; Fu et al. 2011; Koss et al. 2011; Deane et al. 2014; Woo et al. 2014; Fu et al. 2015; Yang et al. 2017; Husemann et al. 2018; Liu et al. 2018; Goulding et al. 2019; Silverman et al. 2020), the number of confirmed dual and binary AGNs is still smaller than predicted (An et al. 2018). One reason for this deficiency is the lack of effective candidates. Here we define dual AGNs as gravitationally interacting systems with a separation smaller than ≈100 kpc.
Under suitable conditions, an AGN can launch a pair of relativistic jets of nonthermal radio emission with dimensions that can evolve up to megaparsecs (e.g., Heckman & Best 2014; Dabhade et al. 2017). Ekers et al. (1978) noted that a symmetric jet distortion in galaxy NGC 326 can be caused by jet precession, while further studies indicate that a more rapid change in jet direction is required to form the nearly orthogonal distortion in NGC 326 (e.g., Murgia et al. 2001) and other morphologically similar sources (i.e., X-shaped radio galaxies, XRGs; Dennett-Thorpe et al. 2002). There are two scenarios for the jet reorientation: jet precession due to binary black hole evolution (Bogdanović et al. 2007; Zhang et al. 2007; Krause et al. 2019; Horton et al. 2020), and the sudden spin-flip after binary black hole coalescence (Merritt & Ekers 2002). On the other hand, backflowing plasma from the jet may also be warped as the wing-shape in XRGs (Rossi et al. 2017; Cotton et al. 2020).
This work focuses on the XRGs. Their origin is still debated (see Yang et al. 2019 and references therein). The jet precession model requires that binary black holes are located on the parsec scale (Krause et al. 2019), but this lacks observational support. Interestingly, we find observational evidence that several XRGs are in kiloparsec-scale galaxy pairs (e.g., Battistini et al. 1980; Leahy & Williams 1984; Murgia et al. 2001; Madrid et al. 2006). A study of ∼100 radio sources associated with dumbbell galaxies, i.e., two nearly equally bright elliptical galaxies within a common envelope, has revealed remarkably distorted radio structures in about a dozen of them (Wirth et al. 1982). Currently, there is enough observational evidence to show that galaxy pairs are associated with jet distortion (e.g., Parma et al. 1991; Borne & Colina 1993; Hardcastle et al. 2019), therefore, it occasionally forms X-shaped structures.
J0725+5835 was selected as an X-shaped radio galaxy (Cheung 2007) because the directions of its primary and secondary jets are almost orthogonal. What caught our attention is its morphology, which is similar to that of the parsec-scale binary AGN 0402+379 (Rodriguez et al. 2006). A radio core at the symmetric center of J0725+5835 drives the large-scale radio jet, while the compact (at arcsecond scales) radio component to its northeast is likely a massive neighboring galaxy that could affect the jet shape of the main radio galaxy. In the following, we refer to the radio core of the primary jet as core B and to the compact radio component in the northeast as core A (see Figure 1). Cores A and B have counterparts in the Panoramic Survey Telescope and Rapid Response System (Pan-STARRS; see the Pan-STARRS1 i-band image in Figure 1) and show a similar photometric redshift z ∼ 0.42 (see Section 4.1). In this paper, we present the results of observations of the XRG J0725+5835 by the European Very Long Baseline Interferometry (VLBI) Network (EVN) and the Jansky Very Large Array (VLA).
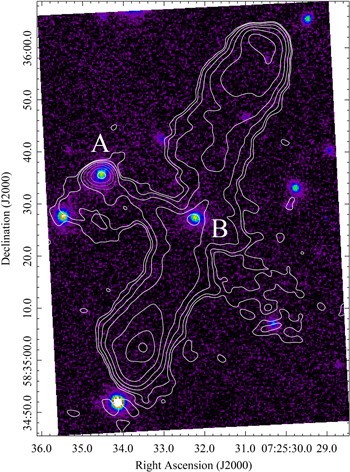
Figure 1. Radio contours (white lines) of J0725+5835 overlaid on the Pan-STARRS1 i-band image (pseudo-color image). The radio contours are from the naturally weighted VLA S-band (3 GHz) image that was obtained on 2016 May 28 with the B-array. The contours increase in steps of (1.25, 2, 4, 8, etc.) × 0.04 mJy beam−1.
Download figure:
Standard image High-resolution imageThis paper is organized as follows: we describe the EVN and VLA observations and the data reduction in Section 2 and present the imaging results for J0725+5835 in Section 3. We discuss the interplay between cores A and B, jet reorientation, and simultaneous scenarios in Section 4. Throughout the paper, a standard ΛCDM cosmology is used with H0 = 71 km s−1 Mpc−1, Ωm = 0.27, and ΩΛ = 0.73.
2. Observations and Data Reduction
2.1. VLBI Observation and Data Reduction
We observed J0725+5835 on 2017 November 14 with 10 antennas of the EVN at C- band (5 GHz; the project code is RSY06; PI: Xiaolong Yang). The total observation time is 2 h with a data recording rate of 2 Gbps. The observation was performed in phase-referencing mode, using 0724+571 (R.A. = 07h28m496317, decl. = 57°01′24
374) as the phase-reference calibrator.
We calibrated the EVN data in the Astronomical Image Processing System (AIPS), a software package developed by the National Radio Astronomy Observatory (NRAO) of the U.S. (Greisen 2003), following the standard procedure. A priori amplitude calibration was performed using the system temperatures and antenna gain curves provided by each station. The Earth orientation parameters were obtained and calibrated using the measurements from the U.S. Naval Observatory database, and the ionospheric dispersive delays were corrected from a map of the total electron content provided by the Crustal Dynamics Data Information System (CDDIS) of NASA. 11 The opacity and parallactic angles were also corrected using the auxiliary files attached to the data. The delay in the visibility phase was solved using the phase-reference calibrator 0724+571. A global fringe-fitting on the phase-referencing calibrator 0724+571 was performed by taking the calibrator model to solve miscellaneous phase delays of the target. The target source data were exported to DIFMAP (Shepherd 1997) for self-calibration and model fitting. In particular, we take the radio coordinate from the VLA B-array S band (see Section 2.2) as a reference for core A in our VLBI data reduction, which proved to be sufficiently accurate (see Table 1). No self-calibration was applied to the target source because it is too weak (∼7σ and 13σ for cores A and B, respectively). The final image was created using natural weighting; see Figure 2.
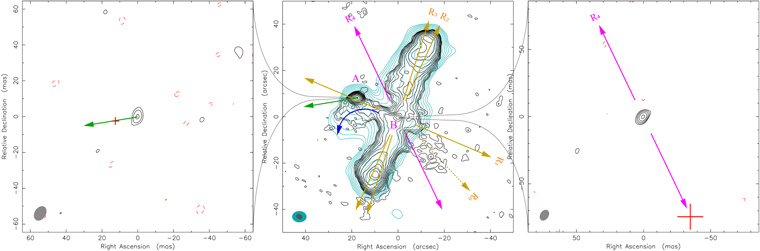
Figure 2. Left and right panel: Naturally weighted EVN 5 GHz image of cores A and B, respectively. Middle panel: Overlapped contours between VLA B-array L- (cyan) and S band (black). The corresponding beam is shown in the lower left corner of each panel. The red crosses in the left and right panels show the astrometric position obtained from the VLA B-array S-band data (see Table 1). The arrows are defined as follows. R0 is the direction of fossil radio emission. R1 indicates the wings. R2 shows the direction of lobes. R3 shows the direction from the core to the tip of hotspots, and the green arrow and R4 are obtained from the left and right panel, respectively. They indicate the direction from the VLBI to the VLA position.
Download figure:
Standard image High-resolution imageTable 1. Summary of the VLA and EVN Imaging and Circular Gaussian Fitting Results of J0725+5835
| Facility | ν | α | σα | δ | σδ | Si | θ | logTb | Sp |
|---|---|---|---|---|---|---|---|---|---|
| (GHz) | (J2000) | (mas) | (J2000) | (mas) | (mJy) | (mas) | (K) | (mJy beam−1) | |
| (1) | (2) | (3) | (4) | (5) | (6) | (7) | (8) | (9) | (10) |
| Core A | |||||||||
| VLA A-array | 1.5 | 07h25m34 | 7.27 | +58°35′35 | 7.27 | 3.865 ± 0.178 | 3.590 ± 0.198 | ||
| VLA B-array | 3 | 07h25m34 | 1.88 | +58°35′35 | 1.88 | 2.822 ± 0.036 | 3.050 ± 0.027 | ||
| EVN | 5 | 07h25m34 | 0.34 | +58°35′35 | 0.36 | 0.076 ± 0.021 | ≲1.84 | ≳6.37 | 0.084 ± 0.024 |
| Core B | |||||||||
| VLA A-array | 1.5 | 07h25m32 | 62 | +58°35′27 | 62 | 0.973 ± 0.174 | 0.690 ± 0.198 | ||
| VLA B-array | 3 | 07h25m32 | 9.28 | +58°35′27 | 9.28 | 1.196 ± 0.026 | 0.913 ± 0.027 | ||
| EVN | 5 | 07h25m32 | 0.19 | +58°35′27 | 0.15 | 0.227 ± 0.033 | ≲1.23 | ≳7.28 | 0.280 ± 0.038 |
Note. Columns give (1) the source name/facilities, (2) the frequency, (36) the J2000 positions and errors, (7) the total flux density, (8) the source angular size, (9) the brightness temperature, and (10) the peak brightness.
Download table as: ASCIITypeset image
2.2. VLA Observation and Data Reduction
This source is a part of the VLA L-(1.4 GHz) and S-band (3 GHz) surveys of 89 XRGs (Roberts et al. 2018). In this work, we have retrieved two VLA B-array data sets at L and S band (project code 16A-220; PI: Lakshmi Saripalli) and one VLA A-array data set at L band (project code 16B-023; PI: Lakshmi Saripalli) from the NRAO Science Data Archive.
12
The VLA B-array L-band observation was performed on 2016 May 29 with a bandwidth of 1 GHz and a total on-source time of 4.82 minutes, while the S-band observation was made on 2016 May 28 with a bandwidth of 2 GHz and a total on-source time of 4.74 minutes. The VLA A-array L-band observation was performed on 2016 December 27 with a bandwidth of 1 GHz and a total on-source time of 3.57 minutes. All observations were scheduled in full-polarization mode, and used J0713+4349 (R.A. =07h 13m38164, decl. = + 43°49′17
21) as the secondary flux density calibrator. Although the data have been published by Roberts et al. (2018) and Saripalli & Roberts (2018), in order to ensure uniformity in the analysis across all the parameters, we have rereduced the data using the Common Astronomy Software Application (CASA v5.1.1; McMullin et al. 2007).
Our data analysis followed the standard routines described in the CASA cookbook. 13 We used 3C 138 and 3C 147 as the primary flux calibrators for the VLA B-array and A-array data sets, respectively, and adopted the flux density standards “Perley-Butler 2017” (Perley & Butler 2017) to set the overall flux density scale; after this, we bootstrapped to the secondary flux density calibrator (J0713+4349) and the target. Antenna delay and bandpass corrections were also determined by fringe-fitting the visibilities. Furthermore, J0713+4349 was also used as a phase calibrator in the observations. We determined the complex gains from the phase calibrator and applied them to the target. We also performed an ionospheric correction using the data obtained from the CDDIS archive. Deconvolution, self-calibration, and model fitting were performed in the DIFMAP software package. For the good uv-coverage of the VLA observations and the high signal-to-noise ratio (S/N > 9), the VLA data allowed self-calibration. This was initially performed only on phase, and subsequently on both phase and amplitude when we achieved a good model. Natural weighting was used to create the final image.
3. Results
In Figure 3 we show the VLA B-array images obtained at L and S band and the VLA A-array image at L band. In the B-array L-band observation, we obtained a synthesized beam size of 624 × 4
83 at a position angle of 89
6, while in the A-array L-band observation, we obtained a synthesized beam size of 1
83 × 1
21 at a position angle of 78
1. In the VLA B-array S-band observation, we obtained a synthesized beam size of 2
83 × 2
13 at a position angle of 61
5. We perform a two-dimensional Gaussian model fitting for the VLA A-array L-band and B-array S-band data, and the results are listed in Table 1, where the uncertainties of the integrated flux density and peak flux density are estimated using the method described by Yang et al. (2020). In our EVN observation, cores A and B were both detected at 4.92 GHz (see Figure 2). The peak flux densities of A and B are 0.084 ± 0.024 and 0.280 ± 0.038 mJy beam−1, yielding an S/N of 6.8 and 13.3, respectively. For the EVN data, two-dimensional Gaussian models were used to fit the visibility data for each target to obtain the integrated flux density and size of the Gaussian components (full width at half maximum, FWHM). The model-fitting results are listed in Table 1. For the VLA data, we fit two-dimensional Gaussian models to cores A and B only to obtain their integrated flux densities of 3.865 ± 0.178 and 0.973 ± 0.174 mJy at 1.54 GHz (VLA A-array), and 2.822 ± 0.036 and 1.196 ± 0.026 mJy at 3 GHz (VLA B-array), respectively. By combining the radio flux densities at different frequencies, we can obtain the spectral indices (S ∝ ν+α
) of cores A and B as −0.47 ± 0.07 and +0.30 ± 0.27, respectively.
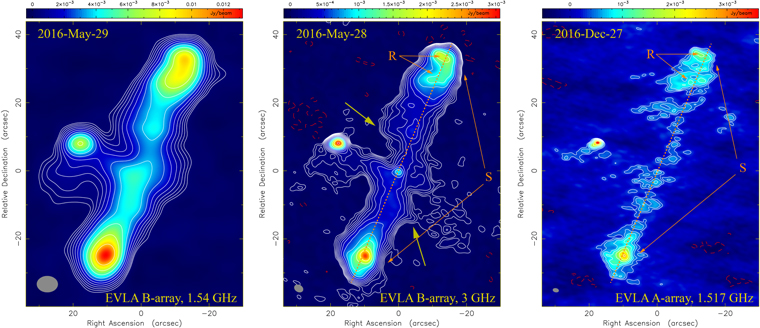
Figure 3. Naturally weighted VLA images of J0725+5835. Left panel: L-band (1.54 GHz) image obtained on 2016 May 29 with the B-array. Middle panel: S-band (3 GHz) image obtained on 2016 May 28 with the B-array. Right panel: L-band (1.51 GHz) image obtained on 2016 December 27 with the A-array. The contours increase in steps of (−1, 1, 1.41, 2, 2.83, 4, etc.) × 3σ, where the 1σ root-mean-square noise levels are 0.103, 0.015, and 0.110 mJy beam−1 for the left, middle, and right panels, respectively. In the lower left corner of each panel, the gray ellipse illustrates the synthesized beam for each band. The corresponding radio flux density scale is linked with a color map in each color bar. R: Wide terminal hotspots and ring-like structure on the northern side, and the southern hotspot is not at the edge of its lobe. S: Northern hotspot on the opposite side of the lobe as the southern hotspot. The yellow arrows show the bumps.
Download figure:
Standard image High-resolution imageBy fitting two-dimensional Gaussian models to the EVN data, we can estimate the brightness temperatures using the formula (e.g., Ulvestad et al. 2005)

where Si is the integrated flux density of each Gaussian model component in mJy (Column 6 of Table 1), θ is the FWHM of the Gaussian model in mas (Column 7 of Table 1), ν is the observing frequency in GHz, and z is the redshift; here we used an averaged photometric redshift of z = 0.42 (see Section 4.1) for cores A and B. The estimated 5 GHz brightness temperatures are listed in Column 8 of Table 1. Because the measured component sizes are only upper limits, the radio brightness temperatures should be considered as lower limits. The brightness temperatures for cores A and B are 106.37 and 107.28 K, respectively, consistent with a nonthermal origin for the milliarcsecond-scale radio emission.
In the phase-referenced EVN observation, the astrometric accuracy can be measured by considering the positional uncertainty of the phase calibrator 0724+571 (σp = 0.14 mas), the errors in phase-transferring from calibrator to target (σpr,α = 0.035 mas and σpr, δ = 0.117 mas; Pradel et al. 2006), and the rms error of target. The rms error of the target can be estimated as θFWHM/2S/N, where θFWHM is the FWHM of the beam and S/N is the signal-to-noise ratio. For the VLA observations, only the rms astrometric error is considered.
4. Discussion
4.1. Interplay between A and B
The EVN detection of compact radio cores with high brightness temperatures (>106 K) and flat radio spectra (α > −0.5; the spectral index of core A marginally satisfies the criteria, but see Figure 5) supports radio-frequency active AGNs located at both galactic nuclei in A and B. The Dark Energy Camera Legacy Survey (DECaLS; Dey et al. 2019) measured a photometric redshift of 0.399 ± 0.057 and 0.442 ± 0.028 for cores A and B, respectively. The similar redshifts of A and B support the possibility that they are in a close-pair system.
Because we have no spectroscopic redshift measurements for this source, we checked the radio properties to further explore the features supporting an interplay between A and B. Clearly, the radio bridge between cores A and B, as well as the deflection of the eastern radio outflow (jet relics) in the region of core A (see the blue arrow in the middle panel of Figure 2) both indicate an interplay between cores A and B. Again, the radio structure around core A is unlikely to stem from itself alone, because an arcsecond-scale jet is found in both VLA A-array L-band and B-array S-band images (see Figure 4), and shows a different extension. Additional evidence of the radio bridge between A and B comes from the radio spectral index map (Figure 5), which shows a continuous distribution between A and B. Furthermore, the interaction between the radio outflow and core A may also be inferred from the enhanced polarization in the circum-A region (supplementary data of Roberts et al. 2018). In the case here, the explanation for the deflection of the radio outflow is straightforward: it could be a combined effect of galactic ram pressure (Fiedler & Henriksen 1984), density gradients (Smith 1984), or an oblique magnetic field (Koide 1997; Chibueze et al. 2021) from core A. Because core A is radio-frequency active, it is reasonable to assume that multiple mechanisms are at play.
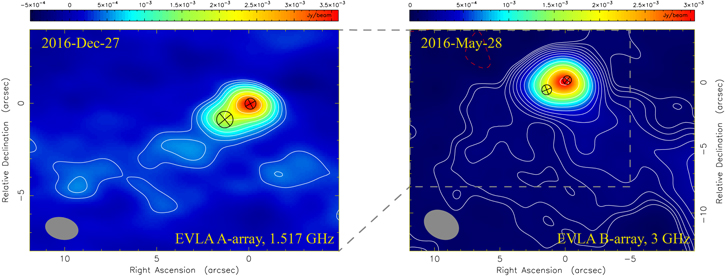
Figure 4. VLA images of core A. The left panel shows the L-band (1.51 GHz) image obtained on 2016 December 27 with the A-array, while the right panel shows the S-band (3 GHz) image obtained on 2016 May 28 with the B-array. The contours and root-mean-square noise are the same as in the corresponding image of Figure 3. In both panels, the black circles represent the Gaussian components. In the lower left corner of each panel, the gray ellipse illustrates the synthesized beam for each band. The corresponding radio flux density scale is linked with a color map in each color bar.
Download figure:
Standard image High-resolution image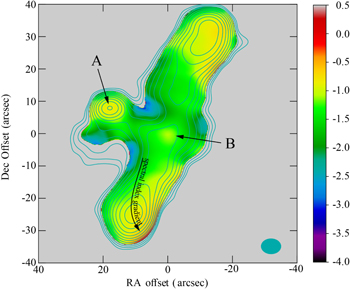
Figure 5. Radio spectral index map between 1.5 and 3 GHz. The spectral index map was created from the VLA B-array S-band and B-array L-band data. The corresponding spectral index scale is linked with a color map in the color bar, where the yellow regions are with a flat spectrum, while the green regions are with a steep spectrum. Here only the regions with a radio flux density above 7σ in both frequencies are presented. The cyan contours are from VLA B-array L-band data and are same as in the left panel of Figure 3, and its beam is shown in the lower right corner with a cyan ellipse.
Download figure:
Standard image High-resolution imageAccording to our EVN 5 GHz observation, the angular distance between cores A and B is 195. If we take the averaged photometric redshift between cores A and B (z = 0.42; the scale is 5.504 kpc arcsec−1) as a reference, the projected distance between the two AGNs is about 107 kpc, a marginally dual AGN system (Liu et al. 2011). This also results in a projected distance of ∼450 kpc between the northern and southern hotspots. Cores A and B have nearly equal apparent r-band magnitudes of 20.54 and 20.70 in the Pan-STARRS sky survey (Chambers et al. 2016), and there appears to be a tidal-tail structure in the image of galaxy A (see Figure 1), which further indicates an interplay between two galaxies. The association of an X-shaped jet morphology in interacting galaxies is quite common (e.g., Wirth et al. 1982; Murgia et al. 2001; Machacek et al. 2007).
4.2. Is the Jet Changing Its Direction?
With the EVN and VLA observations, we can measure the coordinates of cores A and B (see Table 1). The coordinates measured by the VLA are consistent between A-array L band and B-array S band, while the B-array S band has a higher accuracy, so we will use it in the discussion below. At the position of core B, our EVN 5 GHz measurement deviates from the VLA measurement. Interestingly, this deviation is not caused by an error but is intrinsic, i.e., if we take the EVN 5 GHz location of core B as the reference, then the location of core B measured by the VLA B-array at S band is at an R.A. offset = −67 ± 9 mas and at a decl. offset = −74 ± 9 mas (red cross in the right panel of Figure 2), which is beyond the 7σ astrometric error of VLA. Furthermore, it is unlikely to be a systematic error, compared to the VLA coordinates of core A, which are close to the position measured with the EVN (see the left panel of Figure 2).
A reasonable explanation for the position offset is that there is an inner <10 kpc scale jet in the direction −124° ± 26°. Because the inner kiloparsec-scale jet is not resolved by VLA observations, the VLA position of core A is likely an average between the radio core (i.e., the EVN position) and the jet. Such a structure-based peak shift along the jet is common in AGNs (e.g., Boccardi et al. 2017; HT MWL Science Working Group et al. 2021). Furthermore, a frequency-based core shift may contribute to a few positional shifts on the milliarcsecond scale (Shabala et al. 2012). The frequency-based core shift is along with the jet, so it will not affect the hypothesis of an inner jet. Although other scenarios cannot be ruled out, e.g., an off-nuclear AGN or a radio-bright star-forming region in the circumnuclear region of galaxy B, it seems that the jet reorientation is self-consistent with other signatures below. We mark the direction from the EVN to the VLA positions of core B as R4 in the middle and left panels of Figure 2. It seems that the bumps near R4 in the VLA S-band image (see the arrows in the middle panel of Figure 3) give some indication about the direction of the inner jet. Indeed, the arcsecond-scale jet direction of core A (Figure 4) is precisely consistent with the direction from the EVN to VLA coordinates (red cross in the left panel of Figure 2). The inner jet direction of core B is clearly different from the major jet axis direction on arcsecond scales (see Figure 2), thus indicating an ongoing jet reorientation at the nuclei.
In the VLA S-band image (Figure 3), there are signatures supporting jet reorientation in our target (see Krause et al. 2019 for a summary of signatures that support jet reorientation). Here we marked it following Krause et al. (2019); see Figure 3: (R) ring-like structure and wide hotspot on the northern side, and the southern hotspot is not at the edge of its lobe, (S) the northern hotspot on the opposite side of lobe/jet as the southern hotspot. Signatures of jet reorientation have been observed in jetted kiloparsec-scale (NGC 326, Murgia et al. 2001) and parsec-scale (0402+379, Rodriguez et al. 2006) dual/binary AGN systems. More interestingly, the VLA structure of J0725+5835 is similar to that of 0402+379 (Rodriguez et al. 2006) and appears to be a scaled-up version. Again, lateral flow signatures were found in the spectral index map of the southern hotspot (i.e., the spectral index gradient in Figure 5), which supports the ongoing jet reorientation. Further evidence that supports jet precession comes from 150 MHz image (Figure 6), where the northern jet extension is different from the extension in the VLA images.
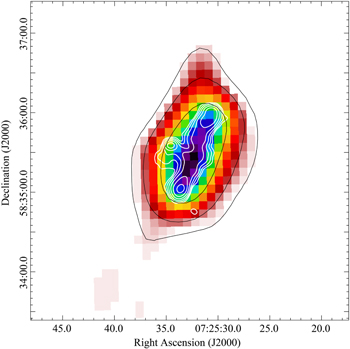
Figure 6. VLA B-array L-band contours (white lines) overlaid on the TGSS 150 MHz image and contours (black lines). Here the TGSS contours are in steps of (0.008, 0.032, and 0.128) Jy beam−1, and the VLA contours are in steps of (1,2,4, etc.) × 0.309 mJy beam−1. The pseudo-color image illustrates the TGSS radio flux density distribution.
Download figure:
Standard image High-resolution imageThere is no evidence, such as FRI type main jets, a double-boomerang morphology, or a bright apex in each boomerang (see Cotton et al. 2020), that would support that the backflow is the main mechanism that is responsible for the X-shaped radio morphology. Furthermore, the major jet direction of core B is nearly aligned with the minor axis of the host (see Figure 7 in the Appendix), which also disfavors the backflow model (Gillone et al. 2016). According to the above evidence of jet distortion, we favor an explanation in terms of a fast realignment of the jet axis for the X-shaped jet in J0725+5835. In addition, the backflowing plasma from the major jets may be at work and assist the formation of the wings. For example, Chon et al. (2012) proposed that after a reorientation, the new jet backflow is deflected into the fossil cavities created in the previous active phase.
Although the association between kiloparsec-scale binary (or dumbbell) galaxies and distorted jet structure was well addressed (Battistini et al. 1980; Wirth et al. 1982; Parma et al. 1991; Borne & Colina 1993; Murgia et al. 2001), it is unlikely in XRGs that the evolution of kiloparsec-scale galaxy pairs can drive dramatic jet realignment from wings to a major jet (see Krause et al. 2019). Alternative models include a sudden spin-flip in galaxy merger (Merritt & Ekers 2002) and interaction of parsec-scale binary SMBHs (Liu 2004). Therefore, it is unlikely that galaxies A and B, as the pair in J0725+5835, are responsible for the X-shaped jet. In the spin-flip model, the jet axis will only change once, it can explain the quick jet realignment from R1 (the wings) to R2 (major jet direction). The deficit of the spin-flip model is, however, that the later jet reorientation cannot be explained. Again, we show in Section 4.3 that an ongoing merger signature appears in galaxy B, which still disfavors the spin-flip model. On the other hand, the jet precession model can explain the ongoing jet reorientation. However, the jet precession model may require parsec-scale binary SMBHs, which are not seen in our VLBI observation. A possible explanation here could be that its binary companion is not radio-frequency active.
4.3. Host Galaxies
Taking an averaged redshift z ∼ 0.42, we can estimate the black hole mass by using three mechanisms. (a) The first mechansims is the correlation between (5 GHz) radio power P5 and black hole mass MBH (Lacy et al. 2001). While the L5−MBH correlation is coupled with the Eddington ratio (Ho 2002), here we roughly assume an Eddington ratio of 0.1 (e.g., Lacy et al. 2001). The 5 GHz radio flux density for cores A and B is measured by taking the VLA A-array L-band and B-array S-band flux density. The 5 GHz radio powers for cores A and B are P5, A = 1024.0 W Hz−1 and P5,B = 1023.7 W Hz−1, respectively, corresponding to a black hole mass MBH ∼ 109 M⊙ (Lacy et al. 2001) for galaxies A and B, with an intrinsic dispersion of 1 dex due to the uncertainties in the Eddington ratio. (b) The second mechanism is the correlation between MBH and the B-band absolute magnitude of the bulge (despite the host classification, we assume that the B-band magnitude of our target is bulge dominated; Graham & Scott 2013). Here the Pan-STARRS1 r-band corresponds to a rest-frame B-band (the effective wavelength is λeff,B = 4400 Å). Therefore, the B-band absolute magnitude (with a correction for Galactic absorption based on Schlafly & Finkbeiner 2011) for galaxies A and B is Mr, A = −21.41 ± 0.03 and Mr, B = −21.25 ± 0.05, respectively, which yields a black hole mass MBH = 109−1010 M⊙ for galaxies A and B. (c) The third mechanism is the correlation between MBH and the K-band absolute magnitude of the bulge (assuming that K-band magnitude of our target is bulge dominated; Kormendy & Ho 2013). Here the WISE W1-band corresponds to a rest-frame 2MASS Ks band (the effective wavelength is λeff, Ks = 2.159 μm). Therefore, the K-band absolute magnitude (with Galactic absorption corrections based on Schlafly & Finkbeiner 2011) for galaxies A and B are MK, A = −26.54 ± 0.03 and MK, B = −26.31 ± 0.04, respectively, which again yield a black hole mass MBH = 109−1010 M⊙ for galaxies A and B. Here the MK −MBH correlation is tighter than for mechanisms (a) and (b) (see Kormendy & Ho 2013). The three estimates of the black hole mass are consistent with each other. They induce a total galaxy stellar mass Mstellar = 1011−1012 M⊙ (Reines & Volonteri 2015; Greene et al. 2020). The stellar mass is consistent with 100 kpc scale galaxy pairs (Shah et al. 2020).
The mid-infrared magnitudes for the two cores have been collected from AllWISE Data Release (Cutri et al. 2021) as mW1, A = 15.296 ± 0.038, mW2, A = 15.018 ± 0.075, mW3, A = 12.200 for core A, and mW1, B = 15.520 ± 0.041, mW2, B = 15.444 ± 0.097, mW3, B = 12.089 for core B, which yield mid-infrared colors mW1, A−mW2, A = 0.27 ± 0.08 and mW2, A−mW3, A = 2.81 ± 0.07 for galaxy A, and mW1, B−mW2, B = 0.07 ± 0.10 and mW2, B−mW3, B = 3.35 ± 0.09 for galaxy B. Galaxy A is located in the transition region from early-type spirals (or Sa/SBa-type in Hubble's classification scheme, with semiquiescent star formation; see descriptions in Jarrett et al. 2019) to active star-forming galaxies, while galaxy B is located in the region of active star-forming galaxies (Jarrett et al. 2019). It is shown that 100 kpc scale galaxy pairs already have tidal interaction (Liu et al. 2011), while this does not affect the AGN activity (Shah et al. 2020). Therefore, the star-forming activity in galaxy B is more likely self-induced, e.g., an ongoing merger (Hopkins et al. 2006; Di Matteo et al. 2007).
5. Summary
We performed a high-resolution EVN 5 GHz observation of XRG J0725+5835. Two compact and nonthermal radio cores are detected. We have also reprocessed archival VLA 1.5 and 3 GHz data, and the radio spectral index map and astrometric coordinate were measured in this work. Compared with the VLA and EVN observations, (1) we find that XRG J0725+5835 is associated with a 100 kpc scale dual jetted-AGN system. One of the AGN is of Faranoff-Riley type I (FR I), the other AGN is type FR II. (2) We find evidence that the jet in core B is changing its direction, which naturally forms an X-shaped structure in J0725+5835. Two models are discussed on the origin of jet reorientation, including the sudden flip of black hole spin and jet precession due to the interaction of parsec-scale binary SMBHs. Future low-frequency radio observations with high sensitivity may help to reveal fossil radio emission. Furthermore, obtaining a spectroscopic redshift and high S/N image in the optical is crucial to identify the mechanisms proposed in this work.
This work is supported by the National Science Foundation of China (12103076) and the National Key R&D Programme of China (2016YFA0400702, 2018YFA0404602, 2018YFA0404603). X.L.Y. is supported by the Shanghai Sailing Program (21YF1455300) and China Postdoctoral Science Foundation (2021M693267). L.C.H. was supported by the National Science Foundation of China (11721303, 11991052). X.L.Y. and T.A. thank the financial support of the Bureau of International Cooperation, Chinese Academy of Sciences (114231KYSB20170003). Scientific results from data presented in this publication are derived from the EVN project RSY07 and VLA project 16A-220 and 16B-023. The European VLBI Network (EVN) is a joint facility of independent European, African, Asian, and North American radio astronomy institutes. The VLBI data processing in this work made use of the compute resource of the China SKA Regional Centre prototype, funded by the Ministry of Science and Technology of China and the Chinese Academy of Sciences. This work made use of Karl G. Jansky Very Large Array (VLA) data. The National Radio Astronomy Observatory is a facility of the U.S. National Science Foundation operated under cooperative agreement by Associated Universities, Inc. This work made use of TGSS data. We thank the staff of the GMRT, who made these observations possible. GMRT is run by the National Centre for Radio Astrophysics of the Tata Institute of Fundamental Research. This research has made use of the NASA/IPAC Infrared Science Archive, which is funded by the National Aeronautics and Space Administration and operated by the California Institute of Technology. The Photometric Redshifts for the Legacy Surveys (PRLS) catalog used in this paper was produced thanks to funding from the U.S. Department of Energy Office of Science, Office of High Energy Physics via grant DE-SC0007914. This work made use of data from the Pan-STARRS1 Surveys (PS1).
Appendix:
In this appendix, we present measurement of the orientation of galaxy B. To examine the major and minor axis directions of the optical host of galaxy B, we obtained the r-band image from the DECam Legacy Survey (DECaLS; Dey et al. 2019). Two-dimensional elliptical Gaussian models are fit to the DECaLS r-band image through the Markov chain Monte Carlo algorithm. The image can be fit with two elliptical Gaussian components, which are designated components a and b. The fitted elliptical Gaussian models are plotted in Figure 7, where the ellipses indicate the full width at half maximum (FWHM) along the major and minor axes. In Figure 8 we show the posterior probability distributions of the position angles of the major axes and the standard deviations  of the major and minor axes. We take 16% and 84% of the distributions as the lower and upper limits, respectively.
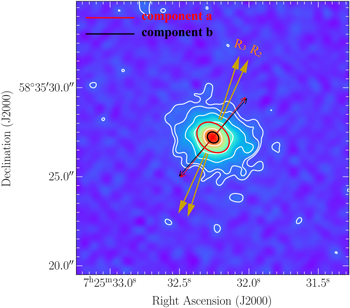
Figure 7. The DECaLS (Dey et al. 2019) r-band image and contours (white lines) of galaxy B. R2 and R3 are obtained from Figure 2. The black and red ellipses indicate the FWHMs of two-dimensional Gaussian components that are fit to the r-band image, where the black and red arrows are their minor-axis directions, respectively.
Download figure:
Standard image High-resolution image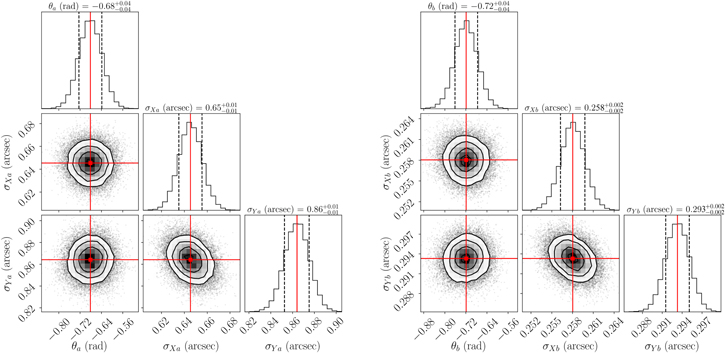
Figure 8. Marginalized and joint posterior probability distribution of the key parameter values obtained from the MCMC fitting. The left and right panels show parameters for components a and b, respectively (see also Figure 7). The histograms on the diagonal show the marginalized posterior densities for each parameter, i.e., position angles (θ, in radians) and standard deviation (in arcseconds) of the major (σY ) and minor (σX ). We take 50% of the distributions as the best-fit values, which are marked as red cross-hairs and red lines. The uncertainties are computed as the 16% and 84% of the distributions, thus representing the 1σ confidence ranges that are shown with dashed black lines.
Download figure:
Standard image High-resolution imageFootnotes
- 11
- 12
- 13