Abstract
The effects of spontaneous fission on r-process nucleosynthesis are investigated in the hot wind r-process scenario. We perform network calculations using three sets of spontaneous fission rates to study how the abundance pattern is shaped when different sets of fissioning nuclei are encountered by the r-process nuclear flow. The relative contributions from spontaneous fission, neutron-induced fission, and β-delayed fission to the nucleosynthesis process are studied by calculating the corresponding fission flow. We show that the relative contributions of various fission channels in r-process nucleosynthesis depend on the astrophysical conditions and fission models used. By using the spontaneous fission rates from a modified Swiatecki’s formula with isospin and blocking effects, the spontaneous fission and neutron-induced fission play an equally important role in r-process nucleosynthesis under an extreme neutron-rich astrophysical scenario with Ye = 0.1. The fissioning nuclei are located in different regions of the nuclear chart when different spontaneous fission models are used. The fission fragment distributions of fissioning nuclei in different regions have apparent diversity, which affects the mass regions where fission products are deposited, leading to the difference of the final abundance around the second r-process peak and rare-earth subpeak.
Original content from this work may be used under the terms of the Creative Commons Attribution 4.0 licence. Any further distribution of this work must maintain attribution to the author(s) and the title of the work, journal citation and DOI.
1. Introduction
The rapid neutron-capture process (r-process) is responsible for the production of about half of the elements heavier than iron and all the elements heavier than 209Bi in our universe (Burbidge et al. 1957). To date, the astrophysical sites for r-process nucleosynthesis have not yet been unambiguously identified. There are a number of candidate sites that have been proposed, as described in detail in Kajino et al. (2019) and Cowan et al. (2021), among which neutron star mergers (NSMs) and core-collapse supernovae are the two most favored candidates. The GW170817 gravitational-wave signal (Abbott et al. 2017a) and its associated electromagnetic (EM) counterpart (Abbott et al. 2017b) provide the support for binary NSMs (Symbalisty & Schramm 1982; Freiburghaus et al. 1999b; Wanajo et al. 2014) as one possible site of the r-process (Cowperthwaite et al. 2017). In parallel, the neutrino-driven wind (NDW) above the newly formed proto-neutron star in core-collapse supernovae (CCSNe; Woosley et al. 1994; Qian & Woosley 1996; Wanajo et al. 2001) have been thought to be the origin of the r-process for many years.
Theoretical simulations of the r-process nucleosynthesis play an important role in identifying its sites and interpreting the observed results of solar heavy element abundances. However, the r-process remains the most complex nucleosynthesis process to model from the astrophysics as well as the nuclear physics points of view. The uncertainties of astrophysical conditions and the lack of experimental data for the relevant neutron-rich nuclei make it still one of the most challenging topics (Arnould et al. 2007; Thielemann et al. 2011, 2017; Kajino et al. 2019; Cowan et al. 2021). In the past few decades, the measurements of properties of the nuclei relevant to r-process nucleosynthesis have been developed rapidly, but most of the information about neutron-rich nuclei far from the stability still rely on theoretical predictions, which vary greatly from one to another (Erler et al. 2012a; McDonnell et al. 2015; Neufcourt et al. 2020), introducing a significant source of uncertainty in r-process nucleosynthesis simulations (Martin et al. 2016; Mumpower et al. 2016; Li et al. 2019; Sprouse et al. 2020).
In recent years, nuclear astrophysicists have developed more and more sophisticated r-process models by adding new astrophysical or nuclear physics ingredients, trying to explain the solar r-process abundance pattern in a satisfactory way. The r-process simulations require nuclear properties of thousands of neutron-rich nuclei, including the nuclear masses, neutron-capture rates, β-decay half-lives, and fission rates. It has been shown that fission plays an important role in the r-process. It determines the region of the nuclear chart at which the flow of neutron captures and β decays stops (Cowan et al. 2021). The fission fragments are again drawn into the r-process as new seed nuclei and continue to capture neutrons to form heavy nuclei, affecting the final element abundances.
Relevant studies (Beun et al. 2008; Goriely et al. 2011; Korobkin et al. 2012; Mendoza-Temis et al. 2015; Lemaître et al. 2021) have shown that under the condition of a very large neutron-to-seed ratio, the r-process can undergo several fission cycles, and final abundances are largely set by the fission fragment distributions of neutron-rich nuclei, which is the mechanism for producing robust r-process abundances that are almost independent of the astrophysical conditions. However, the abundance distribution is rather sensitive to the adopted nuclear fission models, although it is insensitive to many astrophysical conditions due to fission cycling. In recent years, people have performed r-process calculations using different fission barriers and fission fragment distribution models (Goriely et al. 2013; Eichler et al. 2015; Goriely 2015; Vassh et al. 2019; Giuliani et al. 2020; Vassh et al. 2020; Lemaître et al. 2021). They have shown that the r-process abundances are strongly affected by fission barriers and the adopted model of fission fragment distribution, especially around the second r-process peak and rare-earth subpeak. In addition, the number of neutrons emitted by fission depends on the fission fragment distribution model, and these neutrons can be captured by nuclei after r-process freeze-out, which causes a slight shift of the third peak to heavier mass numbers (Eichler et al. 2015; Goriely 2015; Vassh et al. 2019; Giuliani et al. 2020). In Panov et al. (2013), they investigated effects of several phenomenological descriptions of spontaneous fission rates on the r-process abundances. It is observed that spontaneous fission process weakly influences the abundances of the second to third r-process peaks, while the formation of both cosmochronometer nuclei (uranium and thorium) and superheavy elements depends strongly on the applied model of spontaneous fission.
In order to further explore how the abundance pattern is shaped by fission, we need to understand the role of various modes of fission (neutron-induced fission, spontaneous fission, β-delayed fission, etc.) in r-process nucleosynthesis. In early applications to astrophysical nucleosynthesis, usually only one mode was considered, i.e., β-delayed fission (Thielemann et al. 1983) or spontaneous fission (Cowan et al. 1999; Freiburghaus et al. 1999a; Goriely & Clerbaux 1999). Then many subsequent studies show that neutron-induced fission is more important than β-delayed fission and spontaneous fission in r-process nucleosynthesis (Panov & Thielemann 2003, 2004; Martínez-Pinedo et al. 2007; Petermann et al. 2010; Petermann & Langanke 2012; Panov et al. 2013). However, different opinions are also presented. Korneev & Panov (2011) show a large contribution from spontaneous fission to nucleosynthesis, while in Shibagaki et al. (2016) β-delayed fission is the dominant fission channel, and the contribution of other fission channels is small. In addition, Mumpower et al. (2018) pointed out that neutron-induced fission is the dominating fission channel in the early stage of r-process nucleosynthesis, while β-delayed fission dominates after the r-process freeze-out. Recently, Sprouse et al. (2021) applied a novel nucleosynthesis tracing technique to study the relative contributions to final isotopic abundances by different fission channels, and showed that the influence of each channel on forming the final abundance pattern is related to the astrophysical conditions. So far, there is still no definite conclusion about the role of different types of fission in r-process nucleosynthesis.
Due to the complexity of the fission process and lack of experimental data in the neutron-rich region important for the r-process, the fission rates predicted by various models are with big uncertainties. Therefore, it would be important to investigate the role of different fission modes in r-process nucleosynthesis under the use of different sets of fission rates. However, such studies are still rare in the market. Therefore, we are going to carry out investigations using different spontaneous fission rates. There exists different methods to describe spontaneous fission, including phenomenological formulas fitted to experimental data (Kodama & Takahashi 1975; Ren & Xu 2005; Karpov & Zagrebaev 2012; Bao et al. 2015; Santhosh & Nithya 2016), macroscopic–microscopic approaches (Smolańczuk et al. 1995; Smolańczuk 1997; Möller et al. 2009), and Skyrme–Hartree–Fock approaches (Capote et al. 2009; Goriely et al. 2009; Erler et al. 2012b). Due to the complexity of the fission process, the microscopic systematic calculations of spontaneous fission half-lives are very difficult. Most of the studies on r-process nucleosynthesis use a phenomenological formula to describe spontaneous fission half-lives. Therefore, in this paper, we use three representative sets of spontaneous fission rates based on phenomenological formulas (Kodama & Takahashi 1975; Bao et al. 2015; Santhosh & Nithya 2016) in network calculations to study the role of spontaneous fission in the r-process and analyze the influence of the spontaneous fission model on the final r-process abundance distribution. A main focus is to explore the relative contributions of various fission channels in the r-process and the main factors that influence it.
The paper is organized as follows: Section 2 presents the method and parameters used in our nucleosynthesis calculations; Section 3 reports the main results concerning the relative contribution of three fission channels and the final r-process abundances based on different spontaneous fission models; finally, Section 4 summarizes the main findings and perspectives of the present work.
2. Nucleosynthesis Calculations
We utilize the nuclear network NucNet 3 to simulate r-process nucleosynthesis. The network consists of more than 6000 isotopes, including neutrons, protons, and heavy isotopes with atomic numbers Z ≤ 102. Once the calculation reaches a certain low temperature, the charged-particle reactions freeze-out, and the subsequent abundance evolution of the nucleus (A, Z) is given by taking into account the reactions with neutrons, β decays, α decays, and fission of nuclei. Therefore, the differential equation defining the abundance evolution of nuclide (A, Z) is given as
Here, YA, Z is the abundance of nuclide (A, Z); λi is the reaction rate of different reaction type i, including β decay (β), neutron capture (nγ), photodissociation (γ n), α decay (αγ), and three kinds of fission reactions that are neutron-induced fission (nf), spontaneous fission (sf), and β-delayed fission (β df); Pkn is the probability of delayed k neutron emission; Af and Zf are the mass and charge numbers of the fissioning nucleus, respectively; Pβ df is the β-delayed-fission probability; Wi is the weighting function of the fission products, i.e., the probability or branching ratio for obtaining (A, Z) products, where i specifies different fission channels. For each nuclide, one can set up an expression like Equation (1). By solving such a reaction network, one can finally obtain the evolution of the element abundance.
For the calculations performed in this work, the β-decay rates, α-decay rates, and neutron-capture rates are taken from JINA REACLIB database. 4 Experimentally determined masses and reaction rates are adopted if available. We consider three fission modes in our network calculations. The neutron-induced fission rates are from Panov et al. (2010), while the β-delayed fission rates are taken from Panov et al. (2005).
Our sets of spontaneous fission rates utilized are based on three phenomenological formulas. The first is the Frankel–Metropolis formula (Frankel & Metropolis 1947; Kodama & Takahashi 1975), which gives the approximation of the spontaneous fission rate based on the dependence on the fission barrier. We use this simple formula with coefficients adjusted to the available experimental fission half-lives as in Petermann & Langanke (2012)

where the fission barrier Bf is taken from the ETFSI model (Mamdouh et al. 1998). In addition, based on Swiatecki’s formula (Swiatecki 1955), two modified formulas are proposed by X. J. Bao et al. (Bao et al. 2015; Zhao & Bao 2018) and K. P. Santhosh et al. (Santhosh & Nithya 2016) for determining the spontaneous fission half-lives, respectively. These two formulas can be expressed as

where Eshell is the shell-correction energy taken from Möller et al. (1995) and Möller et al. (2016), respectively;  , representing the isospin effect; hi
is the blocking effect of an unpaired nucleon; c1 ∼ c4 and a ∼ f are parameters of the formulas whose values are given in Bao et al. (2015) and Santhosh & Nithya (2016), respectively. In these two formulas, spontaneous fission rates depend on fissility Z2/A, isospin effect, and shell-correction energy. These three sets of spontaneous fission rates are represented by SF1, SF2, and SF3 in the following, respectively.
, representing the isospin effect; hi
is the blocking effect of an unpaired nucleon; c1 ∼ c4 and a ∼ f are parameters of the formulas whose values are given in Bao et al. (2015) and Santhosh & Nithya (2016), respectively. In these two formulas, spontaneous fission rates depend on fissility Z2/A, isospin effect, and shell-correction energy. These three sets of spontaneous fission rates are represented by SF1, SF2, and SF3 in the following, respectively.
In this work we calculate fission fragment yields based on the GEneral Fission model (GEF) with publicly available code version 2021/1.1 , 5 which estimates the properties of the fission fragments and the emitted neutrons in a global and semiempirical way. The GEF model has proven its capacity to describe experimental fission fragment distribution extremely well, at the expense of introducing empirical adjustments. More details on the GEF model can be found in Schmidt et al. (2016) and references therein. We calculate the fission fragment yields of neutron-induced fission, spontaneous fission, and β-delayed fission, respectively, where about 400 fission fragments are included for each fissioning nucleus. The fission product yields depend on the excitation energy of fissioning nuclei. For spontaneous fission, the excitation energy is zero. However, for neutron-induced fission and β-delayed fission, the fission fragment distribution will change with the excitation energy of fissioning nuclei. Although the r-process indeed occurs over a range of temperatures, neutron-induced fission occurs at a late time in the r-process after the temperature drops to 1 GK (≈0.1 MeV) in the nucleosynthesis scenario we considered. Thus, we apply fission product yields induced by 0.1 MeV neutrons to approximate yields at different temperatures as in Vassh et al. (2019). As for β-delayed fission, we set the Qβ energy, which is released in ground-state to ground-state β-decay, as the excitation energy of fissioning nuclei (Möller et al. 2003). It has been shown that neutrons released during fission have an important effect on r-process abundance, and these neutrons can be captured by nuclei after freeze-out, resulting in a slight shift of the third r-process peak to heavier mass numbers (Eichler et al. 2015; Goriely 2015; Vassh et al. 2019; Giuliani et al. 2020). So we also take into account the neutrons released during the fission process in our r-process calculations.
We perform r-process calculations using a hot wind trajectory parameterized as in Meyer (2002). We start our nucleosynthesis calculations at temperature T = 10 GK and electron fraction Ye = 0.1. The astrophysical trajectory function is defined as


where τ0 and τ1 are expansion timescales, ρ0 + ρ1 is the density at time t = 0, and T9,0 is initial temperature. In this work, τ0, τ1, ρ0, and ρ1 are taken as 0.035, 1.0, 1.4985 × 10⁶, and 1.5 × 10³, respectively. The mass density ρ, as a function of time t, is proportional to the third power of temperature. This trajectory function gives a fairly realistic approximation to a hot wind r-process evolution.
3. Results
3.1. Impact of Different Fission Channels on r-process Abundances
The calculated spontaneous fission rates with three phenomenological models are shown in Figure 1. The shaded areas represent nuclei whose integrated fission flow is greater than 10−30 during our r-process calculations; see Figure 4. There are remarkable deviations of the spontaneous fission rates predicted by these three empirical formulas, especially for neutron-rich nuclei away from the nuclear region with experimental data. Unfortunately, these nuclei with remarkable uncertainties of spontaneous fission rates locate inside the shaded area, which are important fissioning nuclei for the r-process calculation. Therefore, it would be meaningful to analyze the influences of these uncertainties to the r-process study brought by different spontaneous fission models.
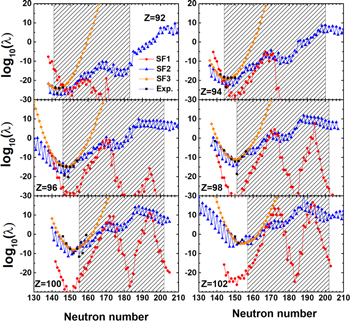
Figure 1. Spontaneous fission rates of selected isotopic chains calculated with three phenomenological models, in comparison with the experimental spontaneous fission rates taken from Holden & Hoffman (2000; black squares). The shaded areas represent nuclei whose integrated fission flow is greater than 10−30 during the r-process calculations.
Download figure:
Standard image High-resolution imageThe SF1 formula even underestimates the experimental data in the known region for most of the isotopic chains considered here, and correspondingly it also gives general small rates in the extremely neutron-rich region. The shell effect of magic number N = 184 is apparently included in this formula through the fission barrier, presenting a quick decrease of fission rate as the number of neutrons approaches the magic number of 184. However, apart from the above shell effect, the isospin effect, which should play an important role on spontaneous fission half-lives as well (Santhosh et al. 2010; Bao et al. 2015), is rarely seen in SF1. In contrast to the SF1 formula without the isospin effect, the SF2 and SF3 formulas contain both shell corrections and isospin effect. The SF2 and SF3 fission rates both agree well with the experimental values. The SF2 formula even reproduces the odd–even staggering of spontaneous fission rates by introducing the blocking effect of unpaired nucleons, while the SF3 formula cannot. However, going away from the experimentally known region, the two formulas start to show large deviations, especially in the neutron-rich region. The SF3 fission rates increase quadratically with the increasing of neutron numbers and hence obtain very large values in the neutron-rich region due to the simple I2 dependence  as a leading term, and as a result the effect of nuclear structure like shell corrections on the isotopic chain almost disappeared. In contrast, the SF2 formula considers the isospin effect in a more reasonable way. The fission rates predicted by the SF2 formula lie between those values predicted by the SF1 and SF3 formulas, and increase steadily as the neutron number increases. So the spontaneous fission rates predicted by the SF2 formula may be more reliable.
The final abundance distributions at a simulation time of 1 Gyr with different fission channels included in the nuclear reaction network using three sets of spontaneous fission rates are shown in Figure 2. It demonstrates the impact of single fission channels on the final abundances under the use of different spontaneous fission rates. When only the SF1 spontaneous fission rates are included in the reaction network and other fission channels are turned off, as shown by the green solid line in Figure 2(a), the final abundances of nuclei with A < 240 are largely underestimated overall, and a large amount of material accumulates in the regions near A = 320. With the further inclusion of a neutron-induced fission channel, the r-process abundance is more or less reproduced with only a small underestimation of the abundance around the second peak and the rare-earth subpeak (blue dashed line in Figure 2(a)), which is improved by the inclusion of β-delayed fission (orange dotted line in Figure 2(a)). With the use of the SF1 formula, it has shown that the neutron-induced fission plays the most important role in the r-process calculation among the three fission channels. It is noticed that some materials accumulate around the A = 320 region with the use of the SF1 formula. Due to the overall small spontaneous fission rate in the extremely neutron-rich region, the material flows to higher mass by the normal r-process sequence of neutron captures and β decays, rather than fragment to smaller nuclei. Once it reaches the top of the network (Z = 102, the highest proton number of the nuclear network), the flow stalls because no β decays can occur. In addition, we only calculated the fission yields of nuclei in the mass and shell-correction tables of the GEF model, with 1 ≤ Z ≤ 136 and 1 ≤ N ≤ 203, to ensure that our output fission data are consistent with standard user outputs. For this reason, the fission reactions of nuclei with Z = 102, A > 305 are not included in our reaction network. Therefore, there are no reactions to consume these materials accumulated around the Z = 102, A = 320 region. Even in the SF1+NF+βDF case, there is still some material in this region that is left in the final abundance distribution. However, due to the very small amount of the material, even if they all fragment to lighter nuclei, it would not significantly alter the remaining abundances. So the conclusion drawn from this calculation will not be affected.
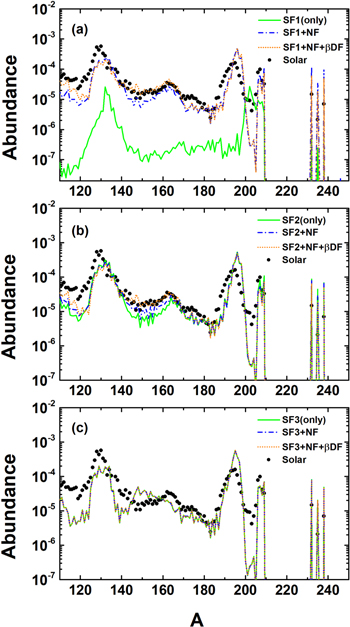
Figure 2. Final abundances at a simulation time of 1 Gyr when different fission channels are considered in a nuclear reaction network. The green solid line represents where only spontaneous fission is considered. The blue dashed line represents where both neutron-induced fission and spontaneous fission are considered. The orange dotted line corresponds to standard calculations, where all three fission channels are included. Top, middle, and bottom panels corresponding to spontaneous fission rates are calculated from the SF1, SF2, and SF3 models, respectively. Note that in panel (a), there is some material piled up around A = 320, which is out of the x-axis range of the figure. Details can be found in the text. The dots represent the solar r-process abundance pattern (Sneden et al. 2008).
Download figure:
Standard image High-resolution imageThe fission rates of SF2 are larger than that of SF1. If we only use the SF2 spontaneous fission rates (green solid line in Figure 2(b)), the final abundances obtained by nucleosynthesis calculations are much larger than those obtained by SF1, and the material in the A > 260 region is completely consumed before the nuclear flow reaches the top of the network. The basic features of the r-process abundance are reproduced, while the underestimated abundances around rare-earth subpeak and the valley after the second r-process peak are improved step by step with the further inclusion of neutron-induced fission and β-delayed fission (blue dashed line and orange dotted line in Figure 2(b)). As a result, a good overall agreement with the solar r-process abundance pattern is achieved when three fission channels are included. With the use of the SF2 formula, the effects of spontaneous fission and neutron-induced fission on the abundance distribution are both important.
The fission rates of SF3 are the largest among these three sets of spontaneous fission rates. If only SF3 spontaneous fission rates (green solid line in Figure 2(c)) are used, the final abundances obtained by nucleosynthesis calculations stay unchanged even if the neutron-induced fission channel and β-delayed fission channel are further included (blue dashed line and orange dotted line in Figure 2(c)). Therefore, the effects of the other two fission channels are almost negligible in the case of large spontaneous fission rates. However, in this case the rare-earth subpeak cannot be reproduced correctly with a wrong prediction of the peak position, indicating the unrealistic behavior of spontaneous fission rates in the neutron-rich region predicted by SF3.
Among these three fission formulas, the best agreement with the solar r-process abundance pattern is achieved with three fission channels included in the case of using the SF2 fission rates. With the use of the SF1 formula that gives the smallest fission rates, the influence of spontaneous fission on the abundance distribution is much smaller than that of neutron-induced fission, and with the increase of spontaneous fission rates given by the SF2 formula, the effects of spontaneous fission and neutron-induced fission on the abundance distribution are almost equal. For the very large spontaneous fission rates of the SF3 formula in the neutron-rich region, the role of spontaneous fission is the most important, and the results obtained by considering three types of fission are almost the same as those obtained by considering only spontaneous fission. Considering that SF2 gives the most reasonable fission rates, we conclude that spontaneous fission and neutron-induced fission are equally important for the r-process calculation, and neutron-induced fission and β-delayed fission mainly influence the abundances around rare-earth subpeak and the valley after the second r-process peak.
3.2. The Relative Contribution of Various Fission Channels in r-process
Having explored the effect of a single fission channel on the abundance distribution, we next consider what role each fission channel plays when all the fission channels are included in a nuclear reaction network. Figure 3 shows the evolution of relative fission flows for three fission channels with different spontaneous fission models: SF1, SF2, and SF3 in r-process nucleosynthesis calculations. Although results under different initial electron fractions Ye are presented, we first focus our discussions on the case of defaulted value Ye = 0.1, and then discuss the influence of different astrophysical conditions in the end of this subsection. The relative fission flows, which quantify the relative contributions of various fission channel in r-process nucleosynthesis, are defined as

where i labels the fission type, and dYf, i represents the total number of nuclei that were destroyed through the ith fission channel in the time interval t ∼ t + dt.
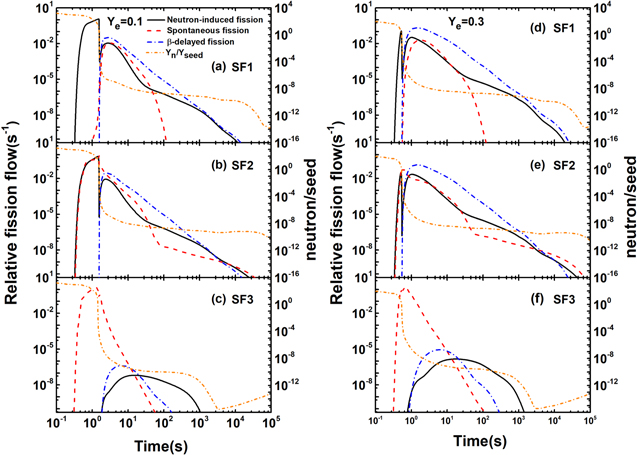
Figure 3. The evolution of relative fission flows for three fission channels with different spontaneous fission rates given by SF1, SF2, and SF3 in r-process nucleosynthesis calculations. Left and right panels correspond to the initial electron fraction Ye = 0.1 and 0.3, respectively.
Download figure:
Standard image High-resolution imageThe neutron-to-seed ratio (i.e., the ratio of free neutrons to heavy nuclei (Z > 2)) as a function of time is also shown in Figure 3. When the neutron-to-seed ratio suddenly decreases and becomes smaller than 1.0, the r-process freeze-out starts. At this moment, neutron captures and β decays operate on similar timescales. In the case of SF1, the neutron-induced fission starts first, and the other two fission channels start to contribute later around the time of freeze-out. In the case of SF2, the spontaneous fission starts to contribute as early as the neutron-induced fission. The above phenomena will be explained later in Figure 5. Besides, the sudden decrease of free neutrons at freeze-out leads to a rapid drop in the neutron-induced fission flow in Figures 3(a) and (b). The subsequent β-delayed neutron emission (leading to the production of free neutrons) is responsible for the revival of neutron-induced fission, which can be seen in Figures 3(a) and (b) by the second hump. We note that in Figure 3(c), the spontaneous fission starts as early as the case of SF2; however, the neutron-induced fission only occurs after r-process freeze-out. The reason is that the SF3 spontaneous fission rates are extremely large for neutron-rich nuclei as shown in Figure 1, and almost all heavy neutron-rich nuclei are consumed through spontaneous fission. However, as for the nuclei close to the β-stable line, they cannot be exhausted by the spontaneous fission due to the relatively small spontaneous fission rate, which results in the neutron-induced fission occurring during the decay back to stability.
To see the relative contributions of each fission channel in the whole nucleosynthesis time interval, the integrated relative fission flows are shown in Table 1. Under Ye = 0.1, in the case of using the SF1 fission rates, neutron-induced fission is dominant in r-process nucleosynthesis. When using the SF2 fission rates, the contributions of neutron-induced fission and spontaneous fission are almost equivalent. If the SF3 fission rates are used, spontaneous fission is the dominant channel, and the neutron-induced fission and β-delayed fission are both negligible during the working of the r-process.
Table 1. The Relative Contributions of Various Fission Channels in r-process Evaluated by Integrated Relative Fission Flow when Utilizing the SF1, SF2, and SF3 Spontaneous Fission Rates, under the Initial Electron Fraction Ye = 0.1 and 0.3, Respectively
| Fission Mode | Ye = 0.1 | Ye = 0.3 | ||||
|---|---|---|---|---|---|---|
| SF1 | SF2 | SF3 | SF1 | SF2 | SF3 | |
| Spontaneous fission | 4.40% | 45.12% | 99.99% | 5.48% | 5.77% | 99.98% |
| Neutron-induced fission | 83.02% | 44.86% | <0.01% | 5.76% | 5.85% | 0.01% |
| β-delayed fission | 12.59% | 10.02% | <0.01% | 88.76% | 88.38% | 0.01% |
Download table as: ASCIITypeset image
In order to investigate which nuclei participate most actively during fission in the r-process, we depict in Figure 4 the integrated fission flows  for each nuclide n, defined as
  , of a certain fission channel i, which represents the activity of a kind of nuclide undergoing fission during the r-process (Mumpower et al. 2018; Vassh et al. 2019). In Figure 4, the higher mass number and more neutron-rich region is accessed by the SF1 and SF2 models. However, for the SF3 model, a large number of nuclei undergo fission before nuclear flow moves higher in mass number. The nuclei of high fission flow strongly depend on the fission model used.
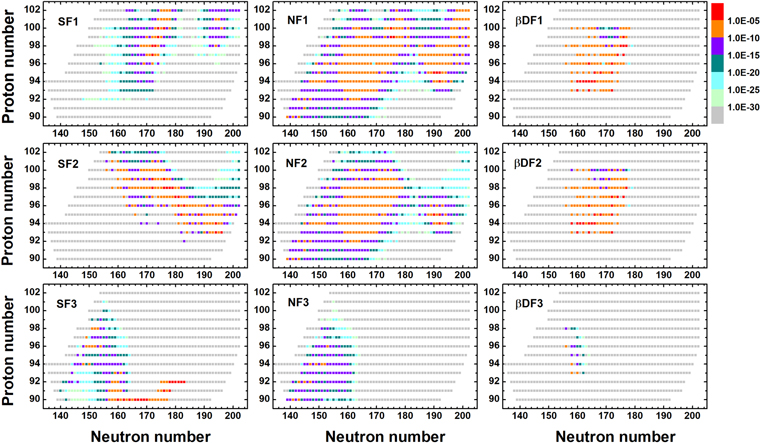
Figure 4. The integrated spontaneous (SF), neutron-induced (NF), and β-delayed fission flows (βDF). Top, middle, and bottom panels correspond to spontaneous fission rates used in the r-process calculations are from the SF1, SF2, and SF3 models, respectively.
Download figure:
Standard image High-resolution imageTo understand at which time the spontaneous fission happens, we further plot the r-process abundance patterns at different times together with the spontaneous fission region. Under the same r-process astrophysical conditions, the r-process paths and abundance patterns for the three spontaneous fission models are the same before the onset of fission. So Figure 5 shows respectively the abundance patterns after the onset of fission when utilizing the SF1, SF2, and SF3 spontaneous fission rates at three different times: 0.34 s (before r-process freeze-out), 1.44 s (freeze-out), and 6.50 s (after freeze-out). We define the regions with integrated fission flow  , which are highlighted in Figure 4 as the fission regions for three fission channels. The choice of this threshold does not affect the conclusion hereafter. The spontaneous fission regions for SF1, SF2, and SF3 are also shown by the crosses in Figure 5. We find that the time at which the spontaneous fission starts to occur is different. In the case of SF2 and SF3, nuclear flow reaches the spontaneous fission region at 0.34 s, so spontaneous fission occurs earlier as shown in Figure 3. In addition, nuclei in the N > 165 region correspond to a very large spontaneous fission rate in the SF3 case, which makes neutron capture more difficult and hinders the formation of A > 270 heavy nuclei. Since it cannot produce a large number of neutron-rich fissioning nuclei as in the first two cases, the contributions of neutron-induced fission and β-delayed fission are much smaller as shown in Figure 3(c).
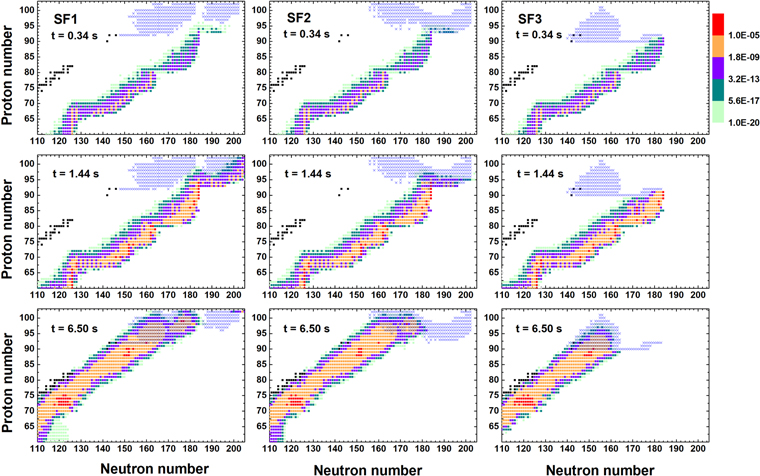
Figure 5. The abundance patterns when utilizing the SF1 (left panels), SF2 (middle panels), and SF3 (right panels) spontaneous fission rates, respectively, at three different times: 0.34 s (upper panels), 1.44 s (middle panels), and 6.50 s (lower panels). The major spontaneous fission regions in the nuclear chart as shown in Figure 4 are indicated by crosses. The black squares represent stable nuclei.
Download figure:
Standard image High-resolution imageIn addition to the fission model used, we find that astrophysical conditions also affect the relative contributions of different fission channels. Under different astrophysical conditions, when the r-process path changes, the region that nuclear flow can reach is different. As mentioned in Korneev & Panov (2011), in the NSM scenario they considered with high neutron-to-seed ratio, the r-process proceeds near the neutron drip line and first reaches the region where the spontaneous fission rate is high (nuclei with N > 184 based on the spontaneous fission model they used), resulting in a large contribution of spontaneous fission. However, in the scenario based on the supernova explosion model with a neutron-to-seed ratio lower than the case of Korneev & Panov (2011), nucleosynthesis proceeds far from the neutron drip line and does not reach the region of nuclei with very short spontaneous fission half-lives, in which case spontaneous fission plays a minor role as in Petermann et al. (2010). In fact, the neutron-to-seed ratio is the decisive factor affecting the r-process path. The NSM scenario considered in Korneev & Panov (2011) was supposed to have a high neutron-to-seed ratio; nevertheless there are some simulations of NSM winds suggesting that some components of the ejecta can have quite low neutron-to-seed ratios, especially in the polar regions (Miller et al. 2019). So it is not necessary to refer to a specific r-process site, and instead in our study, independent of the actual environment, nucleosynthesis in different astrophysical conditions is investigated by changing the value of Ye rather than specific sites. We start nucleosynthesis calculations with initial electron fraction Ye = 0.1. When we increase initial Ye to 0.3, the r-process freeze-out occurs earlier as shown in Figure 3. The r-process path is closer to the stability, and there is less material across the N = 184 shell. The contribution of neutron-induced fission and spontaneous fission decreases, while the β-delayed fission increases as shown in Figures 3(d) and (e) and Table 1. The β-delayed fission dominates over neutron-induced and spontaneous fission. Therefore, the relative contributions of various fission channels may vary both from fission models and astrophysical conditions used in nucleosynthesis calculations, as emphasized in Sprouse et al. (2021). However, since the SF3 spontaneous fission rate is very large in the N > 165 region, spontaneous fission is still the dominant fission channel in the case of Ye = 0.3 as shown in Figure 3(f).
3.3. The Contribution of Fission Fragments to Final Abundances
As described above, the fission regions that have high fission flow are different when using three different spontaneous fission models in the r-process calculations. So we next consider how fission products of fissioning nuclei in various regions can affect the final abundances. When fission occurs, the temperature is smaller than 1 GK, so we can ignore the tiny difference in fission yields at different temperatures. Thus, we apply a constant incident neutron energy of 0.1 MeV for neutron-induced fission. The mass distributions of fission fragments for neutron-induced fission (red line) and spontaneous fission (blue line) predicted by the GEF2021 model are shown in Figure 6. The fission fragment distributions of fissioning nuclei in different regions of the nuclear chart have evident diversity. As the neutron number in the fissioning nuclei increases, the position of the heavy peak moves to a higher mass number. The nuclei in the SF1 and SF2 fission regions (around Z = 93 ∼ 100, N = 155 ∼ 195) have both double-humped and single-humped fragment distributions, while those in the SF3 fission region (around Z = 90 ∼ 93, N = 155 ∼ 185) are mostly double-humped distributions.
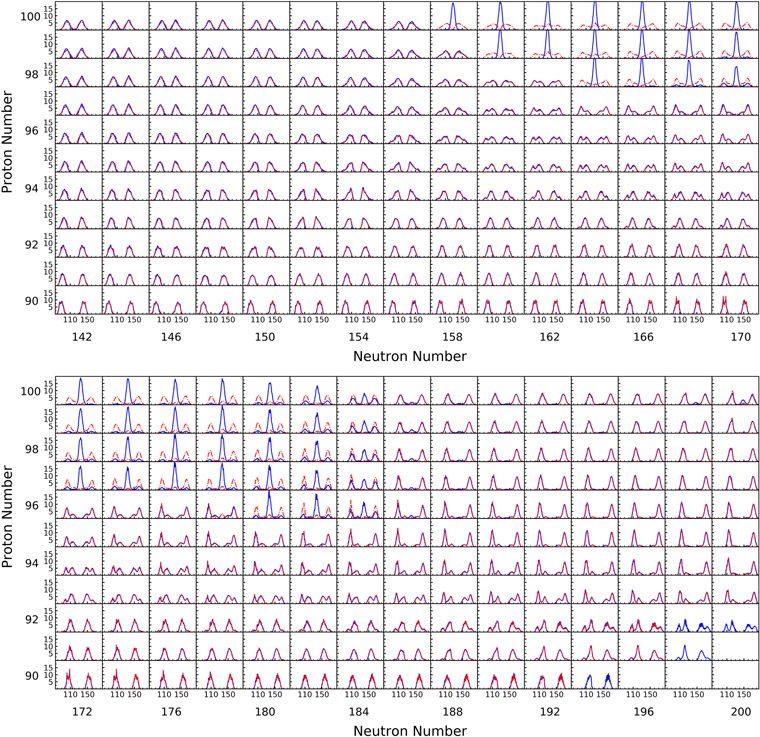
Figure 6. The mass distributions of fission fragments for neutron-induced fission from a 0.1 MeV neutron (red line) and spontaneous fission (blue line) predicted by the GEF2021 model. The units of yield are expressed as a percentage.
Download figure:
Standard image High-resolution imageWe now investigate where fission products are deposited in the r-process abundance curve. The contributions of fission fragments to the element abundance are shown in Figure 7, which gives the distributions of all fission products in the whole nucleosynthesis process. The contribution of fission products to the abundance is defined as  . Here we take the integrated fission flow fi
(n) of a parent nucleus n multiplied by the fission yield wi
(A) of the corresponding fission product with the mass number A, and then sum the contributions from all fissioning nuclei, where i refers to a certain fission channel. It’s important to emphasize that fission products will undergo a multitude of reactions or decays after being produced by fission, so the ΔYF
is not the actual contribution to the final abundance, it just summarizes how the fission products with a different mass number are deposited before the subsequent reactions or decays in the whole nucleosynthesis process. As can be seen in Figure 7(b), the distributions of spontaneous fission products from three formulas differ a lot. The reason is that the spontaneous fission regions calculated by the three models have apparent diversity as shown in Figure 4. The fission region of SF3 has mostly double-humped fission fragment distributions, as shown in Figure 6, resulting in the total double-humped distribution shown here, while SF1 and SF2 fission regions have both double-humped and single-humped fragment distributions. In Figure 7(c), neutron-induced fission regions of NF1 and NF2 are similar, resulting in similar fission product distributions. The same is true for β-delayed fission βDF1 and βDF2. The fission products of three fission channels are summed, and the total distributions of all fission products are similar when using the SF1 and SF2 spontaneous fission models as shown in Figure 7(a).
. Here we take the integrated fission flow fi
(n) of a parent nucleus n multiplied by the fission yield wi
(A) of the corresponding fission product with the mass number A, and then sum the contributions from all fissioning nuclei, where i refers to a certain fission channel. It’s important to emphasize that fission products will undergo a multitude of reactions or decays after being produced by fission, so the ΔYF
is not the actual contribution to the final abundance, it just summarizes how the fission products with a different mass number are deposited before the subsequent reactions or decays in the whole nucleosynthesis process. As can be seen in Figure 7(b), the distributions of spontaneous fission products from three formulas differ a lot. The reason is that the spontaneous fission regions calculated by the three models have apparent diversity as shown in Figure 4. The fission region of SF3 has mostly double-humped fission fragment distributions, as shown in Figure 6, resulting in the total double-humped distribution shown here, while SF1 and SF2 fission regions have both double-humped and single-humped fragment distributions. In Figure 7(c), neutron-induced fission regions of NF1 and NF2 are similar, resulting in similar fission product distributions. The same is true for β-delayed fission βDF1 and βDF2. The fission products of three fission channels are summed, and the total distributions of all fission products are similar when using the SF1 and SF2 spontaneous fission models as shown in Figure 7(a).
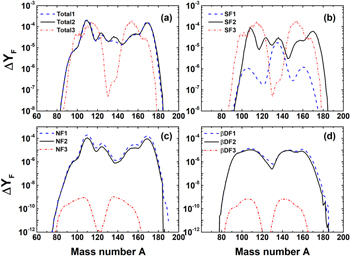
Figure 7. The contribution of fission fragments to element abundance. The ΔYF represents the increase in the abundance of nuclei with a given mass number due to fission. The first panel shows the sum of contributions to the possible products of three fission channels, and the remaining panels show contributions from single fission channels. The three curves in each panel represent the spontaneous fission rates: SF1, SF2, and SF3 that are used in r-process nucleosynthesis calculations, respectively.
Download figure:
Standard image High-resolution imageFigure 8 shows the final r-process abundances after a time of 1 Gyr with three spontaneous fission models when all three fission channels are included. When using the SF1 and SF2 models, the final abundance is consistent with the solar r-process abundances. However, the SF3 model exhibits a peak at A ≈ 150, which deviates remarkably from solar r-process abundance. We found that in the SF3 model, a large number of fission fragments are deposited at around A = 150, as shown in Figure 7(a), resulting in a peak in this region in the r-process abundance distribution. The total distributions of fission products of SF1 and SF2 models are similar, leading to similar final abundance distributions. Different fission regions, which correspond to different fission fragment distributions and hence cause fission products deposited in different mass regions, are the main reason for the different shapes of the second r-process peak and rare-earth subpeak.
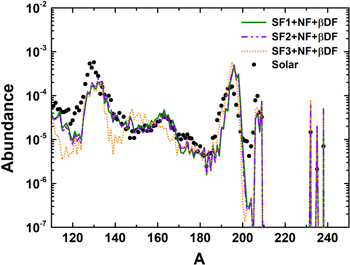
Figure 8. The final r-process abundances after a time of 1 Gyr with three spontaneous fission models.
Download figure:
Standard image High-resolution image4. Summary
In the present paper we have performed r-process calculations based on different spontaneous fission models in the hot wind r-process scenario to study the relative contributions of three fission channels in the r-process and the influence of spontaneous fission on the final abundance distributions.
There are two main factors that influence the relative contribution of various types of fission in r-process nucleosynthesis. One is the fission model used in nucleosynthesis calculations. Different fission models may have divergent predictions about fission regions with high fission rates. When we use the SF1 spontaneous fission rates based on Frankel–Metropolis formula (Frankel & Metropolis 1947; Kodama & Takahashi 1975), neutron-induced fission plays the biggest role. However, when we use the SF3 spontaneous fission rates based on a phenomenological formula proposed by Santhosh and Nithya (2016) that gives very high spontaneous fission rates for the N > 165 region, the high rates effectively cut off the influence of neutron-induced and β-delayed fission at the neutron-rich region. Compared with the SF1 and SF3 fission rates, we find that the SF2 fission model (Bao et al. 2015) gives a more reliable prediction of the spontaneous fission rate. The best overall agreement with the solar r-process abundance pattern is achieved when the SF2 fission rates are used, where spontaneous fission and neutron-induced fission play an equally important role in r-process nucleosynthesis. The second factor is astrophysical conditions. The region in the nuclear chart that the nuclear flow can reach is different under different astrophysical conditions. When we increase the initial Ye from 0.1 to 0.3, there is less material across the N = 184 shell. The nuclear flow cannot reach the N > 184 region with high spontaneous and neutron-induced fission rates, and the contribution of spontaneous and neutron-induced fission decreases accordingly in the case where the SF2 model is used. Therefore, the relative contributions of various fission channels may vary with the application of fission models or astrophysical conditions.
Fission occurs in different regions when various spontaneous fission models are used under the same astrophysical conditions, corresponding to different fission fragment distributions. For the SF1 and SF2 models, fission products are deposited in similar mass regions, leading to similar final abundance distributions. However, the deposition of fission products in the case of using the SF3 model is significantly different from that of SF1 and SF2. A large number of fission fragments are deposited at around A = 150, resulting in a peak in this region in the r-process abundance distribution. This is the main reason for the evident diversity of the final abundances around the second r-process peak and rare-earth subpeak.
There are great differences of the predictions of fission properties between different theoretical models when extrapolating to nuclei far from the stability. This could lead to differences in the final r-process abundance distributions. Therefore, efforts by experimental and theoretical nuclear physics to further explore the fission properties in neutron-rich regions are necessary. Independent of the nuclear inputs studied here, it should be realized that the astrophysical conditions are also important. Here we utilized only the conditions for the hot wind r-process. Future studies on the impact of fission in the dynamical ejecta of NSMs with lower Ye , which can lead to more fission cycling, would benefit the understanding of the r-process.
We acknowledge helpful discussions with Dr. F. Q. Chen and W. L. Lv. This work was supported by the “Young Scientist Scheme” of National Key Research and Development (R&D) Program under grant No. 2021YFA1601500, the National Natural Science Foundation of China under grant Nos. 11875070 and 12075104, and the Anhui project (Z010118169).
Footnotes
- 3
- 4
- 5