Abstract
We present extensive optical observations of a nearby Type Ia supernova (SN Ia), SN 2021hpr, located in the spiral galaxy NGC 3147 at a distance of ∼45 Mpc. Our observations cover a phase within ∼1–2 days to ∼290 days after the explosion. SN 2021hpr is found to be a spectroscopically normal SN Ia, with an absolute B-band peak magnitude of  mag and a postpeak decline rate of Δm15(B) = 1.0 ± 0.01 mag. Early time light curves showed a ∼7.0% excess emission compared to a homogeneously expanding fireball model, likely due to SN ejecta interacting with a companion or immediate circumstellar matter (CSM). The optical spectra of SN 2021hpr are overall similar to those of normal SNe Ia, but characterized by prominent detached high-velocity features (HVFs) of Si ii and Ca ii in the early phase. After examining a small sample of well-observed normal SNe Ia, we find that the HVFs are likely common for the subgroup with early excess emission. The association of an early bump feature with the HVFs could be attributed to density or abundance enhancement at the outer layer of the exploding star, likely as a result of interactions with companion/CSM or experiencing more complete burning. Nevertheless, the redshifted Fe ii and Ni ii lines in the nebular-phase spectra of SN 2021hpr, contrary to the blueshift trend seen in other SNe Ia showing early bump features, indicate its peculiarity in the explosion that remains to be understood.
Original content from this work may be used under the terms of the Creative Commons Attribution 4.0 licence. Any further distribution of this work must maintain attribution to the author(s) and the title of the work, journal citation and DOI.
1. Introduction
Type Ia supernovae (SNe Ia) have been widely used as cosmological distance indicators because of their relatively high and uniform peak luminosities (e.g., M. M. Phillips 1993; A. G. Riess et al. 1996; X. Wang et al. 2005; C. R. Burns et al. 2018). Observations of SNe Ia in the local and distant Universe have led to the discovery of the accelerating expansion of the Universe (A. G. Riess et al. 1998; S. Perlmutter et al. 1999). Despite the widespread belief that SNe Ia stem from the thermonuclear explosions of carbon–oxygen (CO) white dwarfs (WDs), significant debates persist over the progenitor system and the explosive processes (S. E. Woosley et al. 1986; P. E. Nugent et al. 2011; J. S. Bloom et al. 2012; B. Wang & Z. Han 2012; M. J. Darnley et al. 2014; D. Maoz et al. 2014; S. W. Jha et al. 2019). The observed characteristics of SNe Ia exhibit a growing diversity in both photometric and spectroscopic measurements over time, and subclassifying them can enhance the precision of distance measurements (X. Wang et al. 2009, 2013; S. Taubenberger 2017).
The nature of the donor star to the WD remains unclear, with any luminous red giant companion being excluded for the well-known nearby object SN 2011fe (W. Li et al. 2011a). Two popular models for progenitor systems include the single-degenerate (SD) scenario, where the CO WD accretes material from a nondegenerate companion star and is triggered to produce a thermonuclear explosion when its mass is close to the Chandrasekhar-mass limit (S. Chandrasekhar 1957; J. Whelan & I. Iben 1973; K. Nomoto 1982; B. Wang et al. 2009), and the double-degenerate (DD) scenario, where the companion star is another WD—either the dynamic merger or collision of two WDs triggers a runaway thermonuclear explosion (I. Iben & A. V. Tutukov 1984; R. F. Webbink 1984; R. Pakmor et al. 2012; D. Kushnir et al. 2013). In the SD case, hydrogen- or helium-rich circumstellar matter (CSM) is expected to exist around the progenitor system. Interactions of SN Ia ejecta with CSM have been reported for a few objects as support for the SD scenario (B. Dilday et al. 2012; K. Maguire et al. 2013; J. M. Silverman et al. 2013; M. Hu et al. 2023); however, the absence of hydrogen features in the nebular spectra of SNe Ia is still a challenge for the SD model (K. Maguire et al. 2013, 2016; J. M. Silverman et al. 2013; M. A. Tucker et al. 2020; G. Lim et al. 2023). In the DD case, a few explosion mechanisms have been proposed, including dynamical merger (steady accretion from the secondary WD), double detonation (the detonation of He on the primary WD surface triggers a carbon detonation in its core), violent merger of two WDs, and a head-on collision as the detonation could be triggered directly by shock ignition, rather than the propagation and acceleration of any subsonic deflagration burning front (S. E. Woosley et al. 1986; L. Bildsten et al. 2007; R. Pakmor et al. 2010; D. Kushnir et al. 2013). In dynamical mergers, if the accretion rate is high enough to ignite carbon, then the WD may collapse to a neutron star instead of becoming an SN Ia explosion. However, the exact explosion physics and progenitor systems of SNe Ia are still unclear (B. Wang & Z. Han 2012; X. Wang et al. 2013; D. Maoz et al. 2014; S. Taubenberger 2017; S. W. Jha et al. 2019; M. A. Tucker et al. 2020; K. Maeda 2022).
Observationally, ∼70% of SNe Ia can be classified as spectroscopically normal SNe Ia (D. Branch et al. 1993; W. Li et al. 2011b), while the remaining 30% can be categorized into different kinds of peculiar subclasses, such as overluminous SN 1991T–like, subluminous SN 1991bg–like, and low-luminosity SN 2002cx–like SNe Ia (A. V. Filippenko et al. 1992a, 1992b; B. Leibundgut et al. 1993; A. V. Filippenko 1997; W. Li et al. 2003b; R. J. Foley et al. 2013). According to the velocity gradient of Si ii λ6355, S. Benetti et al. (2005) divided SNe Ia into three subclasses: the high-velocity gradient (HVG), the low-velocity gradient (LVG), and the FAINT SNe Ia, which are similar to the SN 1991bg–like. Based on the minimum velocity measured from Si ii λ6355 absorption at around the B-band maximum light, X. Wang et al. (2009) classified normal SNe Ia into two subclasses: normal-velocity (NV) and high-velocity (HV). This classification reveals that even Branch-normal SNe Ia should have different progenitor populations (X. Wang et al. 2013).
Very early time photometric and spectroscopic observations of SNe Ia provide additional important constraints on their progenitor properties. Theoretically, D. Kasen (2010) predicted that, in the SD scenario, the SN ejecta should run into the nondegenerate donor star and be heated by the shock. The shock-heated material would produce detectable optical/ultraviolet (UV) emission lasting for hours to days after the explosion, depending on the size of the donor star, the preexplosion binary separation, the viewing angle, and the expansion velocity of the ejecta. On the other hand, double detonation of a CO WD and/or mixing of radioactive 56Ni into the outer region of the ejecta have been proposed to explain the “bump” in the early light curves (J.-A. Jiang et al. 2017; U. M. Noebauer et al. 2017; A. Polin et al. 2019; M. R. Magee & K. Maguire 2020).
In recent years, some wide-field and high-cadence surveys have led to the discovery of many young SNe Ia, among which a few samples are reported to show early excess emission in their light curves such as SNe 2013dy, 2019np, 2018oh, 2017cbv, 2017erp, 2020hvf, 2021aefx, and 2023bee (W. Zheng et al. 2013; Y. C. Pan et al. 2015; G. Hosseinzadeh et al. 2017; G. Dimitriadis et al. 2019; N. Levanon & N. Soker 2019; W. Li et al. 2019; B. J. Shappee et al. 2019; L. Wang et al. 2020; J.-a. Jiang et al. 2021; C. Ashall et al. 2022; J. Burke et al. 2022; H. Sai et al. 2022; G. Hosseinzadeh et al. 2023; Y. Q. Ni et al. 2023; Q. Wang et al. 2024). Based on observation simulations, the intrinsic fraction of SNe Ia YEs is estimated as  % (M. R. Magee et al. 2022).
J. Burke et al. (2022) fit the early time light curves of nine SNe Ia using the companion interaction model and suggested that three of them (SN 2017cbv, SN 2017erp, and SN 2018yu) exhibit early excesses that may result from this model, while the best-fitting parameters of SN 2019np are unusual and therefore do not confidently claim an excess. In H. Sai et al. (2022), the early time light curves of SN 2019np were reported to show an excess that can be attributed to the mixing of radioactive 56Ni (H. Sai et al. 2022). Although the early bumps seen in the light curves of SN 2017cbv can be explained by collision of the SN ejecta with the main-sequence companion, a late-time spectral analysis does not favor the presence of an H- and/or He-rich secondary star in the progenitor system (G. Hosseinzadeh et al. 2017; D. J. Sand et al. 2018). Despite the detection of an early bump in the light curve of SN 2018oh, the deep mixing of carbon in its ejecta and the lack of an H line in the nebular spectra cannot be well explained by the current SD model (G. Dimitriadis et al. 2019; W. Li et al. 2019; M. A. Tucker et al. 2019; M. L. Graham et al. 2022). K. Maguire et al. (2016) present the tentative detection of Hα emission for SN 2013ct in the late-time spectra, but the estimated mass (∼0.007 M⊙) of the stripped companion star material is much lower than expected in SD scenarios. G. Dimitriadis et al. (2019) suggested that such an early bump could be caused by the interaction of SN ejecta with a disk formed during the merger process of a WD binary system. SN 2021aefx is another SN Ia showing bump features in early optical and UV light curves, but none of current models can account for the early excess emission (G. Hosseinzadeh et al. 2022). On the other hand, some peculiar subluminous SNe Ia like iPTF 14atg (Y. Cao et al. 2015) and SN 2022vqz (G. Xi et al. 2024) are reported to show much stronger excess emission at early times relative to that seen in normal SNe Ia, which may have a different physical origin (i.e., double detonation of a sub-Chandrasekhar-mass CO WD).
SN 2021hpr is another nearby SN Ia with very early detection, providing another opportunity to constrain the progenitor physics of SN Ia from early time luminosity evolution. Although SN 2021hpr has been studied by Y. Zhang et al. (2022) and G. Lim et al. (2023), we present more extensive photometric and spectroscopic observations in this paper, allowing us to conduct a more thorough analysis of its progenitor properties. The optical observations and data reduction are given in Section 2. Section 3 describes the evolution of light and color curves, while the optical spectra are presented in Section 4. The quasi-bolometric light curve and late-time spectra are discussed in Section 5, and we summarize in Section 6.
2. Observations and Data Reduction
2.1. Discovery and Host Galaxy
SN 2021hpr was discovered by Koichi Itagaki on 2021 April 2.4489 (MJD 59306.4489; UTC dates are used throughout this paper) with an unfiltered brightness of 17.7 mag (K. Itagaki 2021). Its J2000 coordinates are α = 10h16m38 68 and
  , located ∼224
 5 east and ∼1
 1 north of the center of the barred spiral galaxy NGC 3147. Prediscovery detection can be traced back to 2021 March 31.92 (MJD 59304.92), about 1.52 days earlier than the discovery date, obtained with the Ritchey-Chrétien 600 60 cm telescope of the Caucasian Mountain Observatory at B ≈ 19.35 mag (G. Lim et al. 2023). This SN was classified as a young SN Ia according to a spectrum taken by the Asiago Ekar Telescope (L. Tomasella et al. 2021) at ∼1.07 days after the discovery. Figure 1 shows a finder chart of SN 2021hpr and its host galaxy.

Figure 1. B-band image of SN 2021hpr taken with the NOWT on 2021 April 27.88. The red square represents the SN, while numbers indicate the reference stars used for photometry. North is up, and east is to the left.
Download figure:
Standard image High-resolution imageThe host galaxy NGC 3147 is an SA(rs)bc galaxy (G. de Vaucouleurs et al. 1991), at redshift z = 0.009346 (B. Epinat et al. 2008), which harbored six known SN explosions over the past ∼50 yr, including SN 1972H (SN Ia, F. Patat et al. 1997), SN 1997bq (SN Ia, S. Jha et al. 2006), SN 2006gi (SN Ib, G. Duszanowicz 2006), SN 2008fv (SN Ia, I. Biscardi et al. 2012), SN 2021do (SN Ic, O. Voziakova et al. 2021), and SN 2021hpr. The birth rate of SNe Ia seems to be unusually high in NGC 3147 (I. Biscardi et al. 2012; Y. Zhang et al. 2022).
2.2. Photometry
Our follow-up observations of SN 2021hpr were conducted with a few telescopes, including the Las Cumbres Observatory (LCO) 1 m telescope network (A. Shporer et al. 2011; T. M. Brown et al. 2013), the 0.76 m Katzman Automatic Imaging Telescope (KAIT) as part of the Lick Observatory Supernova Search (A. V. Filippenko et al. 2001), and the Nanshan One-meter Wide-field Telescope (NOWT) at Nanshan Station of the Xinjiang Astronomical Observatory (C.-H. Bai et al. 2020). Some of the data are from the Global Supernova Project. The NOWT is equipped with a 4k × 4k pixel CCD camera, with a field of view that covers 1 6 × 1
6 × 1 6. Its observations of SN 2021hpr were conducted in the UBV bands during the period from ∼5 to ∼53 days after the explosion. The images were processed with the the Image Reduction and Analysis Facility (IRAF) package,26
which includes bias subtraction and flat-field correction. The instrumental magnitudes were determined using the SExtractor software (E. Bertin & S. Arnouts 1996).
6. Its observations of SN 2021hpr were conducted in the UBV bands during the period from ∼5 to ∼53 days after the explosion. The images were processed with the the Image Reduction and Analysis Facility (IRAF) package,26
which includes bias subtraction and flat-field correction. The instrumental magnitudes were determined using the SExtractor software (E. Bertin & S. Arnouts 1996).
KAIT obtained BVRI-band images, as well as Clear (close to the R band; see W. Li et al. 2003a) images. All images were reduced using a custom pipeline27 detailed by B. E. Stahl et al. (2019). Point-spread function photometry was obtained using DAOPHOT (P. B. Stetson 1987) from the IDL Astronomy User’s Library.28 Several nearby stars were chosen from the Pan-STARRS129 catalog for calibration; their magnitudes were first transformed into Landolt (J. L. Clem & A. U. Landolt 2016) magnitudes using the empirical prescription presented by Equation (6) of J. L. Tonry et al. (2012), and then transformed to the KAIT natural system. The apparent magnitudes were all measured in the KAIT4 natural system, and the final results were transformed into the standard system using the local calibrator and the color terms for KAIT4 (see B. E. Stahl et al. 2019).
LCO observations sampled the UBVgri bands, covering the phases from ∼1 to ∼80 days. To reduce the images, we utilize both lcogtsnpipe (S. Valenti et al. 2016) and a PyRAF-based pipeline that includes bias subtraction, flat-field correction, and SN flux measurement. The instrumental magnitudes obtained by LCO and NOWT are calibrated using the AAVSO Photometric All-Sky Survey (APASS)30 catalog (A. Henden 2016). The local reference stars with photometric magnitudes from the APASS catalog are listed in Table 1 and labeled in Figure 1. The U-band instrumental magnitudes were converted to those of the standard Johnson UBV system, based on the transformation correlations established through Landolt standard stars observed on photometric nights using NOWT (J. L. Clem & A. U. Landolt 2016).
Table 1. Local Reference Stars in the SN 2021hpr Field from the APASS Cataloga
| Star | α (J2000) | δ (J2000) | B | V | g | r | i |
|---|---|---|---|---|---|---|---|
| (mag) | (mag) | (mag) | (mag) | (mag) | |||
| 1 | 154.06203 | 73.38566 | 13.903(026) | 13.554(066) | 13.832(191) | 13.505(140) | 13.472(193) |
| 2 | 154.02423 | 73.45025 | 15.634(065) | 14.920(070) | 15.397(181) | 14.688(125) | 14.472(160) |
| 3 | 154.11455 | 73.49906 | 16.091(023) | 15.295(068) | 15.779(174) | 15.097(103) | 14.810(169) |
| 4 | 154.27259 | 73.45459 | 13.268(029) | 12.544(069) | 13.012(180) | 12.351(128) | 12.185(173) |
| 5 | 154.25859 | 73.33306 | 15.709(084) | 15.051(090) | 15.489(187) | 14.855(129) | 14.583(166) |
| 6 | 154.35740 | 73.37931 | 14.815(023) | 14.132(078) | 14.568(180) | 13.952(123) | 13.816(191) |
| 7 | 154.37454 | 73.40489 | 16.627(125) | 15.965(027) | 16.448(163) | 15.814(183) | 15.631(161) |
| 8 | 154.44091 | 73.39899 | 16.761(114) | 16.061(014) | 16.563(203) | 15.819(091) | 15.668(145) |
| 9 | 153.85333 | 73.43334 | 15.709(049) | 14.748(093) | 15.354(178) | 14.368(140) | 14.054(173) |
| 10 | 153.85693 | 73.44261 | 16.127(103) | 15.638(052) | 15.952(225) | 15.457(124) | 15.245(146) |
| 11 | 153.80875 | 73.36343 | 14.690(046) | 14.129(071) | 14.524(186) | 13.971(122) | 13.863(200) |
| 12 | 154.58534 | 73.44488 | 15.702(028) | 15.273(096) | 15.587(182) | 15.216(131) | 15.032(047) |
Note. aUncertainties are in units of 0.001 mag. See Figure 1 for the locations of reference stars.
Download table as: ASCIITypeset image
This SN was also monitored by the 0.35 m telescope of Itagaki Astronomical Observatory (IAO) in the Clear band, covering the phases from ∼2 to ∼14 days. Photometry was extracted using Astrometrica (H. Raab 2012) and calibrated to the fourth CCD Astrograph Catalog of the US Naval Observatory (N. Zacharias et al. 2013). The photometric datasets are listed in Appendix Tables A1–A3.
No template subtraction is applied to the NOWT, KAIT, LCO, and IAO images in the photometry, because the SN locates relatively far away from the center of its host galaxy. In addition, we included the Zwicky Transient Facility (ZTF) gr-band data31 as well as the ATLAS cyan- and orange-band data (J. L. Tonry et al. 2018) in our analysis, covering the phases from ∼1 to ∼266 days.
2.3. Spectroscopy
A total of 33 low-resolution optical spectra of SN 2021hpr, covering the phases from ∼−15 to ∼+288 days after B-band maximum light, were collected using the LCO 2 m Faulkes Telescope North (FTN; T. M. Brown et al. 2013), the YFOSC on the Lijiang 2.4 m telescope (LJT; C.-J. Wang et al. 2019) of Yunnan Astronomical Observatories, the BFOSC mounted on the Xinglong 2.16 m telescope (XLT; X. Jiang et al. 1999; Z. Fan et al. 2016; J.-C. Zhang et al. 2016), and the Kast spectrograph on the Lick 3 m Shane telescope (B. E. Stahl et al. 2020). Another nebular-phase spectrum was obtained on 2022 January 31 with the Low-Resolution Imaging Spectrometer (LRIS) mounted on the Keck 10 m telescope (J. B. Oke et al. 1995). See Table 2 for the journal of spectral observations. We used the standard IRAF routines and performed flux calibration with spectrophotometric standard stars observed with similar air masses. We further applied atmospheric extinction corrections and telluric absorption corrections to all spectra. We also included nine public spectra from the Weizmann Interactive Supernova Data Repository (WISeREP) in the analysis, including six from XLT (previously published in Y. Zhang et al. 2022) and three posted on Transient Name Server, obtained with the Schmidt–Cassegrain Telescope (SCT, Meade 10″), the ALPY 200 telescope at Three Hills Observatory (THO), and the Liverpool Telescope (LT).
Table 2. Log of Spectroscopic Observations of SN 2021hpr
| MJD | Telescope/Instrument | Epocha | λstart–λend | Δλ |
|---|---|---|---|---|
| (days) | (Å) | (Å) | ||
| 59307.23 | LCO/FTN | −14.88 | 3500.44–9999.81 | 2.29 |
| 59307.52 | XLT/BFOSCb | −14.59 | 3701.35–8847.19 | 2.79 |
| 59307.93 | THO/ALPY200b | −14.18 | 4004.12–7699.96 | 4.70 |
| 59308.01 | LT/SPRATb | −14.11 | 4020.00–7966.80 | 9.20 |
| 59309.30 | Lick/Kast | −12.81 | 3620.00–10,720.00 | 2.00 |
| 59310.50 | XLT/BFOSC | −11.61 | 3863.83–8824.22 | 2.77 |
| 59311.50 | XLT/BFOSC | −10.61 | 3859.70–8838.58 | 2.77 |
| 59313.50 | XLT/BFOSC | −8.61 | 3844.53–8803.51 | 2.77 |
| 59314.36 | LCO/FTN | −7.75 | 3499.47–9999.73 | 2.29 |
| 59316.50 | XLT/BFOSC | −5.61 | 3856.20–8816.73 | 2.77 |
| 59317.23 | LCO/FTN | −4.88 | 3500.37–9999.64 | 2.29 |
| 59317.58 | XLT/BFOSCb | −4.53 | 3702.04–8844.84 | 2.72 |
| 59319.17 | Lick/Kast | −3.94 | 3620.00–10,750.00 | 2.00 |
| 59320.23 | LCO/FTN | −1.88 | 3499.93–9999.93 | 2.29 |
| 59322.16 | Lick/Kast | +0.05 | 3632.00–10,660.00 | 2.00 |
| 59323.23 | LCO/FTN | +1.12 | 3500.49–10,000.20 | 2.29 |
| 59323.50 | XLT/BFOSC | +1.39 | 3861.65–8819.92 | 2.77 |
| 59323.92 | SCT Meade 10″/SN Specb | +1.81 | 3897.84–7152.43 | 1.36 |
| 59324.09 | LJT/YFOSC | +1.98 | 3503.49–8766.44 | 2.83 |
| 59328.24 | LCO/FTN | +6.13 | 3500.44–10,000.76 | 2.29 |
| 59329.50 | XLT/BFOSC | +7.39 | 3869.36–8836.11 | 2.77 |
| 59333.50 | XLT/BFOSC | +11.39 | 3869.36–8836.11 | 2.77 |
| 59335.50 | XLT/BFOSCb | +13.39 | 3702.39–8859.43 | 2.72 |
| 59336.23 | MMT/Binospec | +14.12 | 5206.00–7702.00 | 0.37 |
| 59336.50 | XLT/BFOSC | +14.39 | 3869.36–8835.04 | 2.77 |
| 59343.14 | MMT/Binospec | +21.03 | 5688.00–7209.00 | 0.37 |
| 59344.25 | LCO/FTN | +22.14 | 3499.93–10,000.00 | 2.29 |
| 59344.54 | XLT/BFOSCb | +22.43 | 3700.07–8859.75 | 2.72 |
| 59347.13 | MMT/Binospec | +25.02 | 5206.00-7702.00 | 0.37 |
| 59352.50 | XLT/BFOSC | +30.39 | 3875.51–8838.16 | 2.77 |
| 59363.29 | LCO/FTN | +41.18 | 3500.39–9999.81 | 2.29 |
| 59368.58 | XLT/BFOSCb | +46.47 | 3700.17–8860.31 | 2.72 |
| 59369.50 | XLT/BFOSC | +47.39 | 3869.23–8834.72 | 2.77 |
| 59385.56 | XLT/BFOSCb | +63.45 | 3700.37–8858.61 | 2.72 |
| 59585.32 | Lick/Kast | +263.21 | 3622.00–10,380.00 | 2.00 |
| 59610.50 | Keck/LRIS | +288.39 | 3166.31–10,265.62 | 0.62 |
Notes. aRelative to the date of B-band maximum brightness (MJD = 59322.11). bData from WISeREP.
Download table as: ASCIITypeset image
3. Photometric Properties
3.1. Optical Light Curves
The multiband optical light curves of SN 2021hpr are presented in the left panel of Figure 2, with a shoulder feature in r and a secondary maximum in i like normal SNe Ia. Applying polynomial fits to the near-maximum-light curves, we estimate the peak magnitudes and the corresponding time in all bands; the relevant results are listed in Table 3. Around the maximum light, the B-band light curve reached a peak of 14.11 ± 0.04 mag on MJD = 59322.11 ± 0.58, with a postpeak decline measured as Δm15(B) = 1.00 ± 0.01 mag within the first 15 days after the peak (M. M. Phillips et al. 1999). The V-band light curve reaches a peak of 14.12 ± 0.03 mag on MJD = 59322.98 ± 0.61, later than the B-band peak by 0.87 day. We also use the SuperNovae in object-oriented Python (SNooPy2; C. R. Burns et al. 2011, 2014) light-curve fitter to fit the light curves. The best-fit results are presented in the right panel of Figure 2. The color stretch parameter sBV (C. R. Burns et al. 2014) is measured to be 1.02 ± 0.03. In summary, SN 2021hpr has a standard light-curve morphology in optical bands, and the parameters inferred from our observations agree well with those estimated by Y. Zhang et al. (2022) and G. Lim et al. (2023).
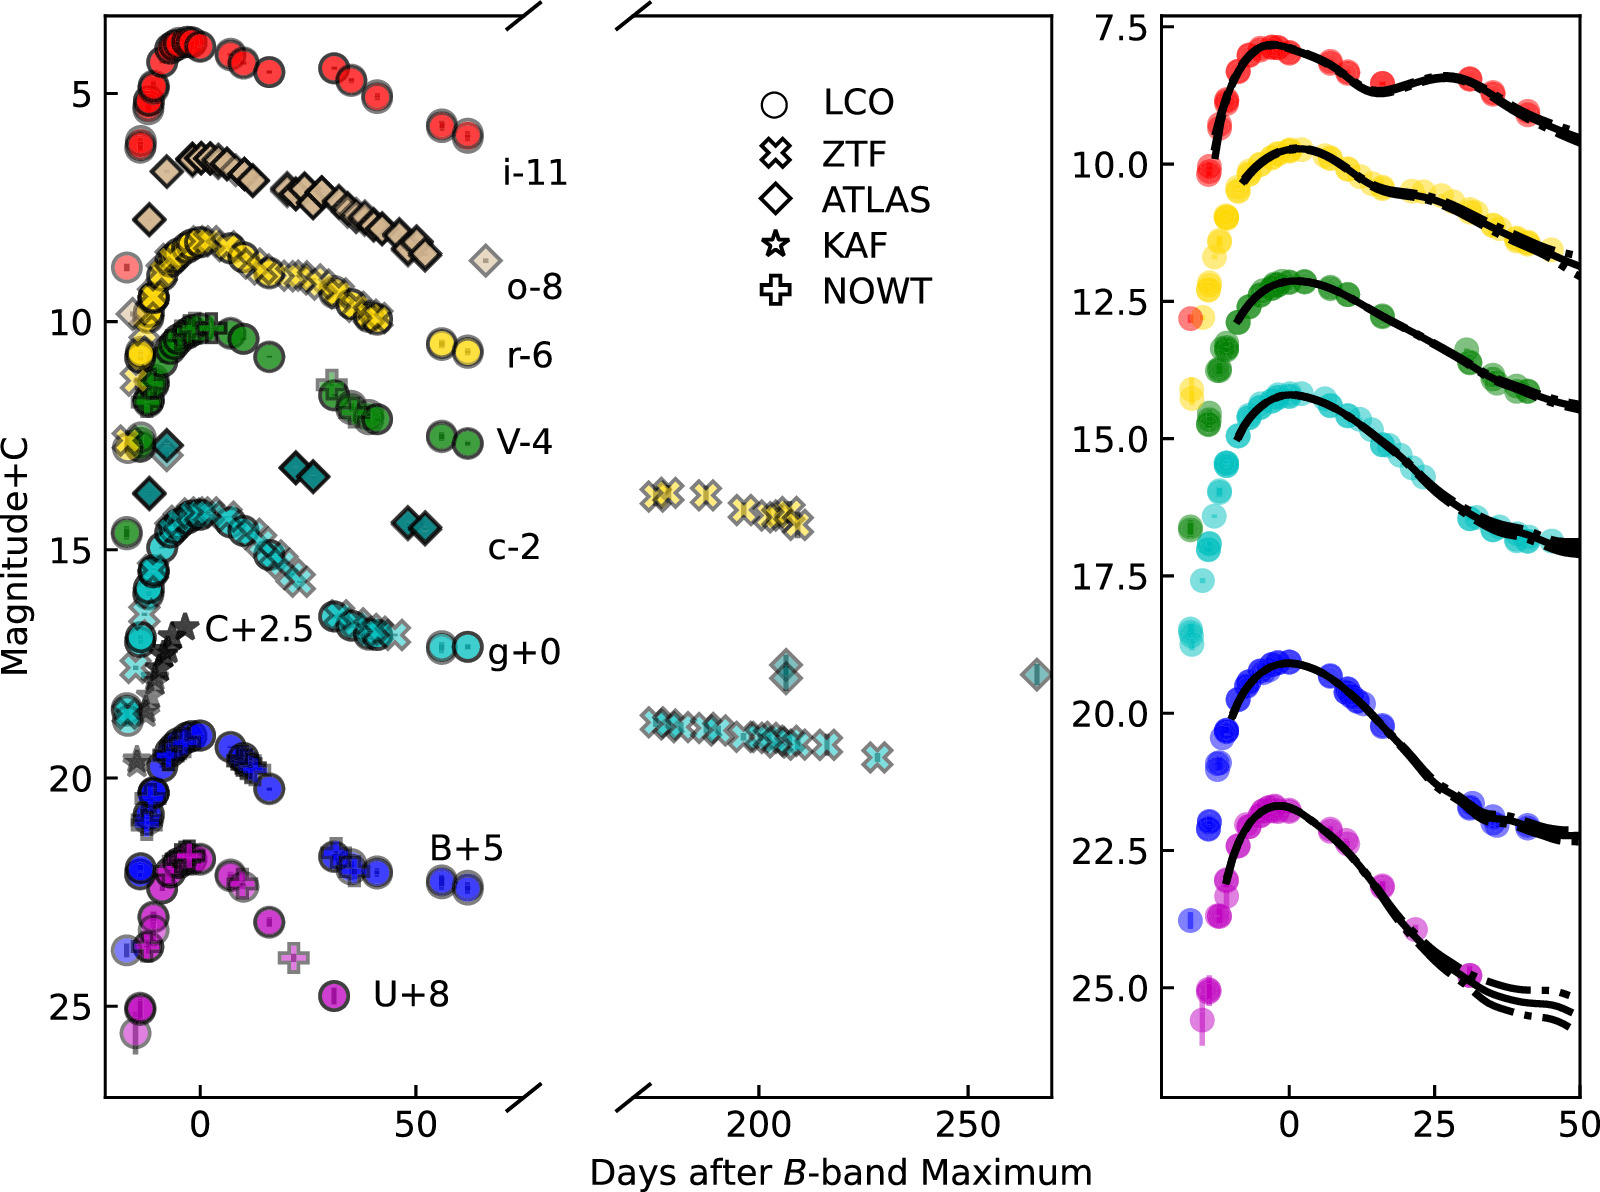
Figure 2. Left panel: multiband light curves of SN 2021hpr, which are shifted vertically for better clarity. Right panel: Fitting to the observed light curves with the SNooPy2+ Max model. The dashed lines represent 1σ uncertainties of the best fits.
Download figure:
Standard image High-resolution imageTable 3. Peak Magnitudes and Corresponding Time Estimated from Polynomial Fits to the Observed Light Curves of SN 2021hpr
| Filter | U | B | V | g | r | i |
|---|---|---|---|---|---|---|
| MJD | 59321.46 ± 0.76 | 59322.11 ± 0.58 | 59322.98 ± 0.61 | 59323.38 ± 0.11 | 59322.72 ± 0.39 | 59319.81 ± 0.20 |
| Peak (mag) | 13.61 ± 0.04 | 14.11 ± 0.04 | 14.12 ± 0.03 | 14.20 ± 0.05 | 14.24 ± 0.02 | 14.83 ± 0.02 |
Download table as: ASCIITypeset image
In Figure 3, we compare the UBVgri-band light curves of SN 2021hpr with those of well-observed normal SNe Ia, including SN 2013dy, SN 2021aefx, SN 2023bee, SN 2017erp, SN 2019np, SN 2017cbv, SN 2011fe, SN 2018gv, SN 2015F, and SN 2017hpa (see Table 4). The former six objects serve as representatives of those exhibiting early flux excess in the early phase after the explosion, whereas the latter represents those without early excess emission. The light-curve evolution of SN 2021hpr resembles that of those SNe Ia displaying early flux excess, especially SN 2019np and SN 2021aefx. G. Hosseinzadeh et al. (2022) and Y. Q. Ni et al. (2023) suggested that SN 2021aefx shows a prominent red excess at early times. Section 5.3 will discuss the early excess features detected in SN 2021hpr.
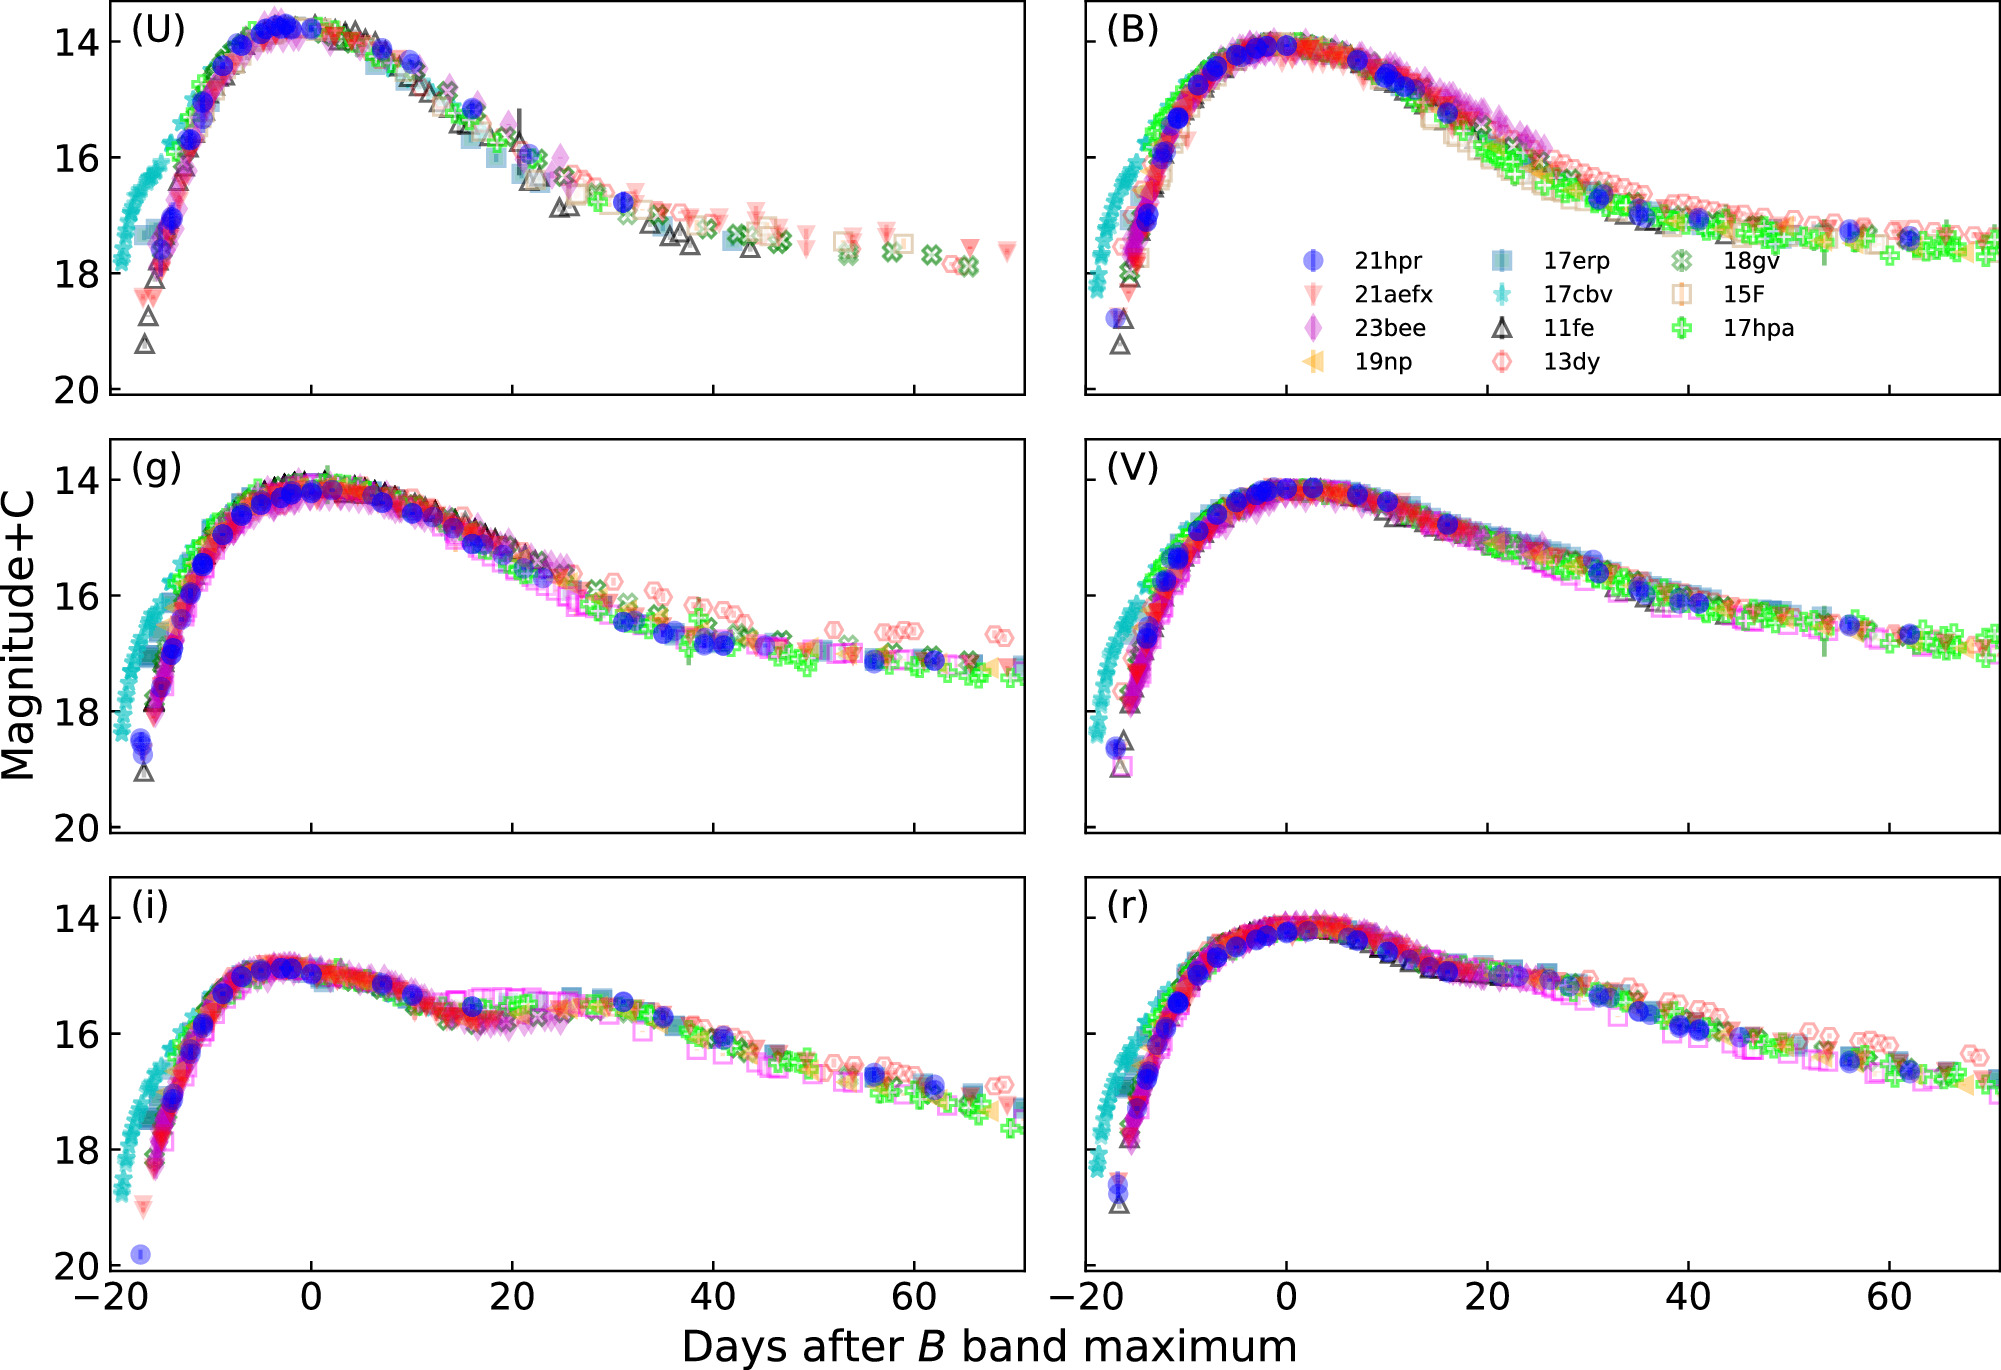
Figure 3. Comparison of the optical light curves of SN 2021hpr with those of other well-observed SNe Ia. The filled symbols represent SNe Ia with early excess emission, while the open symbols represent those without prominent excess emission. The light-curve peaks of comparison SNe Ia have been normalized to those of SN 2021hpr.
Download figure:
Standard image High-resolution imageTable 4. Comparison SNe with SN 2021hpr
| SN | Δm15(B) | Early Excess | References |
|---|---|---|---|
| SN 2021aefx | 0.90 ± 0.02 | yes | G. Hosseinzadeh et al. (2022) |
| SN 2023bee | 0.75 ± 0.03 | yes | G. Hosseinzadeh et al. (2023) |
| SN 2017erp | 1.05 ± 0.06 | yes | P. J. Brown et al. (2019), J. Burke et al. (2022) |
| SN 2019np | 1.05 ± 0.04 | yes | H. Sai et al. (2022) |
| SN 2017cbv | 0.88 ± 0.07 | yes | J. Wee et al. (2018) |
| SN 2013dy | 0.89 ± 0.01 | yes | Y. C. Pan et al. (2015), W. Zheng et al. (2013) |
| SN 2011fe | 1.18 ± 0.08 | no | K. Zhang et al. (2016), U. Munari et al. (2013) |
| SN 2018gv | 0.96 ± 0.05 | no | Y. Yang et al. (2020), J. Burke et al. (2022) |
| SN 2015F | 1.35 ± 0.03 | no | R. Cartier et al. (2017) |
| SN 2017hpa | 1.02 ± 0.07 | no | X. Zeng et al. (2021a) |
Download table as: ASCIITypeset image
3.2. Reddening and Colors
The Galactic reddening toward the line of sight of SN 2021hpr is E(B − V) ≈ 0.021 mag (E. F. Schlafly & D. P. Finkbeiner 2011). The host-galaxy reddening inferred from the EBV model of SNooPy2 gives E(B − V)host = 0.06 ± 0.06 mag. Based on the intrinsic B − V color distribution of normal SNe Ia (X. Wang et al. 2009; M. M. Phillips et al. 1999), the E(B − V)host is estimated as 0.054 ± 0.015 mag. A lower reddening is also consistent with the observation that SN 2021hpr is located far from the arms and disk of NGC 3147. Thus, a total E(B − V)total = 0.08 ± 0.06 mag is taken for SN 2021hpr. This value agrees well with the estimate from G. Lim et al. (2023), E(B − V)total = 0.10 mag. Figure 4 shows the reddening-corrected color curves of SN 2021hpr, overplotted with those of some well-observed objects (same as in Figure 3).
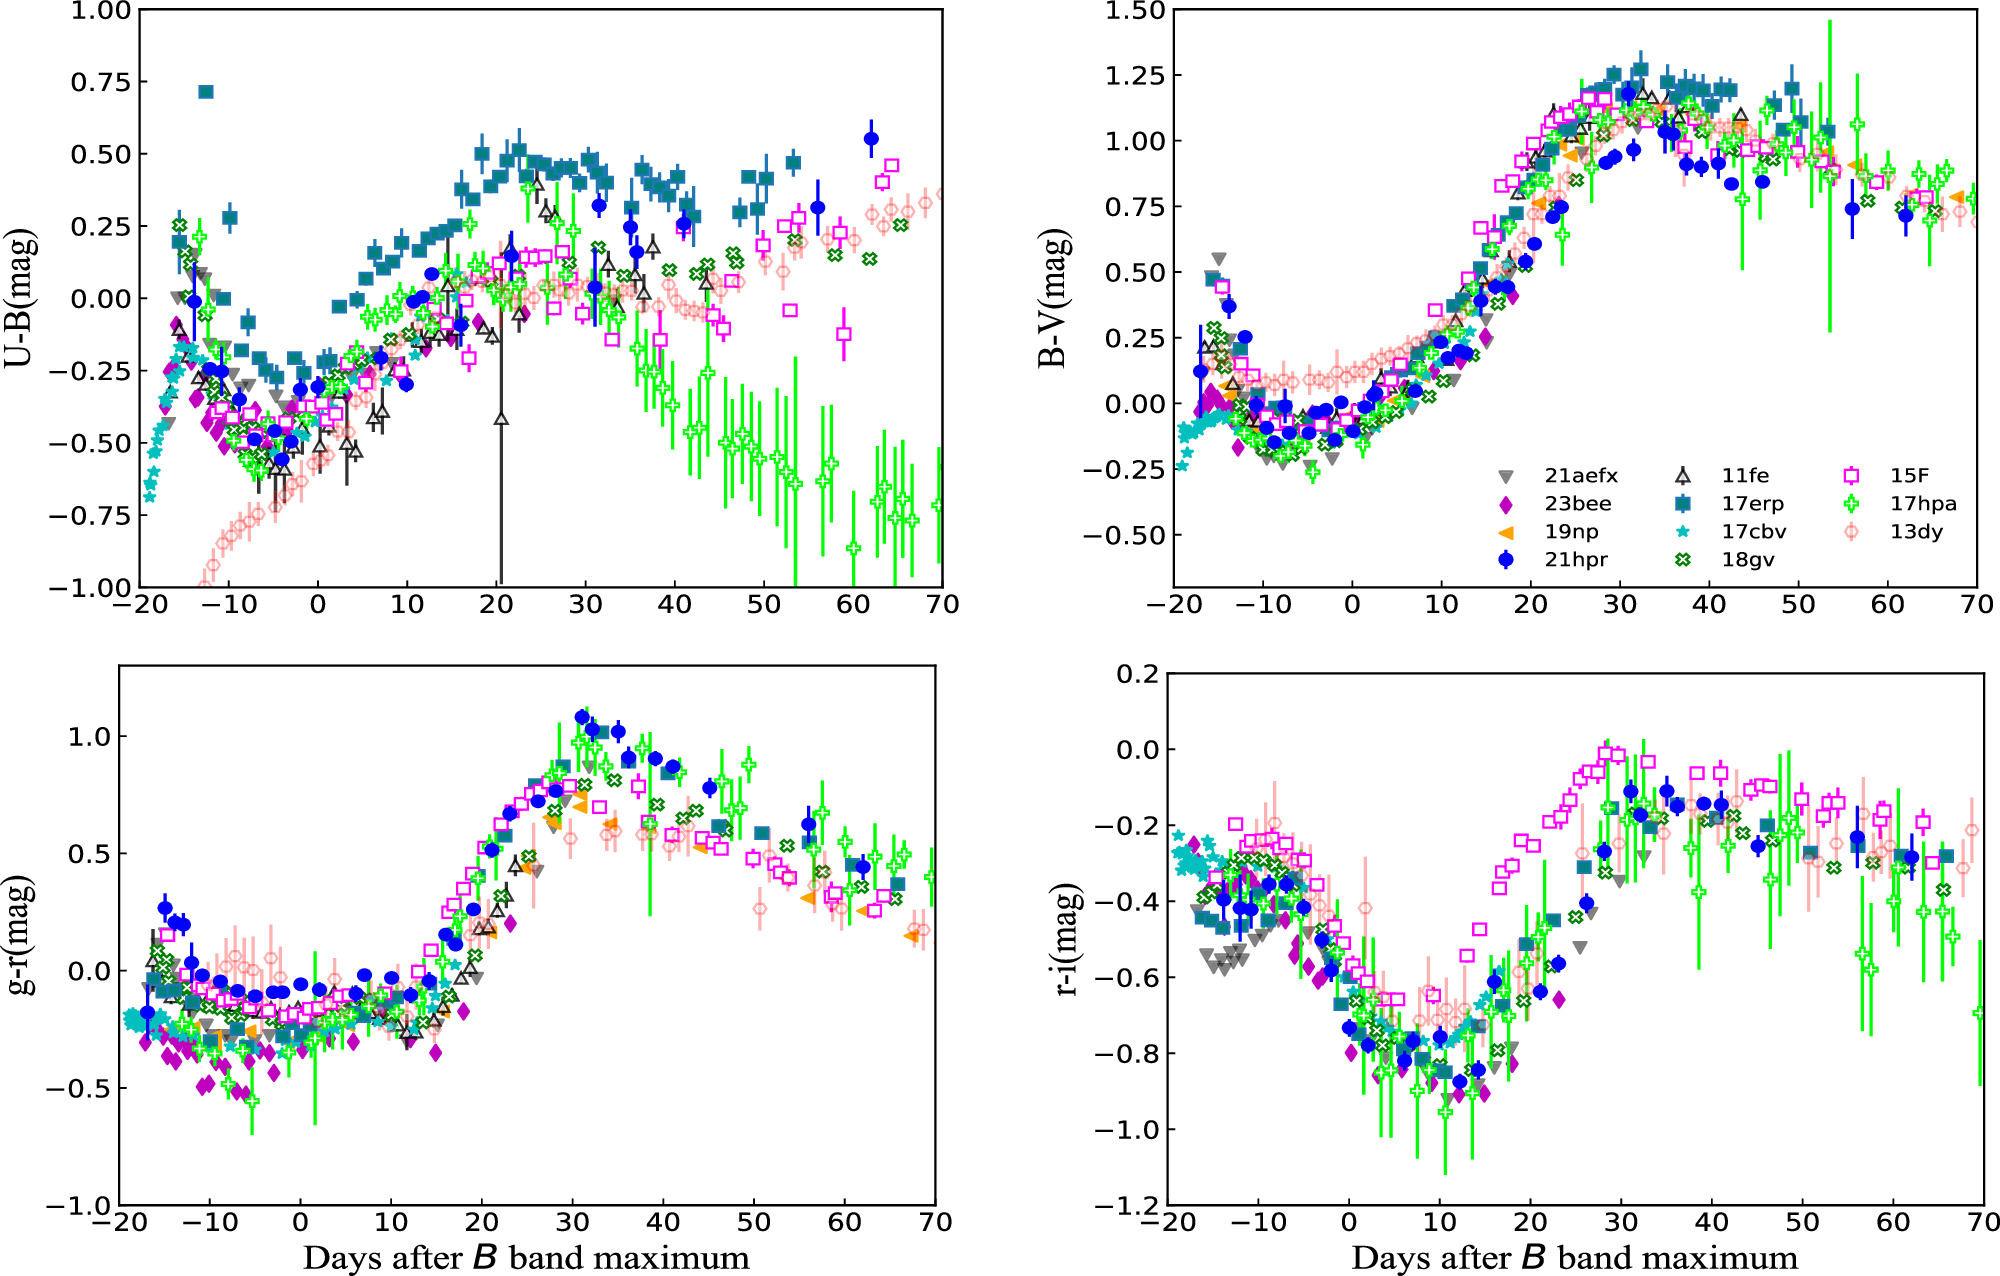
Figure 4. Comparison of the reddening-corrected U − B, B − V, g − r, and r − i color curves of SN 2021hpr and a few well-studied SNe Ia. The comparison sample are the same as in Figure 3.
Download figure:
Standard image High-resolution image3.3. First-light Time
The very early light curves can be used to constrain the first-light time and the rise time. The prediscovery detection of SN 2021hpr at MJD 59304.92 reported by D. Y. Tsvetkov et al. (2021) suggests that the explosion time of SN 2021hpr should be earlier than this epoch. The last nondetection from ZTF is MJD 59303.3452, with an upper limit of 19.77 mag in the r band. To estimate the first-light time of SN 2021hpr, an expanding fireball model ( ; A. G. Riess et al. 1999) is adopted to fit the early time gri-band light curves, as shown in Figure 5. Considering the early excess of SN 2021hpr, we fit the data from t ∼ 2 to t ∼ 8 days after the explosion. The first-light time is derived as MJD 59304.16 ± 0.97 days, with best-fit index n = 2.38, 2.05, and 2.08 in g, r, and i band, respectively. This indicates that our first observation began at t ∼ 1.1 days after the SN explosion. As a result, the rise time is estimated as 17.95 ± 1.13 days in B for SN 2021hpr, comparable to that of typical SNe Ia (W. Zheng et al. 2017).
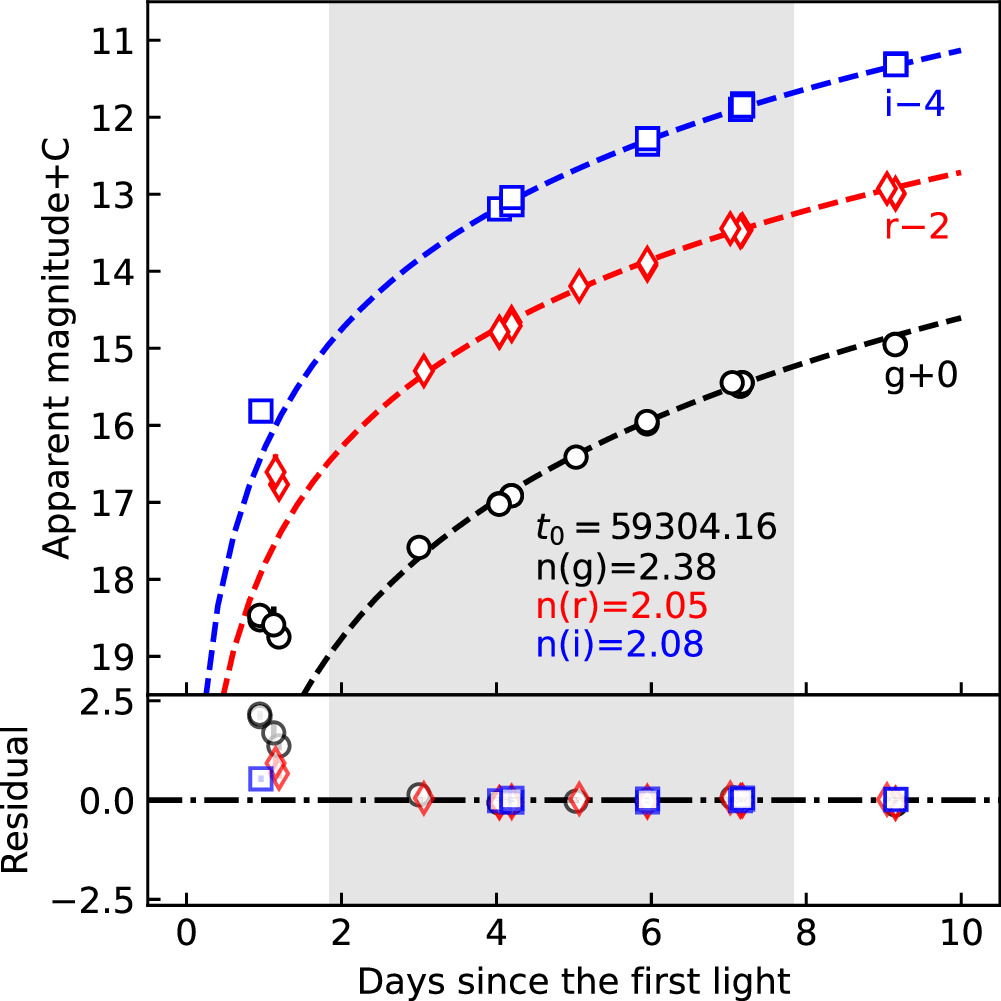
Figure 5. Upper panel: fitting to the early phase light curves of SN 2021hpr using the fireball model. Bottom panel: the residuals relative to the best-fit curves. The gray area represents the data used for the fit, ranging from t ∼ 2 to 8 days after explosion.
Download figure:
Standard image High-resolution image4. Optical Spectra
The spectral evolution sequence of SN 2021hpr, with nearly daily sampling before the maximum light, is shown in Figure 6. Strong absorption features are clearly visible near λ5950 and λ8150 in the early phase, but they become weak and redshifted quickly a few days later, which can be due to the presence of high-velocity features (HVFs) of the Si ii and Ca ii lines, respectively. Both carbon and oxygen absorption features are invisible or barely detectable in the spectra of SN 2021hpr, suggesting that the progenitor should have experienced a more complete burning during the explosion. The detailed spectral evolution will be discussed in the following subsections.

Figure 6. Optical spectral evolution of SN 2021hpr. All spectra have been corrected for reddening and host-galaxy redshift. The epochs shown on the right of the spectra represent the phases in days relative to the B-band maximum light (MJD 59322.11). The colors of the spectra represent data from different instruments.
Download figure:
Standard image High-resolution image4.1. Temporal Evolution
In Figure 7, we compare the spectra of SN 2021hpr with those of other well-observed SNe Ia with similar Δm15(B) at t ≈ −14, −7, 0, and +21 days from the maximum light. At t ∼ −14 days, the main spectral features are overall similar to those of the comparison SNe Ia (see Figure 7(a)), while SN 2021hpr has relatively broader absorption near ∼4600 Å and larger ejecta velocity at this very early phase. The C ii λ6580 absorption feature is not visible in SN 2021hpr, while it is prominent in SN 2017erp and SN 2017hpa. At this early phase, the HVFs of Ca ii near-IR (NIR) triplet are prominent in SN 2021hpr, SN 2017erp, and SN 2011fe, while they are weaker in SN 2017hpa and SN 2017cbv. The HVF of Si ii λ6355 absorption is also clearly seen in SN 2021hpr, while it is much less significant in the comparison objects, as shown in Figure 7(a).
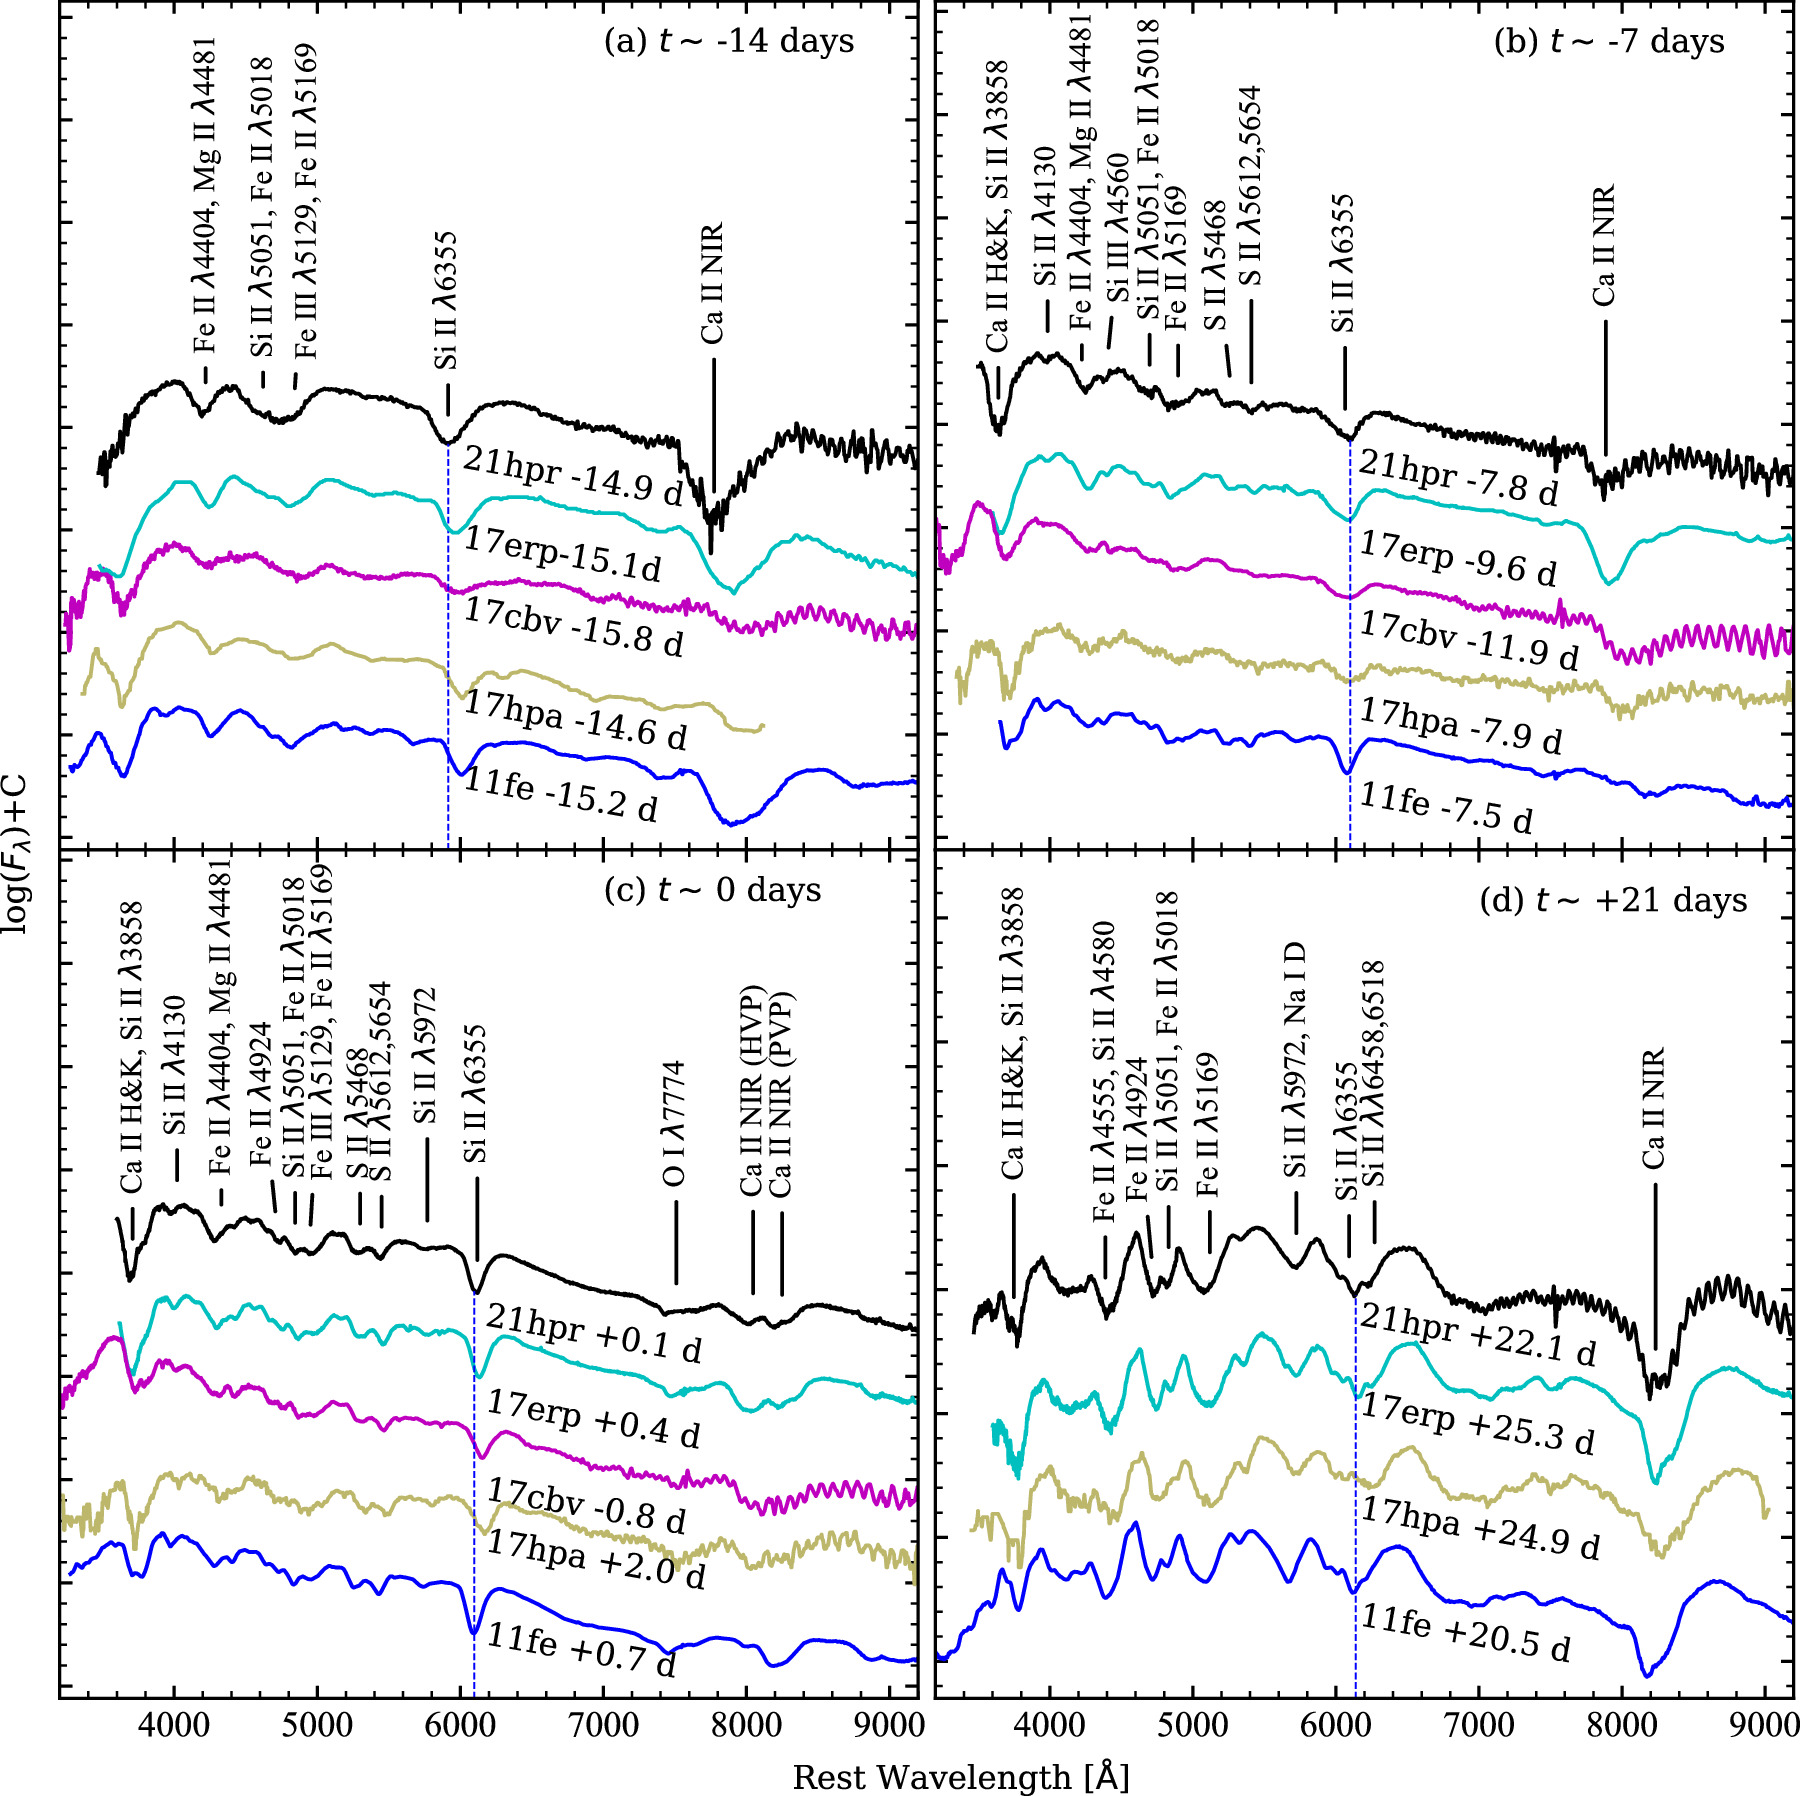
Figure 7. Spectral evolution of SN 2021hpr and the comparison SNe Ia at t ≈ −14, −7, 0, and +21 days relative to the B-band peak. All these spectra are shifted vertically for better clarity. The vertical dashed blue line marks the Si ii 6355 Å absorption minima in the spectra of SN 2021hpr.
Download figure:
Standard image High-resolution imageAt ∼1 weeks before maximum light (Figure 7(b)), the spectral features of SN 2021hpr become more similar to those of the comparison SNe Ia. For example, the Si ii λ4130 absorption begins to appear in the spectrum, and the “W”-shaped S ii absorption feature develops near λ5400. The blended absorption features near ∼λ4200 and ∼λ4600 become separated. In comparison, the Ca ii NIR triplet still shows relatively large differences, as indicated by the relative strength of the HVFs and photospheric components among the comparison sample. For example, the Ca II HVFs are still strong in SNe 2021hpr, 2017erp, and SN 2017cbv while they tend to disappear in SN 2017hpa and SN 2011fe.
Around the maximum light, the spectrum of SN 2021hpr shows close resemblances to that of the comparison SNe Ia (see Figure 7(c)). At this phase, the line-strength ratio R(Si ii) (P. Nugent et al. 1995), defined as the equivalent width ratio between Si ii λ5972 and Si ii λ6355 in the near-maximum-light spectrum, is measured as 0.08 ± 0.01 in SN 2021hpr. This indicates that the photospheric temperature of SN 2021hpr is relatively higher.
By t ≈ 3 weeks, the main spectral features of Ca ii H&K, Si ii, iron-group elements, and even the Ca ii NIR triplet (which shows the most diversity at early phases) become similar for SN 2021hpr and the comparison sample.
4.2. Photospheric Expansion Velocity
Spectroscopic observations of SNe Ia provide a good opportunity to probe the layered structure of the photosphere. The left panel of Figure 8 shows the evolution of the expansion velocity of SN 2021hpr measured from the absorption minimum of the Si ii λ6355 line. As a measurement of the velocity of the spectral lines of Si ii λ5972, “W”-shaped S ii was achieved by fitting a single-Gaussian function to the absorption trough of the respective lines. For the single-Gaussian fit, we employed the Monte Carlo random sampling method to derive an average error, which approximately corresponds to one standard deviation of the fit. The velocity of Si ii λ6355, Ca ii NIR triplet in the projectile is calculated by applying a multi-Gaussian fit to the corresponding absorption lines in the spectrum (X. Wang et al. 2009c; X. Zhao et al. 2015, 2016). In the first spectrum, the absorption lines of Si ii λ6355 and Si ii λ5972 are fitted with three-dimensional Gaussian functions to achieve better fitting results (see the right panel of Figure 8). Considering that the absorption line of Si ii λ5972 will affect the double Gaussian fit on the absorption line of Si ii λ6355, three Gaussian functions are used for these two lines. The solid green lines represent the profile of the Si ii λ5972. The absorption component on the left (blue line) is considered as the HV component of Si ii λ6355, with an estimated velocity of ∼25,900 km s−1 at t − 14.9 days. This velocity is about ∼6000 km s−1 larger than the photospheric velocity (red line), but about ∼4000 km s−1 smaller than the velocity of the Ca ii NIR HVF. This indicates that the HVF of Si ii λ6355 is less pronounced than that of Ca ii NIR.
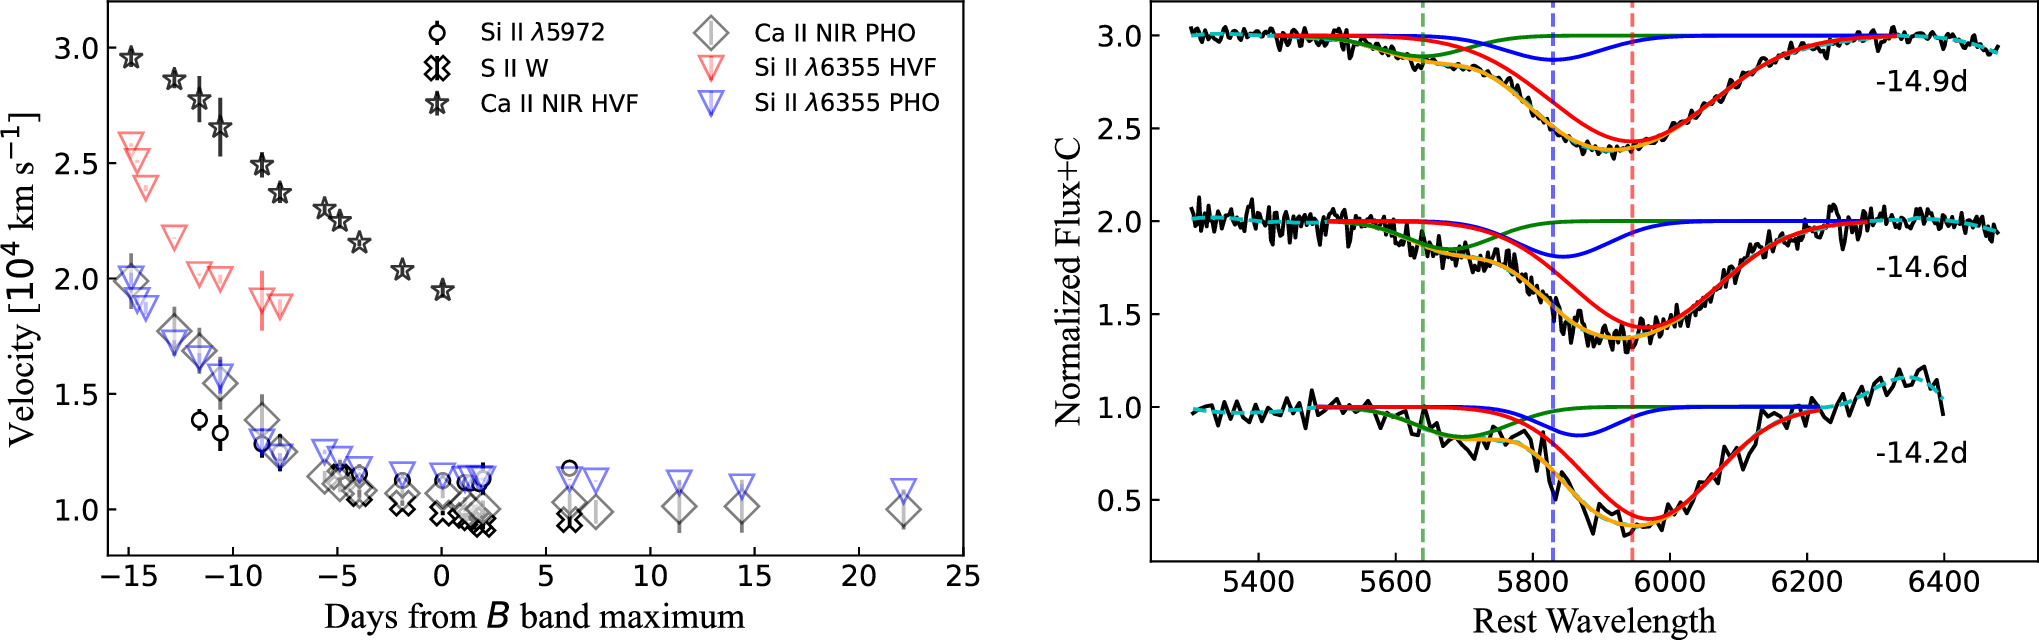
Figure 8. Left panel: expansion velocity of SN 2021hpr measured from absorption minima of Si ii λ5972, the “W”-shaped S ii, and the HVF and photospheric (PHO) components of the Si ii λ6355, and Ca ii NIR triplet. Right panel: The evolution of Si ii λ6355 in SN 2021hpr compared with the multi-Gaussian fit at ∼−14 days. Blue solid lines show the component on the blue side, and red solid lines show the component on the red side. The orange solid lines represent the best-fit curve for the observed profile, while the cyan dashed line represents the smoothed spectra. The color vertical lines represent the component minimum of each Gaussian function.
Download figure:
Standard image High-resolution imageAt t ≈ −14.9 days, the velocity inferred from Si ii λ6355 absorption is 20,000 ± 258 km s−1, which is similar to that of SN 2017erp (∼20,000 km s−1 at ∼−16 days; P. J. Brown et al. 2019), and much higher than that of SN 2011fe (∼15,900 km s−1 at t = −16.0 days; K. Zhang et al. 2016). At t ≈ 0 days, the Si ii velocity of SN 2021hpr drops to 11,453 ± 100 km s−1. The velocity gradient derived during the phase from −14.9 to maximum light is thus 571 ± 18 km s−1 day−1, which is close to that of SN 2017erp. Such a large velocity gradient suggests that SN 2021hpr may have undergone an asymmetric explosion (K. Maeda et al. 2010) or an interaction of ejecta with the CSMs (C. L. Gerardy et al. 2004).
Assuming that the velocity decreases in a parabolic way, we can estimate the expansion velocity of SN 2021hpr as ∼11,500 km s−1 at around the maximum light, which is consistent with that measured from the t ≈ 0.1 day spectrum. According to the method of X. Wang et al. (2009), SN 2021hpr can be classified as an NV SN Ia. Following the definition by (S. Benetti et al. 2005), we also measured the velocity gradient during the phase from t ≈ 1.1 days to t ≈ 11.4 days, giving a velocity gradient of 18 ± 6 km s−1 day−1. This puts SN 2021hpr into the LVG subclass of SNe Ia.
The left panel of Figure 8 presents the ejecta velocities measured from the absorption minima of “W”-shaped S ii, Si ii λ5972, Si ii λ6355, and Ca ii NIR triplet. During the phase from t ≈ −14.9 to −5.6 days, the strong HVFs dominate the Ca ii NIR triplet. The photospheric component starts to become pronounced thereafter. Following the method proposed by X. Zhao et al. (2015, 2016), the velocity of the Ca ii NIR HVF is measured as ∼29,500 km s−1 at t ≈ −14.9 days, much higher than the corresponding Si ii λ6355 velocity, while the photospheric component of the Ca ii NIR triplet appears to have a velocity evolution comparable to that of Si ii. The velocities measured from Si ii λ5972 and the S ii doublet are comparable to those of Si ii λ6355, while the former two may show an increasing trend that is rarely seen in normal SNe Ia after maximum light.
5. Discussion
The optical light curves, color curves, and spectral evolution indicate that SN 2021hpr is a normal SN Ia, although its early light curves show excess emission at the beginning of the explosion. We will further explore the possible origins of the early excess emission in the context of a small sample with early observations.
5.1. The Distance and Luminosity
Different methods have been applied to estimate the distance to SN 2021hpr. We applied the EBV model of SNooPy2 to fit the light curves of SN 2021hpr in all bands and derived a distance modulus of 33.27 ± 0.09 mag, where the uncertainty quoted is statistical. Y. Zhang et al. (2022) and G. Lim et al. (2023) adopted the distance to SN 2021hpr as 33.46 ± 0.21 mag and 33.28 ± 0.11 mag, respectively. Utilizing the observations of three siblings SNe Ia in NGC 3147 (including SN 1997pq, SN 2008qv, and SN 2021hpr), S. M. Ward et al. (2023) estimated the distance modulus as 33.14 ± 0.12 mag. I. Biscardi et al. (2012) calibrated the absolute peak magnitudes of SN 2008fv available in the literature for all bands, and found a distance modulus of 33.20 ± 0.10 mag. Assuming an average distance modulus of the above estimates, 33.27 ± 0.13 mag, the absolute B-band peak magnitude of SN 2021hpr is −19.16 ± 0.14 mag, consistent with that of normal SNe Ia (M. M. Phillips et al. 1999; X. Wang et al. 2009).
Following the methodology outlined by W. Li et al. (2019), SNooPy2 is employed to establish the spectral energy distribution at various epochs and thus the quasi-bolometric light curve of SN 2021hpr based on the UBgVri light curves. Around maximum light, both NIR and UV emissions are assumed to contribute ∼5% to the quasi-bolometric luminosity (X. Wang et al. 2009; K. Zhang et al. 2016). The peak luminosity of SN 2021hpr was then estimated as ≈1.11 × 1043 erg s−1 on MJD 59322.35 ± 0.58 days, occurring ∼0.24 days after the B-band maximum. This peak luminosity is comparable to that of SN 2011fe (1.13 × 1043 erg s−1; K. Zhang et al. 2016).
To estimate the ejecta parameters, we employ the Minim Code (E. Chatzopoulos et al. 2013), which is a modified radiation diffusion model of Arnett (W. D. Arnett 1982; E. Chatzopoulos et al. 2012; W. Li et al. 2019). The Minim Code fits the quasi-bolometric light curves of SNe Ia with a constant-opacity approximation. From the fit, the first-light time (t0) and the mass of radioactive 56Ni ejecta (MNi) are estimated as MJD 59305.35 ± 0.58 days and 0.57 ± 0.05 M⊙, respectively. The model timescale of the light curve (tlc) is 15.71 ± 0.01 days, and the leaking timescale of gamma rays (tγ) is 32.34 ± 0.90 days. According to the best-fitting results, the first light of Arnett’s model is later than that estimated from the fireball model by ∼1.2 days (see Section 3.3). Note that the Arnett model does not take into account the “dark phase,” which is likely about 2 days (A. L. Piro & V. S. Morozova 2016). Thus, the difference in the above two estimates is perhaps related to the dark phase (A. L. Piro & V. S. Morozova 2016; W. Li et al. 2019; X. Zeng et al. 2021b), or the above two models may not be suitable for measuring the first light time that have early excess samples. The mass of radioactive 56Ni synthesized in the explosion of SN 2021hpr is comparable to that of SN 2011fe (MNi = 0.53 ± 0.11 M⊙; R. Pereira et al. 2013). Furthermore, using optimal tlc and tγ, we estimate the ejecta mass of SN 2021hpr as 0.83 ± 0.05 M⊙ and the kinetic energy as (0.75 ± 0.09) × 1051 erg. These values are consistent with those of typical SNe Ia (R. A. Scalzo et al. 2019).
5.2. Ratio of Two Si ii Lines
The depth ratio of Si ii λ5972 and Si ii λ6355, R(Si ii), measured around the maximum light, has been proposed as an indicator of luminosity and/or temperature for SNe Ia (P. Nugent et al. 1995). A lower value of R(Si ii) generally corresponds to a more luminous SN Ia with a higher photospheric temperature. For SN 2021hpr, the Si ii λ6355 line was relatively broad at early times, while it became narrower around the time of maximum light. The Si ii λ5972 line was visible in the spectra after t ≈ −11.6 days.
Around the maximum light, the R(Si ii) value of SN 2021hpr is small, indicating a high photospheric temperature. S. Benetti et al. (2005) noticed that R(Si ii) shows a diverse evolution before maximum light, with the LVG SNe Ia staying nearly constant and HVG SNe Ia showing a downward trend, respectively. The intensity of Si ii λ4560 is another temperature indicator of SNe Ia, with stronger Si ii λ4560 suggesting a higher photospheric temperature (S. Benetti et al. 2004). The Si ii λ4560 line in LVG SNe Ia is found to be deeper than that of HVG SNe Ia (G. Pignata et al. 2008). As shown in Figures 6 and 7, the Si ii λ4560 line in SN 2021hpr does not show significant evolution. And the shallow Si ii λ4560 line perhaps suggests that the photospheric temperature of SN 2021hpr may not be so high, while this could be due to blending with Fe ii, Fe iii, and Mg ii emission lines (S. Bongard et al. 2008; M. Yamanaka et al. 2009). In this case, the mixed Si ii λ4560 line cannot serve as a reliable indicator of the photospheric temperature of SNe Ia.
5.3. Origin of Early Excess Emission
5.3.1. Companion-shocking Model
During the phase immediately after the explosion, the multiband light-curve evolution can provide information on the progenitor system, the explosion mechanism, and even the circumstellar environment (D. Kasen 2010; M. R. Magee & K. Maguire 2020; M. Hu et al. 2023; G. Li et al. 2024). SN 2021hpr was discovered within ∼2.5 days after the explosion, and our earliest observation began at ∼1.7 days after the explosion. The color curves revealed the presence of relatively weak excess emission at early times (see Figure 4), which may have a high-temperature component. The early quasi-bolometric light curve shows an excess emission of up to ∼7% compared to the fireball model. To examine the origin of the observed flux excess, we utilize the CompanionShocking3 model in the lightcurve fitting package to fit the early light curves (G. Hosseinzadeh & S. Gomez 2022). This code employs the emcee package (D. Foreman-Mackey et al. 2013).
The CompanionShocking3 model contains two components: SiFTO template with s = 1 for SNe Ia (A. Conley et al. 2008) and the companion shock interaction component described by D. Kasen (2010). Because the SiFTO templates cover the UBVgri-band data, we fit only the light curves of these bands. The fitting results include eight parameters: (1) the explosion time, t0; (2) the binary separation of the companion-shocking component, a; (3) the viewing angle (P. J. Brown et al. 2012), θ; (4) the time of the B-band peak for the SiFTO template,  ; (5) the stretch applied to the SiFTO component, s; (6) a shift in the U-band maximum-light time for the SiFTO templates, ΔtU; (7) a shift in the i-band maximum time for the SiFTO templates, Δti. The model parameters, along with their corresponding initial and best-fit values, are itemized in Table 5. The light curves and the best-fit models are presented in Figure 9(a).
Table 5. CompanionShocking3 Model Parameters
| Parameter Variablea | Units | Initial Valueb | Best-fit Value |
|---|---|---|---|
| t0 | MJD | 59,303.5, 59,305.0 | 59,304.10 ± 0.02 |
| a | 1013 cm ≈ 144 R⊙ | 0, 1 |

|
| θ | degree | 0, 180 | 100 ± 10 |

| MJD | 59,321.0, 59,323.0 | 59,321.41 ± 0.02 |
| s | dimensionless | 0.5, 2 | 0.980 ± 0.003 |
| ΔtU | days | −1:1 | 0.34 ± 0.02 |
| Δti | days | −1:1 |

|
Notes. aSee text for parameter descriptions. bThis column lists the maximum and minimum for a uniform distribution (separated by a comma) and a Gaussian distribution (separated by a colon).
Download table as: ASCIITypeset image

Figure 9. Fitting results of the early light curves (scatter) of SN 2021hpr using different models: (a) CompanionShocking3 + SiFTO template model; (b) CSM + tα model, with α = 3.3, 2.9, 2.3, 2.7, 2.4, and 2.1 for the UBVgri bands, respectively; (c) DDet model, the 0.08 M⊙ mass of He shell detonation on the 0.9 M⊙ mass WD model described by A. Polin et al. (2019); and (d) the 56Ni mixing with the  model described by M. R. Magee & K. Maguire (2020). The residuals of the fitting curves are displayed in the lower panels. The unfilled points are the earliest data from G. Lim et al. (2023). The chi-square of the residual is shown in the top panel. The chi-square values shown there were derived from the fitting results of the data from the first 7 days. The gray area of panels (a) and (b) represent the data involved in the empirical fitting.
Download figure:
Standard image High-resolution imageOur analysis indicates that the CompanionShocking3 model offers a better fit to the observation data. The optimal binary separation is determined as  , while the estimated radius of the companion star is ∼7.5 R⊙ (here, we assumed Roche-lobe overflow in the fitting, P. P. Eggleton 1983). This conclusion is consistent with the findings reported by G. Lim et al. (2023). The best-fit explosion time is estimated as MJD 59304.10 ± 0.02. In this paper, we adopted the average explosion time as MJD 59304.13 ± 0.50 for SN 2021hpr, by taking into account the results from both the fireball model (Section 3.3) and the CompanionShocking3 model. Thus, the rise time of SN 2021hpr in B is estimated as 17.98 ± 0.80 days. Since the Arnett model (Section 5.1) does not consider a dark phase, we do not include it in the estimation of the explosion time.
5.3.2. Alternative Explosion Scenarios
The interaction between SN Ia ejecta and CSM may result in an excess of flux observed in early time light curves. We employ the CSM model proposed by M. Hu et al. (2023) to fit the early multiband light curves of SN 2021hpr and present the optimal fit results in Figures 9(b) and 10. This model assumes a CSM mass of 3.5 × 10⁻⁵ M⊙ around the SN at a distance of 5 × 1014 cm, with a mass-loss rate of 1.5 × 10⁻⁶ M⊙ yr−1. From the lower panel of Figure 9(b), one can see that the best-fit light curves exhibit relatively large deviations during the first 2 days, but they converge close to the observations in different bands at 4–10 days after the explosion. Thus, the CSM model cannot provide a satisfactory fit to the early time excess emission seen in SN 2021hpr.

Figure 10. The g − r, and r − i color curves of SN 2021hpr with different model color curves including CompanionShocking3 + SiFTO template model; CSM + tα model; DDet model, the 0.08 M⊙ mass of He shell detonation on the 0.9 M⊙ mass WD model described by A. Polin et al. (2019); and the 56Ni mixing with  model described by M. R. Magee & K. Maguire (2020).
Download figure:
Standard image High-resolution imageAn early flux excess in SNe Ia can be attributed to the detonation of a thick He shell on a CO WD, due to radioactive materials present in the He-shell ashes, the so-called double-detonation (DDet) model (J.-A. Jiang et al. 2017; U. M. Noebauer et al. 2017; A. Polin et al. 2019). The DDet model posits that the ignition of the CO core is triggered by a thermonuclear explosion in the He shell, and the core explosion completely disrupts the entire WD (S. E. Woosley & T. A. Weaver 1994). In this case, the ashes of the He shell contain a significant amount of Fe-group elements that obstruct photons at shorter wavelengths and result in red colors at earlier phases. The early time r − i colors of SN 2021hpr are found to be redder than those of other normal types of SNe Ia. On the other hand, a thick-shell DDet model is possibly consistent with such light-curve and color-curve evolution.
G. Lim et al. (2023) compare the BVRI-band light and color curves of SN 2021hpr with a thick He shell edge-lit DDet model (0.9 M⊙ WD + 0.08 M⊙ He shell) of A. Polin et al. (2019), and conclude that DDet models do not provide a perfect explanation of its early time light curves. We used the same model to conduct a comparative analysis, as shown in Figures 9(c) and 10. The color-curve shapes given by the model are similar to the observations, the g − r color is bluer than the observation in the first 4 days, and the r − i color is redder in the first 20 days. After that, the DDet model produces a color curve that is too red. Thus, we reach the same conclusion as G. Lim et al. (2023) that the predictions of DDet are not fully consistent with the observed properties of SN 2021hpr, as also indicated by the large χ2 in the fit (see Figure 10(c)).
The distribution of 56Ni within the ejecta of SNe Ia can significantly affect the early epoch light curves. We compared the model set calculated by M. R. Magee & K. Maguire (2020) and M. R. Magee et al. (2020) with the early light curves of SN 2021hpr. Among the models in the set, the  model shows the highest degree of similarity to the observed early light curves of SN 2021hpr, as shown in Figure 9(d). In this model, the distributions of 56Ni are shown for an exponential density profile, a kinetic energy of 6.53 × 1050 erg, with a 56Ni mass of 0.6 M⊙ (M. R. Magee et al. 2020). It should be noted that the 56Ni mass of SN 2021hpr calculated by the Arnett model is 0.57 ± 0.05 M⊙ (see Section 5.1), which is consistent with the mass given in the
  model. However, the model color curves are generally inconsistent with the observations, except for the r − i color at late times, as shown in Figure 10 (see green lines).
It should be noted that the companion and CSM interaction models are empirical fits to the data, while the DDet and 56Ni mixing models are obtained from model grids. From the average Chi-square(χ2) of the residuals, it can be found that the CompanionShocking3 model provides a better fit to the early light curves of SN 2021hpr compared to the other three models. However, the viewing angle provided by this model’s fit only marginally satisfies the identification criteria proposed by J. Burke et al. (2022) within the error range. The observed g − r and r − i color curves (Figure 10) do not exhibit a perfect match with this model. Therefore, it cannot be ruled out that other possible models could also explain the flux excess observed in the early stages of SN 2021hpr.
5.3.3. Spectroscopic Differences in SNe Ia with and without Early Excess Emission
Regardless of which theoretical model (e.g., CompanionShocking model; CSM + tα model, DDet model; 56Ni mixing model, etc.) is responsible for the early flux excess, the early light curves and spectra will exhibit some qualitative clues about the progenitor stars and/or the explosion mechanism of SNe Ia. In Figure 11, we compare the earliest spectra of SNe Ia with early flux excess (YEs) and without early flux excess (NEs). We selected the normal type SNe Ia that have been firmly identified for the presence or absence of early excess emission in literature. Moreover, early spectra of at least 2 weeks before maximum light should be available for this sample including SN 2017erp (J. Burke et al. 2022), SN 2019np (H. Sai et al. 2022), SN 2017cbv (J. Wee et al. 2018), SN 2023bee (G. Hosseinzadeh et al. 2023), SN 2012cg (G. H. Marion et al. 2016), SN 2021aefx (G. Hosseinzadeh et al. 2022; Y. Q. Ni et al. 2023), SN 2020hvf (J.-a. Jiang et al. 2021), SN 2013dy (W. Zheng et al. 2013), SN 2015F (R. Cartier et al. 2017), SN 2018gv (Y. Yang et al. 2020), SN 2011fe (K. Zhang et al. 2016), SN 2017hpa (X. Zeng et al. 2021a), and SN 2013gy (S. Holmbo et al. 2019).

Figure 11. Comparison of the earliest spectra of SN 2021hpr, SN 2017erp (J. Burke et al. 2022), SN 2019np (H. Sai et al. 2022), SN 2017cbv (J. Wee et al. 2018), SN 2023bee (G. Hosseinzadeh et al. 2023), SN 2012cg (G. H. Marion et al. 2016), SN 2021aefx (G. Hosseinzadeh et al. 2022; Y. Q. Ni et al. 2023), SN 2015F (R. Cartier et al. 2017), SN 2018gv (Y. Yang et al. 2020), SN 2020hvf (J.-a. Jiang et al. 2021), SN 2011fe (K. Zhang et al. 2016), SN 2017hpa (X. Zeng et al. 2021a), SN 2013gy (S. Holmbo et al. 2019), and SN 2013dy (W. Zheng et al. 2013). The solid lines represent SNe Ia with early flux excess, and the dashed lines represent those without early flux excess. The vertical line corresponds to the absorption minimum of the Si ii λ6355 absorption line of SN 2011fe. The label for each line includes the abbreviated name of the SN Ia, its phase relative to B-band maximum light, and (in parentheses) its Δm15(B) value. The gray area is marked to indicate the spectral features at around the Si ii λ4130 and O i λ7774 absorption lines.
Download figure:
Standard image High-resolution imageWe found significant differences in the earliest spectra of YEs and NEs SNe Ia. The NEs SNe Ia show prominent Si ii λ4130 and O i λ7774 absorption lines, but those YEs' SNe Ia do not or exhibit substantially weaker lines (except for SN 2019np). The CompanionShocking model is hardly able to explain the flux excess of SN 2019np, but the 56Ni mixing model is more consistent with this SN (J. Burke et al. 2022; H. Sai et al. 2022). In Figure 11, the vertical line corresponds to the absorption minimum of the Si ii λ6355 line of SN 2011fe, corresponding to a velocity of ∼15,900 km s−1 (K. Zhang et al. 2016). The absorption minimum of Si ii λ6355 in YE SNe Ia is bluer than that of the NEs SNe Ia, indicating that the YE objects may have higher ejecta velocities than the NE objects at the early phase. Figure 12 displays the distribution of the early phase Si ii velocity measured for a sample of normal SNe Ia with early observations. To investigate whether the YEs and NE samples come from different groups, based on their early time velocities, we performed a Kolmogorov–Smirnov test and obtained the P-value as 6 × 10⁻³. This low value suggests a significant difference between the velocities of YEs and NEs objects in the very early phase. A discrepancy can be also seen in their photometric parameters. We found that the average decline rate of the YEs' sample is noticeably smaller than that of the NEs sample (i.e., 0.91 ± 0.01 versus 1.11 ± 0.03 mag). This is not unexpected since the YEs' SNe Ia should have additional energy sources, perhaps due to interactions with CSM/companion stars or more complete burning at outer layers. However, it should be noted that the above results could be affected by the limited sample available in the literature, and a more extensive data set is required for a more thorough analysis. Most of these YEs' SNe Ia can be put in the NV subclass according to their Si ii velocity measured at around the maximum light, except for SN 2023bee, which has a velocity 12,150 ± 50 km s−1 (G. Hosseinzadeh et al. 2023) at this phase. This indicates that the YEs' SNe Ia tend to have detached HVFs at an early stage, but evolve like NV SNe Ia when approaching maximum light.

Figure 12. Left panel: early expansion velocity distribution of 14 normal SNe Ia. The observed sample is the same as Figure 11, but solid circles and open circles represent the YEs' samples and the NEs, respectively. Right panel: the corresponding histogram for the early expansion velocity.
Download figure:
Standard image High-resolution image5.4. Late-time Spectra
Nebular spectra of SNe Ia can provide powerful probes of the underlying physics of the explosion (C. S. Black et al. 2016; K. Maguire et al. 2018; M. L. Graham et al. 2022; J. Liu et al. 2023). Redshifted or blueshifted nebular velocities of SNe Ia might have a connection with the explosion geometry (K. Maeda et al. 2010). The nebular velocity represents the average velocity of [Fe ii] λ7155 and [Ni ii] λ7378 velocities (K. Maeda et al. 2010; J. M. Silverman et al. 2013). Figure 13 presents late-time spectra of SN 2021hpr alongside those of other well-studied normal SNe Ia, including SNe Ia 2011fe, 2012cg, 2013dy, 2013gy, 2015F, 2017cbv, 2018oh, 2019np, and 2021hpr. The shape of the late-time spectra of SN 2021hpr is extremely similar to that of other comparison SNe Ia. However, the main difference lies in the intensity evolution of individual emission lines. In particular, the emission line intensity of [Fe iii] λ4701 tends to decrease over time, as observed in cases such as SN 2011fe and SN 2017cbv; while in the case of SN 2021hpr, this emission line tends to become stronger with time. Furthermore, in the even later spectrum of SN 2021hpr, the intensity of [Fe ii] λ7155 and [Ni ii] λ7378 lines became comparable. As the ejecta expands, it becomes more transparent, and the radiation caused by the decay of the innermost iron-group elements appears to be stronger.

Figure 13. Late-time spectra of SNe 2011fe, 2012cg, 2013dy, 2013gy, 2015F, 2017cbv, 2018oh, 2019np, and 2021hpr. Flux densities are normalized to the [Fe iii] λ4701, and smoothed with a bin of 25 Å. The three vertical dashed–dotted lines from left to right represent the rest-frame wavelengths of [Fe iii] λ4701, [Fe ii] λ7155, and [Ni ii] λ7378, respectively.
Download figure:
Standard image High-resolution imageTo obtain the velocities of the emission lines in these spectra, we used the direct measurement method for the forbidden emission lines of [Fe iii] λ4701 and [Fe ii] λ5250. In contrast, the [Fe ii] λ7155 and [Ni ii] λ7378 lines are fitted with the multi-Gaussian method. The measured velocities are presented in Table 6. The estimated velocities of [Fe ii] λ5250, [Fe ii] λ7155, and [Ni ii] λ7378 show a redshift evolution, while [Fe iii] λ4701 exhibits a blueshift trend. The [Ni ii] λ7378 line is weaker than [Fe ii] λ7155 at t ≈ +263 days. Thus, we use [Fe ii] λ7155 to represent the nebular velocity at this phase. For SN 2021hpr, this velocity shift is calculated as 710 ± 170 km s−1 at t ≈ 263 days and 640 ± 100 km s−1 at t ≈ +288 days, respectively, suggesting a redshifted nebular velocity for this SN. Figure 14 shows the photospheric velocity measured around the maximum light versus the velocity shift measured from Fe ii and Ni ii lines in the nebular phase. The velocities of the [Fe iii] λ4701, [Fe ii] λ5250, and [Ni ii] λ7378 emission lines exhibit a redward evolution over time, consistent with that found for normal SNe Ia (C. S. Black et al. 2016; K. Maguire et al. 2018; M. L. Graham et al. 2022).
Table 6. Velocities of Nebular-phase Emission Lines in SN 2021hpr
| UT Date | Phase | Line | Velocity |
|---|---|---|---|
| (days) | (km s−1) | ||
| 2022-01-06 | 263 | [Fe iii] λ4701 | −1100 ± 60 |
| 2022-01-06 | 263 | [Fe ii] λ5250 | 1200 ± 100 |
| 2022-01-06 | 263 | [Fe ii] λ7155 | 710 ± 170 |
| 2022-01-06 | 263 | [Ni ii] λ7378 | 120 ± 120 |
| 2022-01-30 | 288 | [Fe iii] λ4701 | −1050 ± 30 |
| 2022-01-30 | 288 | [Fe ii] λ5250 | 1330 ± 50 |
| 2022-01-30 | 288 | [Fe ii] λ7155 | 540 ± 150 |
| 2022-01-30 | 288 | [Ni ii] λ7378 | 730 ± 130 |
Download table as: ASCIITypeset image

Figure 14. The photospheric velocity measured at maximum light vs. the velocity shift inferred from the nebular-phase spectra. The red square represents SN 2021hpr measured using multi-Gaussian fits to the Fe ii and Ni ii blended features at t ≈ 288 days. Data from K. Maeda et al. (2010), J. M. Silverman et al. (2012), M. L. Graham et al. (2022), and J. Liu et al. (2023).
Download figure:
Standard image High-resolution imageFrom t ≈ 263 days to t ≈ 288 days, the [Ni ii] λ7378 line becomes relatively more prominent, leading to an increased Ni/Fe ratio. This change is likely due to the inner ejecta cooling gradually over time, as seen in other SNe Ia (S. Blondin et al. 2022; J. Liu et al. 2023). The Ni/Fe ratio, the flux ratio of [Fe ii] λ7155 and [Ni ii] λ7378, is used to constrain the explosion mechanism of SNe Ia (K. Maguire et al. 2018). Figure 15 shows the result for SN 2021hpr; however, this change in Ni/Fe ratio due to the spectral evolution makes it move from the sub-MCh DDet model region to the Chandrasekhar MCh delayed-detonation-model region. This indicates that constraining the explosion model based on the Ni/Fe ratio is still challenging for an individual SN Ia.

Figure 15. Mass ratio distribution of Ni and Fe estimated by the late-time spectra of normal SNe Ia. Data from J. Liu et al. (2023). The gray area for DDet models (I. R. Seitenzahl et al. 2013), and the green area for sub-MCh models (K. J. Shen et al. 2018).
Download figure:
Standard image High-resolution imageWe tried to examine distributions of the mass ratio of Ni to Fe estimated from the late-time spectra of normal SNe Ia (see Figure 15), including YEs and NEs objects, but found no significant tendency between these two subgroups. More samples of SNe Ia with both very early and nebular phase observations are needed for a better quantitative analysis.
6. Conclusion
We present comprehensive photometric and spectroscopic observations of SN 2021hpr, covering the phase from about 1 to 290 days after the explosion. The main photometric and spectroscopic parameters derived for SN 2021hpr are listed in Table 7. Spectroscopically, it is a normal SN la, while its early time light curves reveal faint excess emission. Based on the expansion velocity near the maximum light and postpeak velocity gradient, SN 2021hpr can be categorized into the NV and LVG subclasses. The ejecta velocity of SN 2021hpr was found to undergo a drastic decline when approaching the maximum light, with a gradient of 571 ± 18 km s−1 day−1, which is larger than normal SNe Ia like SN 2011fe.
Table 7. Comparison of Main Parameters of SN 2021hpr and SN 2011fe
| Parameter | Unit | SN 2021hpr (A) | SN 2011fe | SN 2021hpr (P) |
|---|---|---|---|---|
| Δm15(B) | mag | 1.00 ± 0.01 | 1.18 ± 0.03 (Z) | 0.988 ± 0.026 (L) |

| days | 59,322.11 ± 0.58 | 55,815.5 ± 0.30 | 59,321.856 ± 0.218 (L) |

| mag | 14.11 ± 0.04 | 10.0 ± 0.02 | 14.017 ± 0.017 (Z2) |

| mag | −0.028 ± 0.007 | −0.03 ± 0.04 (Z) | −0.004 ± 0.005 (L) |

| mag | −19.16 ± 0.14 | −19.21 ± 0.15 | −19.553 ± 0.111 (L) |
| E(B − V)host | mag | 0.06 ± 0.06 | 0.032 ± 0.045 (Z) | 0.079 ± 0.040 (L) |
| sBV | dimensionless | 1.02 ± 0.03 | ⋯ | None |
| t0 | days | 59,304.13 ± 0.50 | 55,796.48 ± 0.16 (Z, Z1) | 59,304.73 ± 0.01(L) |
| DM | mag | 33.27 ± 0.13 | 29.04 ± 0.05 (S) | 33.28 ± 0.11 (L) |
| τrise | days | 17.98 ± 0.80 | 18.00 ± 0.16 (Z, Z1) | 16.424 ± 0.078 (Z3) |

| erg s−1 | ≈1.11 × 1043 | (1.13 ± 0.07) × 1043(Z) | None |

| M⊙ | 0.57 ± 0.05 | 0.53 ± 0.11 (S) | 0.44 ± 0.14 (B) |
| υ0(Si ii) | km s−1 | 11,453 ± 100 | 10,400 (Z) | ∼12,420 (Z2, Z4) |
| R(Si ii) | dimensionless | 0.08 ± 0.01 | 0.18 ± 0.02 (Z5) | None |
 (Si ii) (Si ii) | km s−1 day−1 | 18 ± 6 | 52.4 (Z) | None |
Note. (Z) K. Zhang et al. (2016); (A) this work; (P) previous; (Z1) for the tn model; (S) B. J. Shappee & K. Z. Stanek (2011); (L) G. Lim et al. (2023); (Z2) Y. Zhang et al. (2022); (Z3) for the B band, and  = 59305.438 ± 0.450,
  = 59321.862 ± 0.450; (Z4) 4 days before maximum brightness; (Z5) R. Pereira et al. (2013); (B) B. Barna et al. (2023).
Download table as: ASCIITypeset image
Among different models proposed to account for the early excess emission in SNe Ia, the CompanionShocking3 model provides a better fit to the early data. This model gives the binary separation as ∼15.84 R⊙ and a companion radius of ∼7.5 R⊙. These results are consistent with previous studies. The fitting results of the companion interaction model favor the existence of a nondegenerate companion in the progenitor system of SN 2021hpr. Alternatively, we also employ the DDet, CSM, and 56Ni mixing models to discuss the early flux excess of SN 2021hpr. It is difficult for both the DDet and 56Ni mixing models to reproduce the early phase light and color curves of SN 2021hpr.
With a small sample of well-observed normal SNe Ia, we find that the appearance of early excess emission in the light curves is likely related to a large velocity gradient inferred from the spectra. This favors a physical origin of the interaction of ejecta with a nondegenerate companion and/or surrounding CSM for SNe Ia like SN 2021hpr. For SN 2021hpr, however, the Fe ii/Ni ii lines are found to show a redshifted velocity as inferred from its nebular-phase spectra, while this velocity is blueshifted for all the comparison SNe Ia showing early bump features. More statistical samples with better observations in both early and nebular phases are needed to clarify whether SN 2021hpr is an outlier in this respect.
Acknowledgments
This work is sponsored by the National Natural Science Foundation of China (NSFC grants 12288102, 12033003, 12203029, 12373038, 11803076, and 12433007), Natural Science Foundation of Xinjiang Uygur Autonomous Region under No. 2024D01D32, Tianshan Talent Training Program (grant 2023TSYCLJ0053, 2023TSYCCX0101), the Central Guidance for Local Science and Technology Development Fund under No. ZYYD2025QY2, the New Cornerstone Science Foundation through the XPLORER PRIZE, the Chinese Academy of Sciences (CAS) “Light of West China” Program (grant 2020-XBQNXZ-016), the Strategic Priority Research Program of the Chinese Academy of Sciences (grants XDB0550100, XDB0550000), and the High-Level Talent-Heaven Lake Program of Xinjiang Uygur Autonomous Region of China, the NKFIH/OTKA FK-134432 grant of the National Research, Development and Innovation (NRDI) Office of Hungary. This work includes data from the Las Cumbres Observatory global telescope network; the LCO group is supported by NSF grants AST-1911151 and AST-1911225.
L.G. acknowledges financial support from AGAUR, CSIC, MCIN and AEI 10.13039/501100011033 under projects PID2023-151307NB-I00, PIE 20215AT016, CEX2020-001058-M, ILINK23001, COOPB2304, and 2021-SGR-01270. J.Z. is supported by the National Natural Science Foundation of China (grant 12173082), the Yunnan Province Foundation (grant 202201AT070069), the Top-notch Young Talents Program of Yunnan Province, the Light of West China Program provided by the Chinese Academy of Sciences, the International Centre of Supernovae, Yunnan Key Laboratory (grant 202302AN360001). A.V.F.’s research group at UC Berkeley acknowledges financial assistance from the Christopher R. Redlich Fund, Gary and Cynthia Bengier, Clark and Sharon Winslow, Alan Eustace (W.Z. is a Bengier–Winslow–Eustace Specialist in Astronomy), William Draper, Timothy and Melissa Draper, Briggs and Kathleen Wood, Sanford Robertson (T.G.B. is a Draper–Wood–Robertson Specialist in Astronomy), and numerous other donors. A major upgrade of the Kast spectrograph on the Shane 3 m telescope at Lick Observatory, led by Brad Holden, was made possible through generous gifts from the Heising-Simons Foundation, William and Marina Kast, and the University of California Observatories. Research at Lick Observatory is partially supported by a generous gift from Google. For their expert assistance, we acknowledge the staff of the LCO telescopes, the Nanshan One-meter Wide-field Telescope, the Lijiang 2.4 m telescope, the Lick Observatory Shane 3 m telescope, the twin Keck 10 m telescopes, the Asteroid Terrestrial-impact Last Alert System (ATLAS) project, and the BFOSC mounted on the Xinglong 2.16 m telescope. Some of the data presented herein were obtained at the W. M. Keck Observatory, which is operated as a scientific partnership among the California Institute of Technology, the University of California, and NASA; the observatory was made possible by the generous financial support of the W. M. Keck Foundation.
Appendix
We present photometric datasets of SN 2021hpr in three tables: Table A1 lists photometry obtained through telescopes of LCO, NOWT, ZTF, and ATLAS; Table A2 contains the data from the KAIT; and Table A3 lists unfiltered optical photometry acquired through the 0.35 m telescope at Itagaki Astronomical Observatory.
Table A1. Photometry of SN 2021hpr Taken with LCO, NOWT, ZTF, and ATLAS
| MJD | Epocha | Mag | Magerr | Telescope | Filter |
|---|---|---|---|---|---|
| 59305.089 | −17.021 | 18.776 | 0.152 | LCO | B |
| 59305.099 | −17.011 | 18.661 | 0.130 | LCO | V |
| 59305.102 | −17.009 | 18.608 | 0.126 | LCO | V |
| 59305.104 | −17.006 | 18.468 | 0.090 | LCO | g |
| 59305.108 | −17.002 | 18.526 | 0.092 | LCO | g |
| 59305.120 | −16.990 | 19.814 | 0.079 | LCO | i |
| 59305.285 | −16.825 | 18.591 | 0.235 | ZTF | g |
| 59305.309 | −16.801 | 18.607 | 0.229 | ZTF | r |
| 59305.353 | −16.758 | 18.748 | 0.104 | LCO | g |
| 59305.354 | −16.756 | 18.769 | 0.119 | LCO | r |
| ⋯ | ⋯ | ⋯ | ⋯ | ⋯ | ⋯ |
| 59531.388 | 209.278 | 19.269 | 0.119 | ZTF | g |
| 59531.408 | 209.298 | 20.452 | 0.292 | ZTF | r |
| 59538.366 | 216.256 | 19.272 | 0.238 | ZTF | g |
| 59550.429 | 228.319 | 19.549 | 0.095 | ZTF | g |
| 59588.550 | 266.440 | 19.734 | 0.228 | ATLAS | c |
Note.
aRelative to the epoch of B-band maximum brightness (MJD = 59322.11).Only a portion of this table is shown here to demonstrate its form and content. A machine-readable version of the full table is available.
Download table as: Machine-readable (MRT)Typeset image
Table A2. Photometry of SN 2021hpr Taken with KAIT
| MJD | Mag B | Magerr B | Mag V | Magerr V | Mag R | Magerr R | Mag Clear | Magerr Clear | Mag I | Magerr I |
|---|---|---|---|---|---|---|---|---|---|---|
| 59309.241 | 16.783 | 0.054 | 16.269 | 0.032 | 16.229 | 0.068 | 16.144 | 0.049 | 16.368 | 0.096 |
| 59310.294 | 16.031 | 0.077 | 15.794 | 0.103 | 15.776 | 0.210 | 15.677 | 0.055 | 15.912 | 0.194 |
| 59312.206 | 15.386 | 0.045 | 15.238 | 0.038 | 15.222 | 0.079 | 15.069 | 0.062 | 15.345 | 0.047 |
| 59313.298 | 15.165 | 0.047 | 15.004 | 0.042 | 14.938 | 0.050 | 14.816 | 0.039 | 15.064 | 0.090 |
| 59314.208 | 15.014 | 0.146 | 14.874 | 0.176 | 14.820 | 0.279 | 14.613 | 0.292 | 14.778 | 0.852 |
| 59315.261 | 14.656 | 0.059 | 14.676 | 0.028 | 14.633 | 0.026 | 14.525 | 0.046 | 14.735 | 0.036 |
| 59316.266 | 14.705 | 0.035 | 14.599 | 0.020 | 14.550 | 0.024 | 14.423 | 0.038 | 14.693 | 0.024 |
| 59317.329 | 14.523 | 0.058 | 14.458 | 0.036 | 14.441 | 0.047 | 14.348 | 0.037 | 14.631 | 0.097 |
| 59318.338 | 14.405 | 0.095 | 14.410 | 0.033 | 14.375 | 0.032 | 14.257 | 0.037 | 14.599 | 0.039 |
| 59320.211 | 14.356 | 0.051 | 14.371 | 0.025 | 14.304 | 0.026 | 14.224 | 0.034 | 14.570 | 0.034 |
| 59321.261 | 14.486 | 0.052 | 14.304 | 0.029 | 14.241 | 0.028 | 14.206 | 0.043 | 14.591 | 0.033 |
| 59322.201 | 14.359 | 0.072 | 14.337 | 0.033 | 14.259 | 0.027 | 14.191 | 0.039 | 14.622 | 0.037 |
| 59323.230 | 14.473 | 0.045 | 14.269 | 0.023 | 14.244 | 0.019 | 14.204 | 0.028 | 14.611 | 0.029 |
| 59324.163 | 14.533 | 0.065 | 14.351 | 0.030 | 14.258 | 0.032 | 14.179 | 0.048 | 14.684 | 0.043 |
| 59325.280 | ⋯ | ⋯ | ⋯ | ⋯ | ⋯ | ⋯ | 14.226 | 0.053 | ⋯ | ⋯ |
| 59326.207 | 14.617 | 0.094 | 14.293 | 0.032 | 14.287 | 0.029 | 14.235 | 0.049 | 14.668 | 0.038 |
| 59327.174 | 14.679 | 0.072 | 14.324 | 0.039 | 14.416 | 0.050 | 14.282 | 0.047 | 14.759 | 0.078 |
| 59332.197 | 14.811 | 0.088 | 14.503 | 0.042 | 14.598 | 0.028 | 14.525 | 0.048 | 14.988 | 0.037 |
| 59333.224 | 14.937 | 0.054 | 14.595 | 0.023 | 14.673 | 0.020 | 14.620 | 0.032 | 15.046 | 0.031 |
| 59334.241 | 15.068 | 0.093 | 14.644 | 0.046 | 14.709 | 0.042 | 14.615 | 0.033 | 15.050 | 0.040 |
| 59337.248 | 15.408 | 0.058 | 14.833 | 0.027 | 14.860 | 0.030 | 14.797 | 0.041 | 15.091 | 0.084 |
| 59338.176 | 15.502 | 0.068 | 14.906 | 0.031 | 14.914 | 0.032 | 14.857 | 0.051 | 15.098 | 0.038 |
| 59339.200 | 15.567 | 0.042 | 14.898 | 0.024 | 14.937 | 0.028 | 14.889 | 0.048 | 15.098 | 0.033 |
| 59340.177 | 15.846 | 0.078 | 14.986 | 0.033 | 14.978 | 0.033 | 14.908 | 0.056 | 15.042 | 0.044 |
| 59342.170 | 15.997 | 0.116 | 15.013 | 0.038 | 14.879 | 0.035 | 14.931 | 0.066 | 14.945 | 0.042 |
| 59343.170 | 16.115 | 0.119 | 15.078 | 0.041 | 14.962 | 0.033 | 14.968 | 0.054 | 14.942 | 0.042 |
| 59344.223 | 16.243 | 0.064 | 15.169 | 0.034 | 14.972 | 0.032 | 14.997 | 0.044 | 14.921 | 0.042 |
| 59345.194 | 16.222 | 0.075 | 15.162 | 0.036 | 14.993 | 0.032 | ⋯ | ⋯ | 14.900 | 0.041 |
| 59346.184 | 16.362 | 0.092 | 15.244 | 0.038 | 15.038 | 0.035 | 15.046 | 0.052 | 14.877 | 0.043 |
| 59347.212 | 16.498 | 0.054 | 15.281 | 0.025 | 15.007 | 0.023 | 15.062 | 0.035 | 14.870 | 0.027 |
| 59348.229 | 16.676 | 0.060 | 15.352 | 0.033 | 15.076 | 0.032 | 15.091 | 0.043 | 14.873 | 0.040 |
| 59349.188 | 16.909 | 0.166 | 15.287 | 0.053 | 15.033 | 0.041 | 15.109 | 0.068 | 14.862 | 0.056 |
| 59350.243 | 16.815 | 0.075 | 15.442 | 0.032 | 15.123 | 0.028 | 15.162 | 0.033 | 14.897 | 0.033 |
| 59351.241 | 16.883 | 0.072 | 15.512 | 0.029 | 15.146 | 0.024 | 15.189 | 0.022 | 14.871 | 0.029 |
| 59355.207 | 17.182 | 0.137 | 15.752 | 0.044 | 15.359 | 0.038 | 15.466 | 0.067 | 15.078 | 0.046 |
| 59356.247 | 17.323 | 0.112 | 15.867 | 0.047 | 15.491 | 0.039 | 15.512 | 0.043 | 15.152 | 0.052 |
| 59357.180 | 17.621 | 0.165 | 15.898 | 0.066 | 15.524 | 0.051 | 15.617 | 0.060 | 15.259 | 0.065 |
| 59358.181 | ⋯ | ⋯ | ⋯ | ⋯ | ⋯ | ⋯ | 15.617 | 0.050 | ⋯ | ⋯ |
| 59360.208 | 17.548 | 0.119 | 16.105 | 0.053 | 15.688 | 0.045 | 15.750 | 0.040 | 15.419 | 0.054 |
| 59361.220 | 17.615 | 0.105 | 16.083 | 0.043 | 15.804 | 0.043 | 15.804 | 0.048 | 15.495 | 0.043 |
| 59363.230 | 17.613 | 0.070 | 16.134 | 0.034 | 15.854 | 0.034 | 15.875 | 0.033 | 15.610 | 0.045 |
| 59364.205 | 17.559 | 0.101 | 16.194 | 0.036 | 15.890 | 0.038 | 15.934 | 0.048 | 15.660 | 0.042 |
| 59366.223 | 17.572 | 0.099 | 16.285 | 0.045 | 15.984 | 0.046 | 16.044 | 0.056 | 15.809 | 0.056 |
| 59367.245 | 17.529 | 0.096 | 16.185 | 0.038 | 15.991 | 0.037 | 16.047 | 0.079 | 15.796 | 0.047 |
| 59368.213 | 17.560 | 0.098 | 16.322 | 0.042 | 16.096 | 0.042 | 16.107 | 0.073 | 15.945 | 0.076 |
| 59369.207 | 17.708 | 0.104 | 16.299 | 0.047 | 16.094 | 0.047 | 16.147 | 0.068 | 15.924 | 0.058 |
| 59371.209 | 17.660 | 0.098 | 16.401 | 0.047 | 16.177 | 0.061 | 16.208 | 0.051 | 16.014 | 0.063 |
| 59377.220 | 17.622 | 0.106 | 16.497 | 0.049 | 16.290 | 0.051 | 16.345 | 0.100 | 16.210 | 0.071 |
A machine-readable version of the table is available.
Download table as: Machine-readable (MRT)Typeset image
Table A3. Unfiltered Optical Photometry of SN 2021hpr Taken with Itagaki Astronomical Observatory 0.35 m Telescope
| MJD | Epocha | Mag |
|---|---|---|
| 59306.448 | −15.66 | 17.7 |
| 59307.457 | −14.65 | 17.1 |
| 59307.458 | −14.65 | 17.2 |
| 59309.525 | −12.58 | 16.1 |
| 59309.525 | −12.58 | 16.0 |
| 59310.525 | −11.58 | 15.7 |
| 59310.525 | −11.58 | 15.6 |
| 59311.608 | −10.50 | 15.3 |
| 59311.608 | −10.50 | 15.4 |
| 59312.609 | −9.50 | 15.1 |
| 59312.609 | −9.50 | 15.1 |
| 59313.608 | −8.50 | 14.8 |
| 59313.608 | −8.50 | 14.8 |
| 59314.612 | −7.49 | 14.7 |
| 59314.612 | −7.49 | 14.7 |
| 59315.603 | −6.50 | 14.4 |
| 59315.603 | −6.50 | 14.4 |
| 59318.616 | −3.49 | 14.2 |
| 59318.617 | −3.49 | 14.2 |
Note.
aRelative to the epoch of B-band maximum brightness (MJD = 59322.11).A machine-readable version of the table is available.
Download table as: Machine-readable (MRT)Typeset image
Footnotes
- 26
IRAF is distributed by the National Optical Astronomy Observatories, which are operated by the Association of Universities for Research in Astronomy, Inc., under a cooperative agreement with the National Science Foundation.
- 27
- 28
- 29
- 30
- 31