Abstract
This study revisits the role that nitrogen inclusion in polycyclic aromatic hydrocarbons (PAHs; those with nitrogen inclusion, PANHs) plays in their infrared (IR) spectral properties. We present spectra of pure PAHs, PANHs, and protonated PANHs, computed using density functional theory and basis sets that treat polarization. We investigate trends in peak position and relative intensities as a function of nitrogen position, charge, and geometry. We use Spitzer-IRS spectral map data of the northwest photodissociation region of NGC 7023 and a database-fitting approach, using exclusively the PA(N)H spectra computed in this paper, to assess their IR contribution to the cosmic PAH emission. We find that, by including the treatment of polarization, pure PAH cations can account for the class A 6.2 μm PAH emission, with the 6.2 μm band position being dependent on the molecular geometry. PANH cations are required to reproduce the most blueshifted 6.2 μm bands observed in class A sources, albeit PANH cations come with strong 11.0 μm emission. Blind database fits demonstrate that the restriction imposed by the 11.0 μm emission in the astronomical spectra limits the contribution of PANH cations and the fits have to use neutral PANHs to avoid inflating the 11.0 μm feature even further. By assuming that all of the 11.0 μm emission is due to PANHs, we derive an upper limit for the contribution of PANH cations to the astronomical 6.2 μm PAH band of ∼12%. The fits further show hydrogenated PANHs significantly contributing in NGC 7023's more benign region, supporting the view that shielded environments could sustain protonated PA(N)Hs.
1. Introduction
Strong emission features at 3.3, 6.2, 7.7, 8.6, 11.2, and 12.7 μm dominate the mid-infrared (IR) spectra of most astronomical objects, including H ii regions, reflection nebulae (RNe), planetary nebulae (PNe), the interstellar medium, and galaxies (see, e.g., Hony et al. 2001; Verstraete et al. 2001; Peeters et al. 2002a; Smith et al. 2007; Gordon et al. 2008; Tielens 2008). These emission features have been ascribed to the UV-pumped IR fluorescence in the vibrational modes of polycyclic aromatic hydrocarbon (PAH) molecules (Léger & Puget 1984; Allamandola et al. 1985, 1989; Puget & Léger 1989). Because of their high luminosity, their spectral signature has been detected out to redshifts up to z ∼ 4 (Papovich et al. 2006; Teplitz et al. 2007; Siana et al. 2009; Riechers et al. 2014), affirming their presence in the early universe along with potentially important astrobiological implications when considering a PAH world hypothesis (Ehrenfreund et al. 2006).
Extensive studies have shown that the relative strength of the mid-IR PAH emission bands varies between different sources and across extended objects (Hony et al. 2001; Smith et al. 2007; Galliano et al. 2008; Stock et al. 2014; Shannon et al. 2015; Peeters et al. 2017; Boersma et al. 2018). Furthermore, the individual bands’ profiles and peak positions correlate with object type (Peeters et al. 2002a; van Diedenhoven et al. 2004) and, in the case of circumstellar environments (CSEs) associated with post-AGB stars and young stellar objects (YSOs), with the effective temperature of the irradiating star (e.g., Sloan et al. 2007). These observational properties point to distinct PAH subpopulations contributing to the PAH emission, with each responding differently to their local astrophysical environment.
Using spectra obtained by the Short Wavelength Spectrometer (SWS; de Graauw et al. 1996) on board the Infrared Space Observatory (ISO; Kessler et al. 1996) for a wide variety of objects, Peeters et al. (2002a) showed that PAH emission spectra can be classified as A, B, and C, based on the peak positions and widths of the individual bands in the 6–9 μm region. Focusing on the astronomical 6.2 μm PAH feature, class A profiles are asymmetric with a sharp blue rise, peaking at ∼6.22 μm, and have a red tail that can extend out to 6.4 μm. Across all three classes, the 6.2 μm peak position varies between 6.22 and 6.3 μm with the peaks shifting to longer wavelengths for classes B and C. Subsequently, Spitzer-IRS observations have revealed a fourth class of astronomical PAH emission spectra, denoted as class D, encompassing solely post-AGB stars (Matsuura et al. 2014). Their 6.2 μm features are broader than that for classes A−C, peak at 6.24 μm, and are blueshifted when compared to class C.
Laboratory and theoretical studies have shown that PAHs can readily reproduce the class B and C 6.2 μm band positions (e.g., Hudgins & Allamandola 1995a, 1995b; Szczepanski et al. 1992, 1993; Cami 2011; Shannon & Boersma 2019). However, when it comes to the class A 6.2 μm band, matching its blue peak position has proven challenging, especially when considering the 15 cm−1 redshift typically applied to account for some of the effects of anharmonicity when converting laboratory-measured and theoretically computed absorption data into PAH emission spectra (e.g., Hudgins et al. 2001; Bauschlicher et al. 2008; Boersma et al. 2013). Hudgins et al. (2005) showed that the substitution of a carbon atom inside the structure of a highly symmetric PAH with a nitrogen atom to form a polycyclic aromatic nitrogen heterocycle (PANH) induces a blueshift of the 6.2 μm band that brings it into better agreement with the astronomical class A 6.2 μm band position.
Nitrogen is present in high elemental abundances in the CSEs of carbon-rich AGB stars (Reddy et al. 1999), the place where PAHs are thought to form. Here, the PAHs form via acetylene isomerization (Wang & Frenklach 1997) and/or from the processing of large hydrogenated amorphous carbon (HAC) conglomerates (Sloan et al. 2007). PANHs can form by incorporating nitrogen in the PAH skeleton via a bottom-up approach (e.g., Ricca et al. 2001; Parker & Kaiser 2017) and/or the top-down approaches of photofragmentation of PAH cation clusters (Yang et al. 2020) and sputtering of grains. The detection of PANHs in carbonaceous meteorites (Sephton 2002) and PAH nitriles, such as benzonitrile (C6H5(CN)), 1-cyano-1, 3-cyclopentadiene, and 1- and 2-cyano-naphthalene, in the molecular cloud TMC-1 (McGuire et al. 2018; McCarthy et al. 2021; McGuire et al. 2021), strengthens the suggestion that PANHs are present throughout the different stages of the star and planet formation.
Experimental studies of PANHs are hampered by PANHs’ toxicity and by the instability of neutral endoskeletal PANHs due to their radical nature. Therefore, theoretical studies are more amenable to study PANHs. However, recent advances made in density functional theory (DFT) allowing for the treatment of the effects of polarization (Dunning 1989) that are introduced by including nitrogen in aromatic rings, as well as access to increasingly more computational power, motivated this computational study to revisit the possible role of PANHs in explaining the class A 6.2 μm feature and their impact on the PAH spectrum.
This paper is organized as follows. Section 2 describes the theoretical methods used and Section 3 presents the effect of the choice of basis set and nitrogen substitution on the IR spectra. Astrophysical implications are discussed in Section 4 and in Section 5 a summary of the results and conclusions are presented.
2. Theoretical Methods
DFT calculations were performed using the B3LYP hybrid functional (Becke 1993; Stephens et al. 1994), the 6–31G* (Frisch et al. 1984) and the correlation consistent polarized valence triple-zeta (cc-pVTZ; Dunning 1989) basis sets, and the Gaussian 16 suite of programs (Frisch et al. 2016). The 6–31G* and cc-pVTZ basis sets contain polarization functions that allow for the treatment of polarization. While polarization occurs in pure PAHs, it is especially important in PANHs due to the presence of nitrogen, whose electronegativity is larger than that of carbon. The 6–31G* basis set requires less computer time than the cc-pVTZ one (e.g., for C95H24N+ a geometry optimization followed by a harmonic frequency calculation, computed using 28 Intel Xeon core processors, required 5 hr versus 3 days when using the 6–31G* versus the cc-pVTZ basis set) and was used to compute the spectra of PANHs containing two and three nitrogens, and for doubly charged PANHs.
Before computing harmonic frequencies and intensities, PAH and PANH structures were optimized and ensured to have a minimum on the potential energy surface, i.e., without generating imaginary frequencies. The harmonic frequencies were scaled to lower frequencies using values determined via laboratory matrix-isolation experiments (see Bauschlicher & Ricca 2010). For the 6–31G* and the cc-pVTZ basis sets three scaling factors were used, namely 0.959 (6–31G*) and 0.964 (cc-pVTZ) for C–H stretches, 0.9715 (6–31G*) and 0.979 for the 5–10 μm region, and 0.9821 (6–31G*) and 0.975 (cc-pVTZ) for everything above 10 μm (Bauschlicher et al. 2018). The scaling factors used for the 6–31G* and cc-pVTZ basis sets were shown to produce theoretical spectra in agreement with laboratory spectra (Mattioda et al. 2017). The (scaled) PAH and PANH spectra computed using the cc-pVTZ basis set will be made publicly available in the form of an update to the library of computed spectra of the NASA Ames PAH IR Spectroscopic Database 4 (PAHdb; Bauschlicher et al. 2010; Boersma et al. 2014b; Bauschlicher et al. 2018; Mattioda et al. 2020).
The computed frequencies (in cm−1) and band intensities (in km mol−1) were converted into emission spectra using a single-photon emission model in which a PAH is electronically excited by an 8 eV photon and subsequently reaches the ground state via intersystem crossing. The temperature reached by the PAH after photon absorption is calculated using its heat capacity, which is temperature dependent and determined by its harmonic vibrational levels. The subsequent emission of IR photons cools the PAH molecule. The resulting emission spectrum is averaged over the entire cooling cascade, where the PAH relaxes from the highest excitation level to the vibrational ground state (see, e.g., Boersma et al. 2011; Bauschlicher & Ricca 2010; Boersma et al. 2014b). Gaussian line profiles were used when comparing with observations. The following full widths at half maximum (FWHM) values were used: 30 cm−1 for bands shortward 9 μm, 10 cm−1 for bands between 10 and 15 μm, and 5 cm−1 for bands between 15 and 20 μm. The FWHM was scaled linearly from 30–10 cm−1 for bands between 9 and 10 μm. These FWHM values match the bandwidths observed in astronomical PAH spectra (Peeters et al. 2002a; van Diedenhoven et al. 2004). No redshift was applied to account for potential anharmonicity effects.
3. Results and Analysis
Hudgins et al. (2005) reported on the theoretical study of the IR spectral characteristics of PANHs derived from highly symmetric PAHs, such as coronene (C24H12), ovalene (C32H14), circumcoronene (C54H18), and circumcircumcoronene (C96H24), using the 4–31G basis set. These authors showed that the presence of one or more nitrogens within the interior of the carbon skeleton, i.e., endo PANHs, induces a blueshift of the 6.2 μm band position that brings it into agreement with the astronomical class A position. The magnitude of the blueshift increases as the nitrogen(s) move inward toward the center. This led those authors to conclude that endo PANHs are the likely carriers of the astronomical class A 6.2 μm band. Here, this work is extended to PANHs with a broader range of structures, using the larger and more accurate 6–31G* and cc-pVTZ basis sets. A comparison of emission spectra computed using the 4-31G, 6-31G*, and cc-pVTZ basis sets is given in Figure 11, Appendix A.
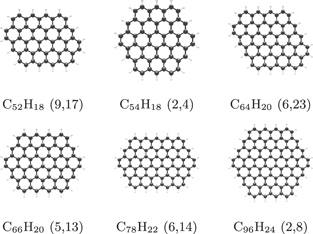
The structures of the six parent PAHs used to obtain PANHs by substituting carbon atoms in their skeleton by nitrogens are shown in Table 1 and contain ∼50 carbon atoms or more, consistent in size with cosmic PAHs (e.g., Tielens 2008). The focus is on PAHs with straight edges, as they constitute a subpopulation that has been shown to contribute to the emission in astronomical class A sources (Ricca et al. 2018). Table 1 provides the number of unique singly nitrogen-containing PANH isomers that can be formed from each parent PAH, separating out PANHs with nitrogen located at their outer edge (1-exo PANH) and interior (1-endo PANH). The spectra of 30 singly nitrogen substituted exo, 79 endo, and 30 hydrogenated (exo) PANHs containing one N−H bond (1NH exo PANHs), in a number of charge states, were computed (see Table 2).
Table 1. Chemical Structures of the Six Parent PAHs used to Construct 1-exo and 1-endo PANHs with the Number of Unique 1-exo and 1-endo Structures given in Parenthesis
| Chemical Structures | ||
|---|---|---|
| ||
Download table as: ASCIITypeset image
Table 2. Breakdown of Computed PANH Species by Charge, Composition, and Size
| PA(N)H Type | Charge b | Computed Spectra per Charge State | ||||
|---|---|---|---|---|---|---|
| Number of Carbon Atoms | Total | |||||
| 31–50 | 51–70 | 71–100 | >101 | |||
| Pure c , d , a | neutral, cation, anion | 1 | 8 | 6 | 1 | 16 |
| Pure d , a | dication | 1 | 4 | 3 | 1 | 9 |
| 1-exo PANHs c | neutral, cation, anion | ⋯ | 22 | 8 | ⋯ | 30 |
| 1-endo PANHs c | neutral, cation, anion | ⋯ | 57 | 22 | ⋯ | 79 |
| 2-exo PANHs d | neutral, cation, anion, dication, dianion | ⋯ | 15 | 23 | ⋯ | 38 |
| 2-endo PANHs d | neutral, cation, anion, dication, dianion | ⋯ | 15 | 53 | ⋯ | 68 |
| 3-exo PANHs d | neutral, cation, anion, dication, dianion, trication, trianion | ⋯ | ⋯ | 95 | ⋯ | 95 |
| 3-endo PANHs d | neutral, cation, anion, dication, dianion, trication, trianion | ⋯ | ⋯ | 121 | ⋯ | 121 |
| Hydrogenated PANHs: 1 NH c , e | neutral, cation, anion | ⋯ | 22 | 8 | ⋯ | 30 |
| Hydrogenated PANHs: 2 NH c , f | neutral, cation, anion | ⋯ | 6 | ⋯ | ⋯ | 6 |
Notes.
a Pure PAHs have been computed, but are not the focus of this paper. b Anions have been computed, but are excluded in the analysis as they are not expected to be abundant in space. c cc-pVTZ basis set calculations. d 6–31G* basis set calculations. e 1 NH bond is present. f 2 NH bonds are present.Download table as: ASCIITypeset image
In Section 3.1 we show the effect of the number of nitrogen substitutions and their positions in the ring on the stability of the PANH. Section 3.2 focuses on the peak position of the 6.2 μm band and Section 3.3 looks into relative band strength ratios. Lastly, in Section 3.4 we investigate the effects of charge and number of exo nitrogens on the spectra.
3.1. Stability
Pure and nitrogenated C54H18 and C96H24 are used to assess the effect of the number and position of substituted N on PANH stability. Given an estimated N/C ratio of ∼1/30 for astronomical dust (Hudgins et al. 2005), up to two and three nitrogen substitutions are considered for C54H18 and C96H24, respectively. A nitrogen can either substitute a carbon residing on the edge or one located further inside the skeleton to form an exo or endo PANH, respectively.
The average binding energy per carbon/nitrogen (Eb ) is calculated via:

where AE is the atomization energy, nCH and nNH are the number of C−H and N−H bonds, nC and nN are the number of carbon and nitrogen atoms, and De (C−H) and De (N−H) are the average C−H and N−H bond energies. The binding energies were computed using the 6–31G* basis set and are reported in Table 3.
Table 3. Effect of the Number of Nitrogen Substitutions and their Positions on the Average Binding Energy per Carbon/Nitrogen
| Binding Energies (eV) a | ||
|---|---|---|
| Species | Neutral | Cation |
| C54H18 | 6.48 | 6.58 |
| 1-exo C53H17N | 6.48 | 6.58 |
| 1-endo C53H18N | 6.41 | 6.54 |
| 1-exo 1-endo C52H17N2 | 6.39−6.40 | 6.52–6.53 |
| 2-exo C52H16N2 | 6.45−6.47 | 6.55–6.57 |
| 2-endo C52H18N2 | 6.31−6.34 | 6.44–6.47 |
| C96H24 | 6.70 | 6.76 |
| 1-exo C95H23N | 6.70 | 6.76 |
| 1-endo C95H24N | 6.66 | 6.74 |
| 1-exo 1-endo C94H23N2 | 6.65−6.66 | 6.73 |
| 2-exo C94H22N2 | 6.68–6.69 | 6.74–6.76 |
| 2-endo C94H24N2 | 6.61–6.63 | 6.68–6.70 |
| 3-exo C93H21N3 | 6.68–6.69 | 6.74–6.75 |
| 3-endo C93H24N3 | 6.57–6.59 | 6.65–6.66 |
Note.
a Computed using the B3LYP/6–31G* approach and averaged over a large number of isomers.Download table as: ASCIITypeset image
The table shows that the stability of 1-exo PANHs is the same as that of their parent “pure” PAH. The presence of one exo nitrogen does not disrupt the aromaticity as its lone pair, i.e., a pair of valence electrons that are not shared with another atom in a covalent bond, is in the molecular plane and perpendicular to the π aromatic system. The presence of two or three exo nitrogens (2- and 3-exo) slightly decreases the stability when they are close to each other and experience lone pair−lone pair repulsion.
For endo PANHs, the presence of one N lowers the average binding energy when compared to its parent PAH. The decrease in stability is more pronounced for neutrals than cations. In neutral endo PANHs, the nitrogen lone pair is part of the π aromatic system, creating an excess of charge resulting in increased repulsion. Removal of one electron from the nitrogen lone pair in cationic endo PANHs reduces the repulsion somewhat, but does not completely eliminate it because nitrogen is more electronegative than carbon and has a tendency to accumulate charge. The stability of endo PANHs decreases with the number of nitrogens as the aromaticity becomes more and more disrupted. Therefore, endo PANHs with more than a single substitution are not expected to be predominant in harsh radiation environments, but could survive in low radiation environments.
3.2. The 6.2 μm Band
Figure 1 shows the shift in peak position of the 6.2 μm emission band of PANHs when substituting one carbon by a single nitrogen in highly symmetric PAH cations. These PANHs are derived from circumcoronene (C54H18 +), circumovalene (C66H20 +), and circumcircumcoronene (C96H24 +). The peak positions were determined from spectra computed using the cc-pVTZ basis set. The figure shows for all, except one, a blueshift for each of the unique positions, which increases as the nitrogen moves toward the center. As PANH size increases, the ability of the nitrogen to disrupt the electron density diminishes (Hudgins et al. 2005), which results in a relatively smaller blueshift.
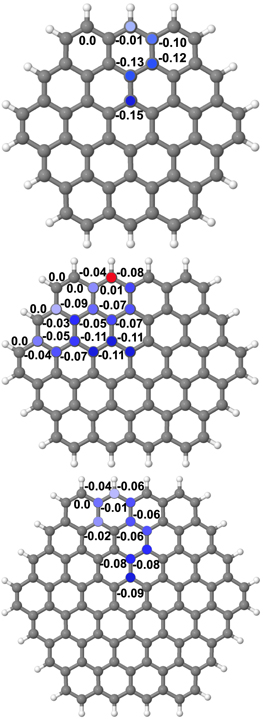
Figure 1. Shifts (in micrometers) of the 6.2 μm band as a function of nitrogen position computed using the cc-pVTZ basis set. Blue and red dots indicate blue and redshifts, respectively, with their brightness indicative of the amount. Top: C54H18 +; middle: C66H20 +; bottom: C96H24 +.
Download figure:
Standard image High-resolution imageThe shift in peak position of the 6.2 μm emission band for PANHs obtained by substituting one carbon by a single nitrogen in less symmetric and elongated PAH cations, i.e., C52H18 + and C64H20 +, is shown in Figure 2. For these molecules, both blueshifts and redshifts occur, with magnitudes that are smaller than those seen for the highly symmetric PANHs. Blueshifts are obtained along the principal axes of symmetry and tend to be larger as the nitrogen moves toward the center, where it is more effectively drawing charge from neighboring carbon atoms. This is consistent with the results for the highly symmetric PANHs, where each of the unique nitrogen positions tends to align along the major axis of symmetry.
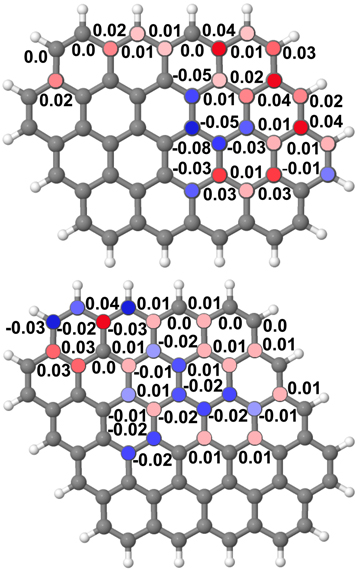
Figure 2. Shifts (in micrometers) of the 6.2 μm PAH emission band as a function of nitrogen position computed using the cc-pVTZ basis set. Blue and red dots indicate blue and redshifts, respectively, with their brightness indicative of the amount. Top: C52H18 +; bottom: C64H20 +.
Download figure:
Standard image High-resolution imageFigure 3 shows that 1-exo PANH cations have 6.2 μm band positions that span the same range as their parent PAHs. Exo PANHs could be protonated at the nitrogen site due to their large proton affinity. Protonated exo PANH with one N−H bond (1NH exo PANH) cations have 6.2 μm band positions that span a broader range than the unprotonated 1-exo PANHs, ranging from 6.17 to 6.45 μm. The 1-endo PAH cations have the majority of the 6.2 μm band positions in the same region as for 1-exo PAH cations except for a number of C–C stretching frequencies of highly symmetric structures, peaking at shorter wavelengths, down to 6.13 μm. Band positions at wavelengths ≤ 6.2 μm are due to PANHs derived from the highly symmetric PAHs C54H18, C66H20, and C96H24.
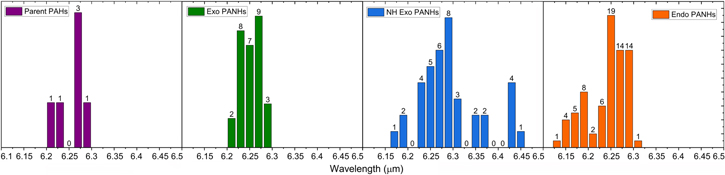
Figure 3. Histograms of the binned 6.2 μm band positions as a function of the number of occurrences for pure PAH cations (C52H18 +, C54H18 +, C64H20 +, C66H20 +, C78H22 +, and C96H24 +), 1-exo PANH cations, 1NH exo PANH cations, and 1-endo PANH cations derived from the pure PAH cations mentioned above. A bin size of 0.02 μm was used to produce the histograms and the 6–31G* basis set has been used in the calculations.
Download figure:
Standard image High-resolution image3.3. Relative Band Intensities
Relative band intensities are affected when substituting a carbon for a nitrogen atom. This is especially true for highly symmetric PANHs (e.g., those derived from C54H18; Figure 12 in Appendix A). The 3–20 μm spectra of the two exo PANH cations (positions 1 and  ) are very similar to those of their parent PAH, with the 6.2 μm band more intense than the 11.0 μm band. However, for the four endo PANH cations (2N, 3N, 4N, and 5N), the 11.0 μm band becomes more intense than the 6.2 μm band, with the 11.0/6.2 μm PAH band strength ratio increasing as nitrogen moves closer to the center of the molecules, i.e., moving from 2N to 5N. Furthermore, as the intensity of the 11.0 μm band increases, so does the intensity of weaker bands beyond 11.0 μm and that of the 3.3 μm band. The presence of nitrogen in the PAH skeleton lowers the overall molecular symmetry, which leads, on top of the shifts in band positions discussed in Section 3.2, to an increase in the number of bands between 7 and 9 μm.
For neutral exo PANHs the dominant feature is the 11.2 μm band, whereas for the corresponding cations the dominant feature is the 6.2 μm band. For endo PANHs the strongest band peaks at 11.2 and 11.0 μm for the neutrals and cations, respectively. For endo PANH cations the intensity of the 11.0 μm band grows as the nitrogen moves toward the center, whereas for the neutrals the 11.2 μm band is little affected. Endo PANH cations have a more intense 6.2 μm band than the corresponding neutrals. Neutral endo PANHs have sizable bands in the 7–9 μm range in contrast to their parent neutral PAHs (see Figures 13 and 14 in Appendix A for the spectra).
As with highly symmetric PANHs, the nine less symmetric exo PANH cations have 3–20 μm spectra that are very similar to those of their parent PAH (see Figure 15 in Appendix A), whereas the seventeen spectra of their endo PANH counterparts become more complex with new bands appearing across the entire 7–20 μm region and changing intensities of the main bands, i.e., the 7.7 μm band decreases, and the 3.3 and 11.0 μm bands increase (see Figure 16 in Appendix A). The 11.0/6.2 μm band strength ratio again varies with nitrogen position and increases when the substitution is placed closer to the center of the molecule.
The 1NH exo PAH cations have a more intense 6.2 μm band, weaker 7.7 and 8.6 μm bands, and a similar 11.0 μm band compared with their parent pure PAH and unprotonated exo PANHs (see Figure 15 in Appendix A).
For both highly symmetric and more irregular PANHs, the 3.3 μm band is generally more intense for endo than exo PANH cations. This is due to endo PANHs having the same number of hydrogens compared to their parent molecule, while exo PANHs have less. Furthermore, PANH bands between 7 and 9 μm typically become broader and shift in position when compared to those in their parent PAH. For endo PANH cations, the intensity of the 7.7 μm band decreases and the 11.0 μm band becomes stronger than the 6.2 μm band as the nitrogen moves toward the center of the molecule. In addition, the presence of nitrogen has also an impact on the 15–20 μm region, where the number of bands, their positions, and relative intensities again depend on the location of the N substitution.
This work relies on emission spectra calculated in the harmonic approximation. While computing full anharmonic PA(N)H emission spectra is far beyond the scope of this paper, Appendix B explores some possible effects of anharmonicity on coronene-derived (C24H12) PA(N)Hs and shows that relative PAH band strengths can be diversely affected.
3.4. Effects of Double Positive Charge and Double Nitrogenation
The effects of double positive charge and double nitrogenation on the 3–20 μm emission spectrum of PANHs derived from C54H18 are calculated using the 6–31G* basis set. We computed the spectra of 16 singly charged pure cations, 9 doubly charged pure cations, 38 singly charged 2-exo PANHs, and 38 doubly charged 2-exo PANHs (see Table 2). The 2-endo PANHs were not considered as they are less stable than 2-exo PANHs. The bands between 6 and 9 μm for doubly charged pure PAHs and PANHs tend to be redshifted when compared to the singly charged cations. This includes the 6.2 μm band, which is redshifted compared with the astronomical class A 6.2 μm PAH band. Conversely, the 11.0 μm position is shifted to the blue in the dications. The largest differences in the 6.2/11.0 μm band strength ratio and the 11.0 μm intensity are seen when the two nitrogens are placed at maximum separation, e.g., for positions ag and al. For positions ag, al, and ad, the 11.0 μm band is strong for the cations. Overall, we do not find any systematic behavior between the (molecular) position of the nitrogens and the peak position of the emission bands. The dications show much less emission in the 10–15 μm range and 3 μm range than in the 6–9 μm as compared with the monocations (see Figures 17 and 18 in Appendix A).
4. Astronomical Implications
With the new information reported in this work, we reassess the attribution of astronomical class A 6.2 μm profiles to PANHs and consider its impacts on the entire PAH spectrum. In Section 4.1 we examine the nature and origin of the astronomical 6.2 μm band. This is followed in Section 4.2 with an investigation of the astronomical 6.2/11.0 μm PAH band strength ratio and in Section 4.3 we interpret the results from spectroscopic fits to astronomical data.
4.1. The Astronomical 6.2 μm Band
Figure 4 shows the position of the 6.2 μm PAH band in pure PAH cations with straight edges as a function of PAH size and structure calculated using the cc-pVTZ basis set. The figure shows that using the superior basis set brings the 6.2 μm band positions in many of these pure PAHs in closer agreement with that of the astronomical class A position (λcenter = 6.229 μm;  = 6.219 μm; Peeters et al. 2002a). Thus, pure PAHs could account for PAH class A 6.2 μm emission. Furthermore, the position of the 6.2 μm band does not correlate with PAH size, as previously reported (Maragkoudakis et al. 2020). Figure 4 shows that mostly asymmetric PAHs contribute to the 6.20–6.25 μm range. This does not hold for the 6.25–6.30 μm range for which both highly symmetric PAHs (e.g., C54H18, C66H20, and C96H24) and slightly asymmetric PAHs (e.g., C64H20, C71H21, C87H23, and C103H25) have 6.2 μm bands falling at similar positions. PAHs with elongated shapes tend to have 6.2 μm bands falling beyond 6.35 μm.
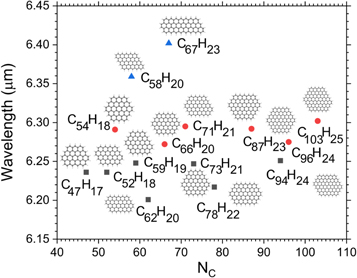
Figure 4. Effect of structure and size on the position of the 6.2 μm PAH emission band of pure PAH cations computed using the cc-pVTZ basis set. Black squares denote PAHs with band positions between 6.20 and 6.25 μm, red circles PAHs with band positions between 6.25 and 6.30 μm, and blue triangles PAHs with band positions beyond 6.30 μm.
Download figure:
Standard image High-resolution imagePeeters et al. (2002a) hypothesized that all astronomical 6.2 μm class B profiles are a combination of two components with extreme peak positions: one being class A (λpeak=6.215 μm) and the other class C (λpeak=6.299 μm). Those authors showed that the intensity fraction of the red tail falls between 30% and 47%. To investigate this further, we turn to available Spitzer-IRS spectral map data on the RN NGC 7023. The left image of Figure 5 shows Hubble Space Telescope Advanced Camera for Surveys (ACS) imagery of a part of NGC 7023's northwest photodissociation region (PDR) that encompasses the Spitzer data. The positions labeled I and II probe two distinct environments across the PDR interface, which is outlined by the H2 S(1) contours. Position I probes the more benign molecular cloud region and position II the more exposed diffuse region. The data are taken from Boersma et al. (2013) and the reader is referred there for details on data reduction and the steps taken to isolate the PAH spectra.
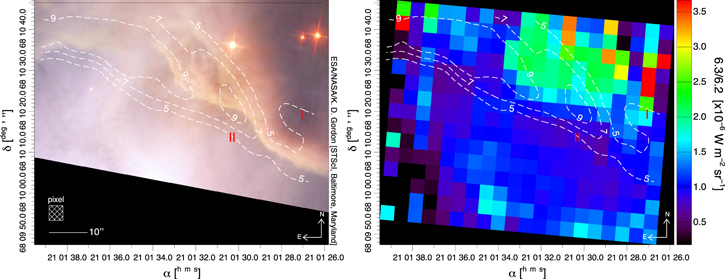
Figure 5. Left: three-color composite Hubble Space Telescope ACS image of part of the northwest PDR in the RN NGC 7023. The red channel is taken from the combined optical Hα (658 nm) and IR I-band (850 nm) filters, the green channel from the optical V-band (625 nm) filter, and the blue channel from the optical B-band (475 nm) filter. The main star illuminating the region, HD 200775, is located to the southeast, just outside the field of view (FOV). The FOV of the image coincides roughly with that of Spitzer-IRS spectral map data, whose pixel size has been indicated by the shaded box. The locations of positions I and II have been indicated. The (dashed) contours follow the 17 μm S(1) H2 line intensity, which traces the PDR. The contour levels have been set at 5, 7, and 9 × 10⁻²¹ W cm−2. Right: map of the strength of the 6.3 over the strength of the 6.2 μm component as determined by a multi Gaussian decomposition of the 6.2 μm PAH feature. The color range has been set such that there is a 1% and 1.1% cutoff on the low and high end, respectively, of the normalized cumulative distribution of ratios, which helps suppress outliers. See Section 4.1 for details.
Download figure:
Standard image High-resolution imageThe emission between 5.8 and 6.6 μm is simultaneously fitted with four Gaussians, centered at 5.90, 6.04, 6.21, and 6.31 μm, with the latter two decomposing the 6.2 μm band, and a straight line. The centroids are allowed to vary by ±15 cm−1. Gaussian widths are set to 8, 17.05, 13.88, and 21.77 cm−1 for the 5.90, 6.04, 6.21, and 6.31 μm profiles, respectively, which are allowed to vary by ±5 cm−1. The initial centroids were determined from a fit to the average profile across the entire region and the slight variation allowed for the profile widths are there to absorb any potential wavelength calibration issues (see, e.g., Peeters et al. 2017). The fitting is performed using MPFIT 5 (Markwardt 2009) and is done in wavenumber space (in cm−1).
The right image in Figure 5 depicts the spatial variation of the strength of the Gaussian centered at 6.3 over that centered at 6.2 μm, revealing the ratio spans a range of 0–3. The redder component appears to be more prominent inside the PDR (i.e., beyond the PDR front as traced by H2). If indeed the two components probe two distinct PAH populations, this indicates each responds differently to the changing environment when crossing the PDR from the dense (exemplified by position I) into the diffuse medium (exemplified by position II). In addition, it suggests that the 6.3 μm component (i.e., the class C 6.2 profile) is more susceptible to UV processing, which is consistent with the observed relationship between peak position and the effective temperature of the central star in YSOs and post-AGB stars (Sloan et al. 2007).
Pure PAHs with straight edges span the entire 6.2–6.3 μm range and can reproduce the class A 6.2 μm profile (see Figure 6). However, their geometries have similar stabilities and should not respond differently to the UV environment (except for very elongated PAHs that are less stable). Therefore, they are unlikely to explain the difference in the decomposition of the 6.2 μm PAH band at position I and II (and thus the difference in strength of the Gaussian centered at 6.3 over that centered at 6.2 μm).
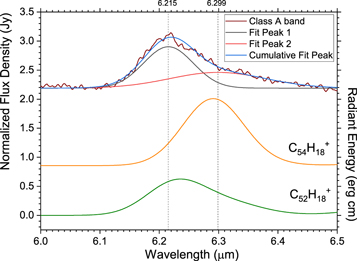
Figure 6. The 6.2 μm band, computed using the cc-pVTZ basis set, of an example of a slightly asymmetric compact PAH cation (C52H18 +; green curve) and a highly symmetric compact PAH cation (C54H18 +; orange curve) and the astronomical class A 6.2 μm band (purple curve). The astronomical class A 6.2 μm emission band is fitted using two Gaussians denoted as “Fit Peak 1” (gray) and “Fit Peak 2” (red) with fixed centers at 6.215 and 6.299 μm, respectively. The resulting nonlinear fit, denoted as “Cumulative Fit Peak” (blue curve) has an R2 value of 0.978.
Download figure:
Standard image High-resolution image4.2. The 6.2/11.0 μm PAH Band Strength Ratio in PANHs
Boersma et al. (2013) studied the combined low- (SL) and high-resolution (SH) Spitzer-IRS spectral map of the northwest PDR in the RN NGC 7023 (Figure 5) using a database-fitting approach and utilizing the data and tools provided by PAHdb. Those authors affirmed the need for PANHs to match emission at 6.2 μm (note their application of a 15 cm−1 redshift). However, they also noticed a strong contribution of PANHs to the 11.0 μm band that, subsequently, was also observed in database fits of other sources (e.g., Boersma et al. 2016, 2018). The 11.0 μm PAH band, a distinct satellite feature of the much stronger 11.2 μm PAH band, is usually attributed to pure PAH cations. While on the one hand this introduces ambiguity between PANHs and pure PAH cations, on the other hand it could provide a constraint on the amount of PANHs that can contribute to the astronomical 6.2 μm emission.
To this end, the relevance of exo and endo PANHs are assessed by computing the 6.2cation/11.2neutral and 11.0cation/11.2neutral band strength ratios (see Ricca et al. 2012) for the PANHs considered here containing one nitrogen, as well as the parent PAH they were derived from, assuming an ionization fraction of 0.5. Figure 7 plots these ratios against one another and compares them to those measured for NGC 7023 (Boersma et al. 2013), where the 11.0 μm satellite feature was readily isolated from the 11.2 μm PAH band in the high-resolution data (see Figure 3 of Boersma et al. 2013). The figure shows that exo PANHs have ratios that are similar to those of their parent PAH (see Section 3.3) and are closer to the ratios observed in NGC 7023 (Boersma et al. 2013) than those of endo PANHs. Nonetheless, there is not a great deal of overlap between the observations and the endo PANHs or their parent PAHs. Appendix C presents plots of some other ratios that could be of potential interest to the reader.
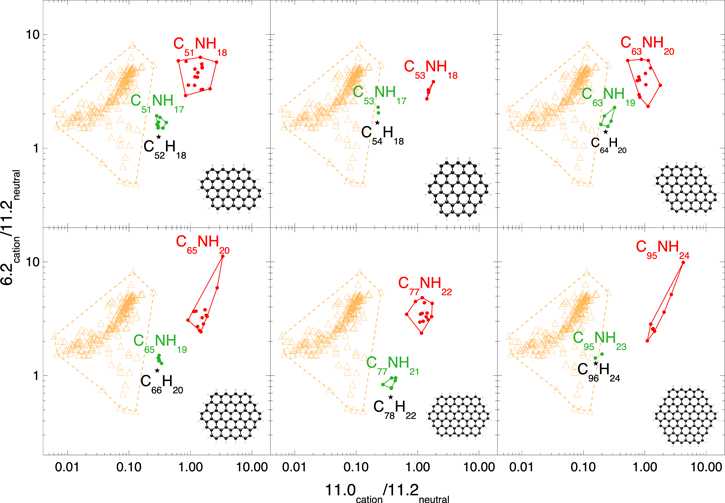
Figure 7. Comparison of the 6.2/11.2 vs. 11.0/11.2 band strength ratios as observed in the northwest PDR of NGC 7023 (orange; Boersma et al. 2013) with the 6.2cation/11.2neutral vs. 11.0cation/11.2neutral ratios for the PA(N)H spectra computed in this paper, separated in panels according to their parent PAH, at an ionization fraction of 0.5. The parent PAH is shown as the black star (⋆), 1-exo PANHs in green, and 1-endo PANHs in red. See Section 4.2 for details.
Download figure:
Standard image High-resolution imageOf course, this interpretation assumes an ionization fraction of 0.5 and that the 6.2 and 11.0 μm bands are solely carried by cations and the 11.2 μm band solely by neutrals, which is not the case (see Figure 9; e.g., Boersma et al. 2013, 2014a, 2015,2016, 2018; Shannon et al. 2016). Reducing the ionization fraction from 0.5 would move the computed data toward the observations, but a match with the observations would require the 11.0cation/11.2neutral band strength ratio to be reduced by an order of magnitude, i.e., from ∼1→∼0.1 for the 1-endo PANHs, which would also move the 6.2cation/11.2neutral from ∼5→∼0.5. Besides undercutting the observations, 10 times more neutrals than cations seems unrealistic for the environment considered here. Leaving the observed 6.2 and 11.0 μm bands largely ascribed to cations but assuming that some fraction of the 11.2 μm band is also due to cations would effectively move the observed ratios toward the computed ones, i.e., both the 6.2cation/11.2neutral and 11.0cation/11.2neutral ratios increase by the same factor. However, compensating for any dehydrogenation, which effectively increases the observed 11.0 and 11.2 μm band strengths, would push the observations further away from the calculated ratios.
Another observation is that the range in both ratios for endo PANHs appears to roughly correlate with the effective radius of the species, reff, which is summarized in Table 4. The table shows that in two out of the six cases the spread in the ratios (in terms of the standard deviation over the mean) increases with increasing effective radius.
Table 4. Effective Radius and Spread of the Ratios for the Exo and Endo PANHs in Figure 7
| reff a | Exo σ/Mean (%) | Endo σ/Mean (%) | |||
|---|---|---|---|---|---|
| (Å) |

|

|

|

| |
| C52 | 5.4 | 9.0 | 13 | 24 | 35 |
| C54 | 5.5 | 7.9 | 0.98 | 15 | 11 |
| C64 | 6.1 | 15 | 18 | 28 | 33 |
| C66 | 6.2 | 6.2 | 5.0 | 62 | 41 |
| C78 | 6.9 | 9.5 | 16 | 19 | 22 |
| C96 | 7.7 | 5.8 | 18 | 70 | 58 |
Note.
a Å, where 5.09 Å is the area of a single aromatic sextet.
Download table as: ASCIITypeset image
Overall, exo PANHs have 6.2cation/11.2neutral versus 11.0cation/11.2neutral ratios that are more consistent with those observed for astronomical class A sources. To the contrary, endo PANHs seem to be favored when explaining the position of the astronomical 6.2 μm PAH class A band; see Figure 3. A very rough estimate for the upper limit of the fraction of emission from endo PANH cations able to contribute to the 6.2 μm PAH band can be obtained by assuming all of the 11.0 μm emission is due to singly ionized endo PANH cations:

Taking for the observed values those reported for NGC 7023 by Boersma et al. (2013) and for the endo PANHs their average values (4.1 ± 0.6 and 1.6 ± 0.4 for 6.2PANHs and 11.0PANHs, respectively) results in the histogram shown in Figure 8. The histogram shows that, in the specific case of NGC 7023, no more than ∼2%–8% of the observed 6.2 μm PAH emission can be due to endo PANHs for most pixel positions. In the most “favorable” case, i.e., assuming a plus and minus 1σ value for 6.2PANHs and 11.0PANHs, respectively, this range can be pushed out by 4% to ∼6%–12%.
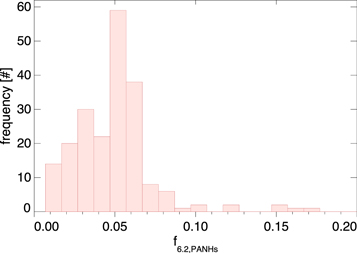
Figure 8. Distribution of the fraction of 6.2 μm PAH emission that can be attributed to endo PANH cations for the northwest PDR in the RN NGC 7023 when assuming all of the observed 11.0 μm emission is due to endo PANH cations. See Section 4.2 for details.
Download figure:
Standard image High-resolution image4.3. Spectroscopic Fitting
Spectroscopic fitting offers a direct means of establishing the (sub-)populations contributing to an astronomical PAH spectrum (e.g., Cami 2011; Boersma et al. 2013, 2015; Andrews et al. 2015; Boersma et al. 2016, 2018). To gain insight into the potential for the PA(N)Hs studied in this work to explain the astronomical PAH spectrum, we return to NGC 7023 and take the isolated Spitzer-IRS PAH spectra from Boersma et al. (2014a) of the positions labeled I and II in Figure 5 and fit those with the 322 neutral and singly charged cation PA(N)H spectra computed using the cc-pVTZ basis set. For the fitting and analysis we rely on the AmesPAHdbIDLSuite, 6 which is part of PAHdb. As noted in Section 2, an emission model is required to turn the zero-Kelvin absorption data into PAH emission spectra, of which details are described in Appendix D. Figure 9 shows the fits to the two 5–15 μm spectra. In Appendix D, Table 7 cross-references the PAHs in both fits and presents the chemical formula of each PA(N)H and its contribution in terms of flux (f) and number density (a). Figure 25 in the same Appendix presents an overview of the chemical structures involved in each of the fits, ordered according to their contribution to the fit in terms of flux.
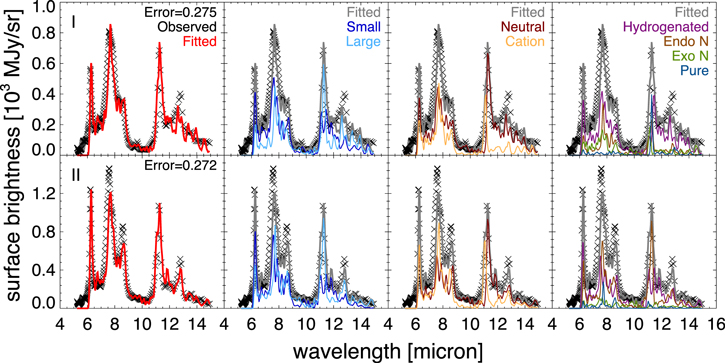
Figure 9. The 5–15 μm Spitzer-IRS spectrum of position I (top row) and II (bottom row) from Boersma et al. (2013) of the RN NGC 7023 fitted using PA(N)H spectra computed in this work. Left: observed spectrum (×), fit (red). Second-from-left: size breakdown of the spectrum into contributions from small (ncarbon ≤ 60; dark blue) and large (ncarbon > 60; light blue) PA(N)Hs. The observed spectrum and total fit are shown as “×” symbols and a gray line, respectively. Second-from-right: charge breakdown of the spectrum into contributions from PAH neutrals (maroon), and cations (orange). Right: compositional breakdown of the spectrum into contributions from pure PAHs (blue), exo PANHs (green), endo PANHs (maroon), and hydrogenated exo PANHs (purple). See Section 4.1 for details.
Download figure:
Standard image High-resolution imageFigure 9 shows fits with errors, computed as the area (in wavenumber space) of the absolute value of the residual over the area of the astronomical spectra, that are on par, if not slightly improved, compared to those reported in Bauschlicher et al. (2018). It should be noted, however, that there are slight differences in the details of the PAH emission model employed in both studies (see Appendix D). Table 5 summarizes the breakdown in terms of fractions. The table shows the fraction of large (ncarbon > 60) PA(N)Hs at position I is lower than that at position II. With position II in the diffuse medium and closer to the irradiating star, it has an expected higher ionized fraction. In terms of total nitrogen content, there is a small difference of 2% (93 versus 95%) favoring position II. Both positions prefer endo over exo PANHs, with between position I and II a difference of 33% and 6%, respectively. The contribution from hydrogenated PANHs is significant at 18% at position I, which reflects the more benign environment allowing the hydrogen to more readily stay attached to the nitrogen. Moreover, the few pure PAHs spectra available in the pool (32/322) have small contributions, namely 7% and 5% for position I and II, respectively.
Table 5. Fractional Breakdown of Spectroscopic Fits
| Fractions | |||||
|---|---|---|---|---|---|
| Position | Large a | Cation | Endo-N | Exo-N | 1NH Exo-N |
| I | 0.41 | 0.36 | 0.54 | 0.21 | 0.18 |
| II | 0.49 | 0.44 | 0.46 | 0.40 | 0.09 |
Note.
a ncarbon > 60.Download table as: ASCIITypeset image
Contrary to Bauschlicher et al. (2018), the bulk of the emission is not carried by only a relatively few PAHs, but rather by a larger number of PA(N)Hs, each contributing less.
While the quality of the overall fit is generally good, it has difficulties matching some of the emission. Some of this can be ascribed to the limited variation in PA(N)Hs considered here. For example, the PA(N)Hs used here have all straight edges and little variation in adjacency classes. Furthermore, only 16 “pure” PAHs were considered. In addition, the pool of PA(N)Hs considered has no anions. Anions typically fill in the red wing of bands (e.g., Boersma et al. 2018). As for differences between the fits, compared to position I the fit for position II struggles to reach the 7.6–7.8 μm peak emission.
Figure 10 takes a detailed look at the 6.2 μm profile fits and compares those to that use version 3.20 of PAHdb’s library of computed spectra. The figure presents the fits broken down in terms of their contribution from pure PAHs (pink) and PANHs (purple). Though not perfect, indeed the fits of the astronomical 6.2 μm PAH band significantly improves in the PA(N)Hs case. In the v3.20 fits to both positions the pure PAHs represent a broad plateau-like component, whereas the PANHs are mostly responsible for the distinct 6.2 μm feature. Instead, the PA(N)H fits show the PAHs and PANHs contributing to both the plateau and distinct 6.2 μm feature, albeit the PAHs to very little degree.
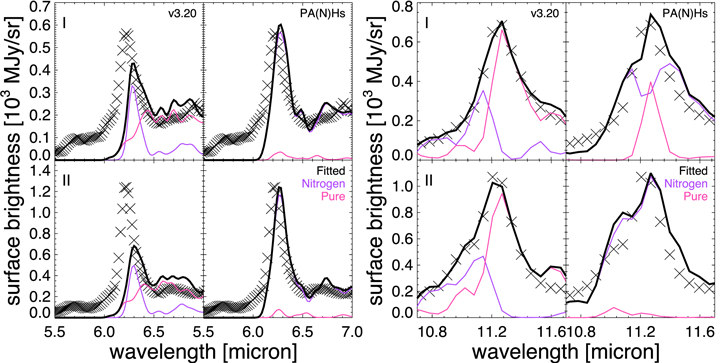
Figure 10. Zoom-in on the isolated 6.2 (left) and 11.2 μm (right) PAH band in the spectrum at position I (top panels) and II (bottom panels) from Boersma et al. (2013) of the RN NGC 7023. The fit, in black, from using PAHdb’s library of computed spectra version 3.20 is shown in the left panels and the fit from Figure 9 is repeated in the right. Also shown is the compositional breakdown in terms of contributions from pure PAHs (pink) and nitrogenated PANHs (purple). See Section 4.3 for details.
Download figure:
Standard image High-resolution imageThe contribution of endo PANH cations to the 6.2 μm band in the PA(N)H fits are 9% and 20% for position I and II, respectively. Initially, this seems to push the upper limits established in Section 4.2 for position II. Figure 10 also takes a detailed look at the 11.2 μm profile fits and compares those. The figure shows a severely overfitted 11.0 μm satellite feature for position II in the PA(N)Hs case, which explains how the contribution from endo PANH cations to the 6.2 μm band is able to surpass the established limits. Figure 9 shows neutral endo PANHs dominating the 6.2 μm PAH band, contributing at 48% and 34% for position I and II, respectively, which is difficult to reconcile with the interpretation of the astronomical 6.2 μm PAH band being mostly an ionized band. Then, Figure 10 shows a regression in the quality of the fit of the 11.2 μm PAH band when moving from v3.20 to PA(N)Hs. Furthermore, whereas the PANHs distinctly carry the emission centered around 11.0 and the pure PAHs that around 11.2 μm in the v3.20 case, in the PA(N)H case both PAHs and PANHs are centered around 11.2 μm, which is exactly the opposite of what is happening for the 6.2 μm PAH band. Thus, while there is an improvement in the fit of the 6.2 μm PAH band, a considerable penalty is incurred for the 11.2 μm PAH band.
4.4. Protonated PANHs and the 2.9 μm band
The nitrogen in exo PANHs has a high proton affinity and is therefore likely protonated when in space (Maclagan et al. 2015). The N−H stretch in these PANHs falls near 2.9 μm. We carefully examined a sample of 98 ISO-SWS spectra of different object types that show the prominent PAH features (largely taken from Peeters et al. 2002b, 2002a) to search for an emission band that could be attributed to the N−H stretch. This search turned up empty handed. Nevertheless, the absence of a detectable 2.9 μm band provides an upper limit for the amount of exo PAHs present in space and the level they could possibly contribute to the astronomical 6.2 μm PAH band.
To derive such upper limit, we first consider the exo PANHs with one protonated nitrogen ranging from C51H18N to C95H24N, in all their distinct permutations, in the three charge states of singly charged anion, neutral, and singly charged cation; see Table 2. For the 2.9/3.3 and 2.9/6.2 μm integrated PAH band strength ratios a median value of 4.3 and 0.12 are found, respectively. Second, taking the ISO-SWS spectrum of the Orion Bar H2S1 as a representative, we estimate a 3.3 μm peak intensity of ∼7 Jy and a continuum level of ∼0.5 Jy. The estimated noise around 2.9 μm is ∼0.1 Jy. Therefore, the maximum contribution from protonated exo PANHs to the astronomical 3.3 μm PAH band is ∼(0.1/4.3)/(7–0.5) = 0.36%. Similarly, in this case the contribution of protonated exo PAHs to the astronomical 6.2 μm PAH band would max out at only ∼0.8 Jy, which is about 2.5% of the observed 6.2 μm peak intensity.
5. Summary and Conclusions
A thorough theoretical study is presented that revisits the role of nitrogen inclusion in PAHs, i.e., PANHs. We consider both substitution of nitrogen on the periphery (exo) and inside (endo) the skeletal PAH structure, and hydrogenated exo PANHs with the additional hydrogen attached on the nitrogen. Special focus is given to the connection of PANHs and the class A astronomical 6.2 μm PAH emission feature, as earlier studies have argued PANHs are needed to explain its very blue 6.22 μm peak position.
DFT using basis sets that include the treatment of polarization (6–31G*, cc-pVTZ) is employed to compute the spectra of 16 pure PAHs, 30 1-exo PANHs, 79 1-endo PANHs, and 30 hydrogenated 1NH (exo) PANHs in a number of charge states. Spitzer-IRS spectral map data of the northwest PDR of NGC 7023 is utilized to examine possible astronomical implications.
The nitrogen substitution on the periphery of the PAH skeleton has very little effect on the stability, but the presence of nitrogen(s) inside the ring creates an excess charge and increased electron repulsion that leads to a decrease in stability.
The treatment of polarization for pure PAHs (i.e., those only containing carbon and hydrogen) with straight edges can now accommodate the peak position of the astronomical 6.2 μm PAH emission feature. For compact PAHs cations the 6.2 μm band position spans the 6.2–6.3 μm range, whereas for very elongated structures it peaks longwards of 6.3 μm.
PANH cations can also accommodate the peak position of the astronomical 6.2 μm PAH emission feature. Exo PANH cations have spectra that are comparable to their pure PAH parent. Endo PANH cations have the majority of the 6.2 μm band positions in the same region as for exo PAH cations, except for a number of C−C stretching frequencies of highly symmetric structures, peaking at shorter wavelengths, down to 6.13 μm. However, they exhibit relatively strong 11.0 μm emission in contrast to the astronomical observations.
The shifts in the peak position of the 6.2 μm band due to the incorporation of nitrogen depend on the geometry of the parent PAH. For highly symmetric PAHs, such as C54H18 and C96H24, only blueshifts are obtained, with the magnitude of the shifts increasing as the nitrogen toward the center of the molecule. For less symmetric PAHs, such as C52H18 and C64H20, both blueshifts and redshifts are obtained.
The 3–20 μm spectra of exo PANHs are very similar to those of their parent PAHs while those of endo PANHs present several differences, namely the intensity of the 11.0 and 3.3 μm bands increases and the overall number of bands increases. For endo PANHs the 11.0/6.2 μm PAH band strength ratio varies with nitrogen position and increases when the substitution is placed closer to the center of the molecule. The 1NH exo PAHs have a more intense 6.2 μm band, weaker 7.7 and 8.6 μm bands, and a similar 11.0 μm band compared with their parent pure PAH and unprotonated exo PANHs. For dications of pure PAHs and PANHs, the bands in the 6–9 μm region are redshifted, whereas the 11.0 μm band is blueshifted.
From the observed 6.2/11.0 μm band strength ratios in NGC 7023 and assuming all of the measured 11.0 μm emission is due to PANH cations, we estimate an upper limit for the contribution, in terms of emission, of PANH cations to the astronomical 6.2 μm PAH band. In the most favorable case, this is ∼12%. A database-fitting approach was performed using the PA(N)H spectra computed in this work using the cc-pVTZ basis set to show that indeed an improved match can be made to the astronomical 6.2 μm PAH band when including neutral and cationic exo and endo PANHs, and that the few pure PAHs considered contribute only little. However, the fit to the 11.2 μm PAH band significantly suffers, in part due to an overestimation of 11.0 μm emission. Furthermore, the restriction imposed by the 11.0 μm emission in the astronomical data constrains the use of PANH cations.
The fits further show hydrogenated (exo) PANHs significantly contributing in NGC 7023's more benign region, supporting the view that shielded environments could sustain protonated PA(N)Hs.
Overall, PANH cations remain a viable candidate to explain the most blueshifted 6.2 μm bands observed, albeit they come with strong 11.0 μm emission.
The two referees are acknowledged for their feedback that helped improve the paper. This work was supported through NASA's Astrophysics Research and Analysis Program (APRA; NNX17AE71G) and the Internal Scientist Funding Model (ISFM) Directed Work Package at NASA Ames titled: “Laboratory Astrophysics—The NASA Ames PAH IR Spectroscopic Database”. C.B. is grateful for an appointment at NASA Ames Research Center through the San José State University Research Foundation (NNX17AJ88A). E.P. acknowledges support from an NSERC Discovery Grant.
Facility: Spitzer (IRS). -
Software: MPFIT (Markwardt 2009), IDL Astronomy User's Library (Landsman 1993), AmesPAHdbIDLSuite (Boersma et al. 2014b).
Appendix A: PANH Spectra
Figure 11 shows the effect of basis sets on the emission spectra of C52H18 +. Figures 12–18 present the 3–20 μm spectra of the different sets of PA(N)Hs considered throughout this work.
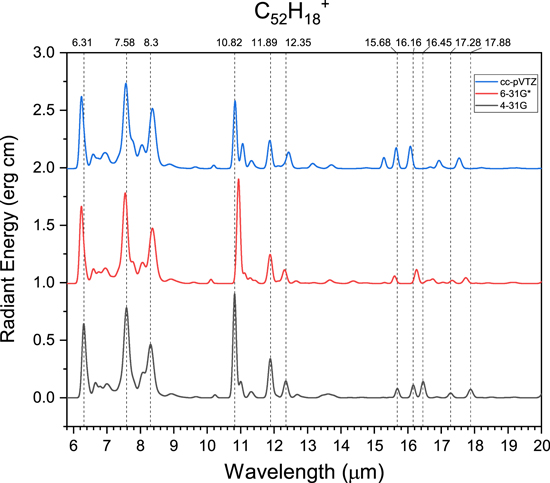
Figure 11. Comparison of the 6–20 μm emission spectra for C52H18 + computed using the 4–31G (black), 6–31G* (red), and cc-pVTZ (blue) basis sets. The peak positions for the 4–31G basis sets are shown with the dotted lines. The 4–31G basis has been previously used in PAHdb to compute the spectra of pure PAHs (Bauschlicher et al. 2010).
Download figure:
Standard image High-resolution image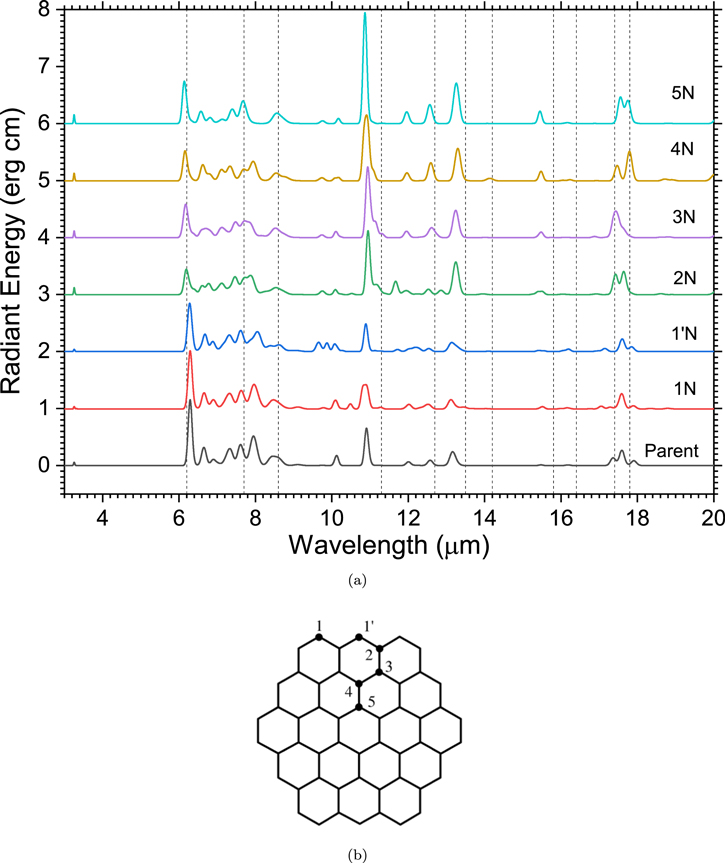
Figure 12. The 3–20 μm emission spectra, computed using the cc-pVTZ basis set, of the parent PAH cation C54H18 + and derived PANHs. Spectra shown from bottom to top: C54H18 + (black), the 1N and 1N’ exo PANH cations C53H17N1 + (red and blue), 2N endo PANH cation C53H18N1 + (green), 3N endo PANH cation C53H18N1 + (purple), 4N endo PANH cation C53H18N1 + (yellow), and 5N endo PANH cation C53H18N1 + (cyan). Vertical lines indicate the nominal PAH band positions, namely 6.2, 7.7, 8.6, 11.3, 12.7, 13.5, 14.2, 15.8, 16.4, 17.4, and 17.8 μm.
Download figure:
Standard image High-resolution image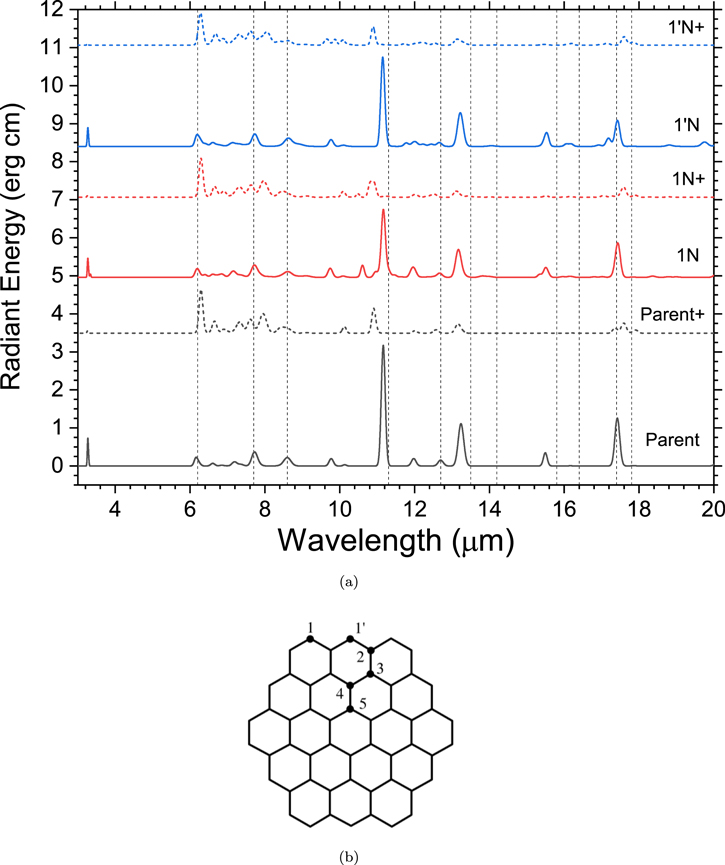
Figure 13. The effect of charge on the 3–20 μm emission spectra of the parent PAH C54H18 and the derived 1N and 1N’ exo PANHs, computed using the cc-pVTZ basis set. Vertical lines indicate the nominal PAH band positions, namely 6.2, 7.7, 8.6, 11.3, 12.7, 13.5, 14.2, 15.8, 16.4, 17.4, and 17.8 μm.
Download figure:
Standard image High-resolution image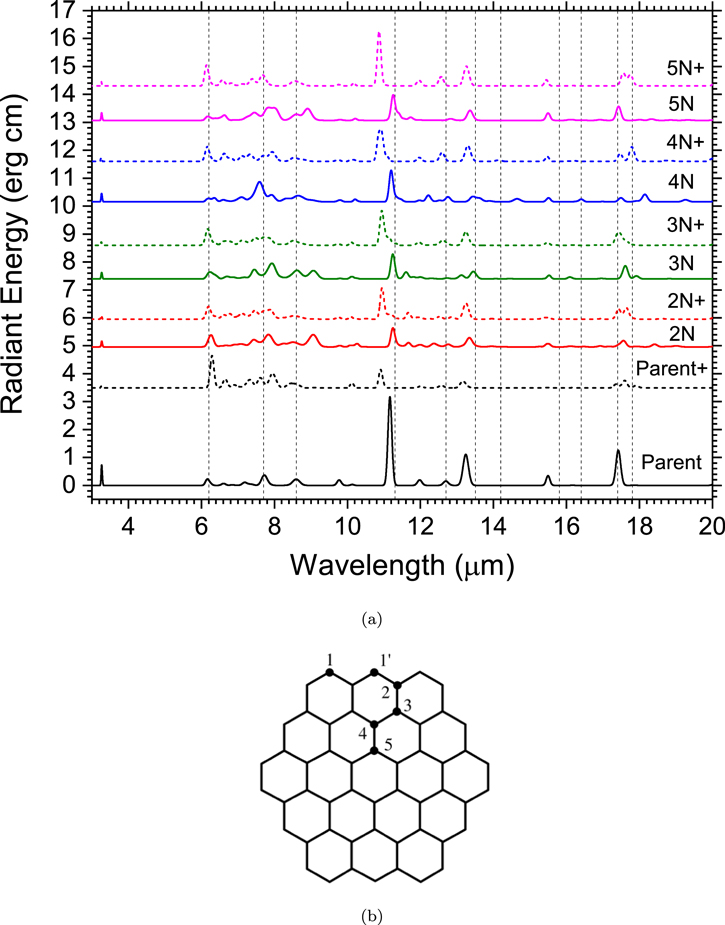
Figure 14. The effect of charge on the 3–20 μm emission spectra of the parent PAH C54H18 and the derived 2N, 3N, 4N, and 5N endo PANHs, computed using the cc-pVTZ basis set. Vertical lines indicate the nominal PAH band positions, namely 6.2, 7.7, 8.6, 11.3, 12.7, 13.5, 14.2, 15.8, 16.4, 17.4, and 17.8 μm.
Download figure:
Standard image High-resolution image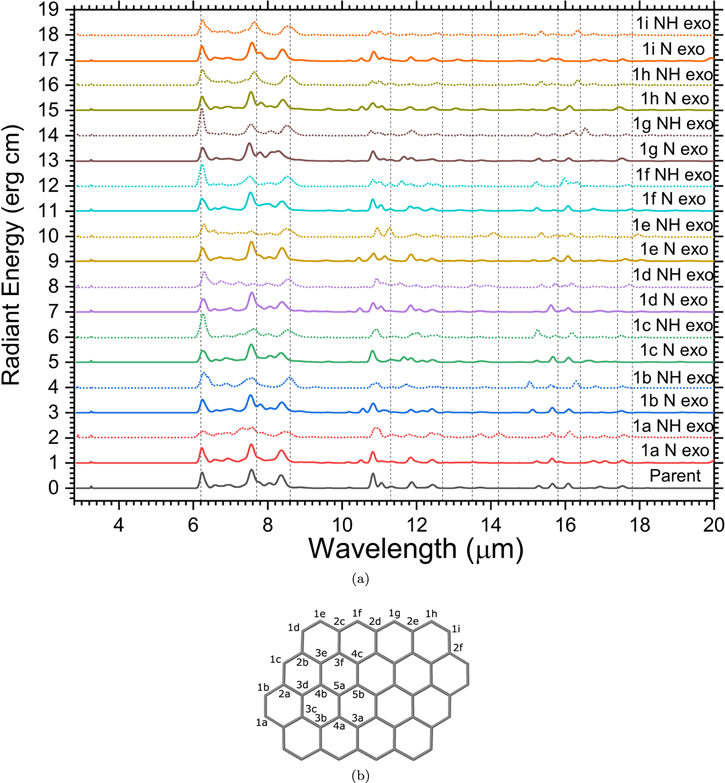
Figure 15. The 3–20 μm emission spectra, computed using the cc-pVTZ basis set, of the parent PAH cation C52H18 + (black line) and the derived exo PANH (solid lines) and 1NH exo PANH (dotted lines) cations. Vertical lines have been added at the nominal PAH band positions, namely 6.2, 7.7, 8.6, 11.3, 12.7, 13.5, 14.2, 15.8, 16.4, 17.4, and 17.8 μm.
Download figure:
Standard image High-resolution image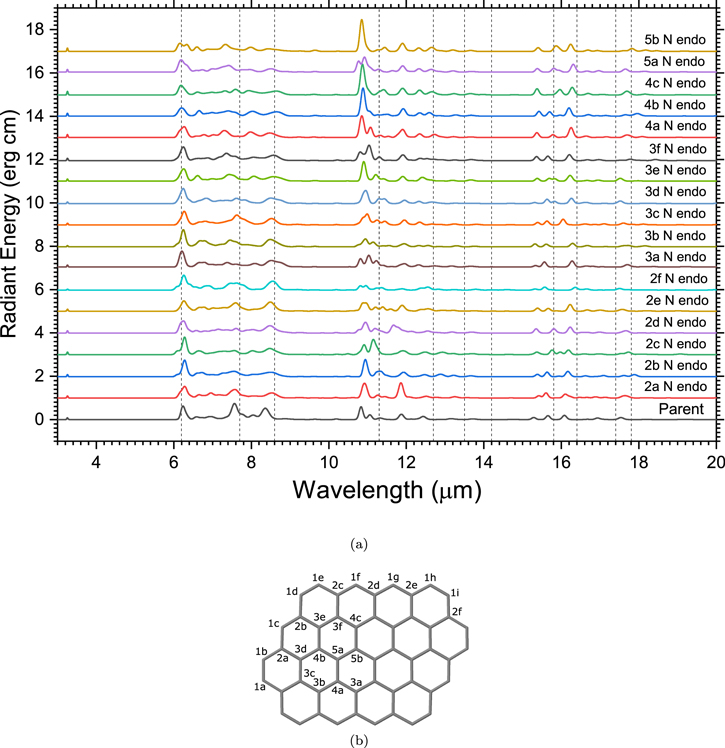
Figure 16. The 3–20 μm emission spectra, computed using the cc-pVTZ basis set, of the parent PAH cation C52H18 + and the endo PANH cations. Vertical lines have been added at the nominal PAH band positions: 6.2, 7.7, 8.6, 11.3, 12.7, 13.5, 14.2, 15.8, 16.4, 17.4, and 17.8 μm.
Download figure:
Standard image High-resolution image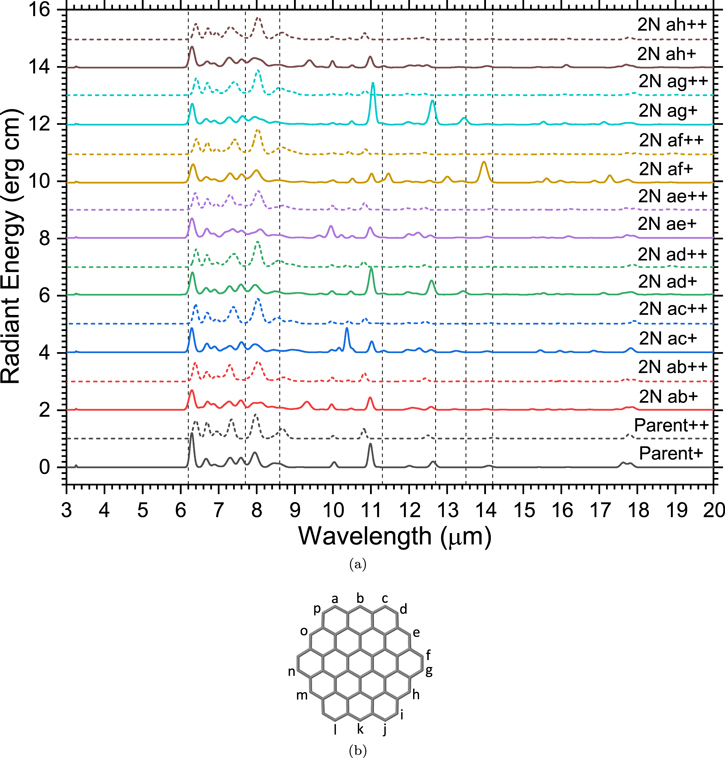
Figure 17. The 3–20 μm emission spectra, computed using the 6–31G* basis set, of the parent PAH cation C54H18 + (black curve) and exo PANH mono and dications containing two nitrogens at positions ranging from ab to ah. The plots of the monocations and dications are shown as solid and dashed lines, respectively. Vertical lines have been added at the nominal PAH band positions, namely 6.2, 7.7, 8.6, 11.3, 12.7, 13.5, and 14.2 μm.
Download figure:
Standard image High-resolution image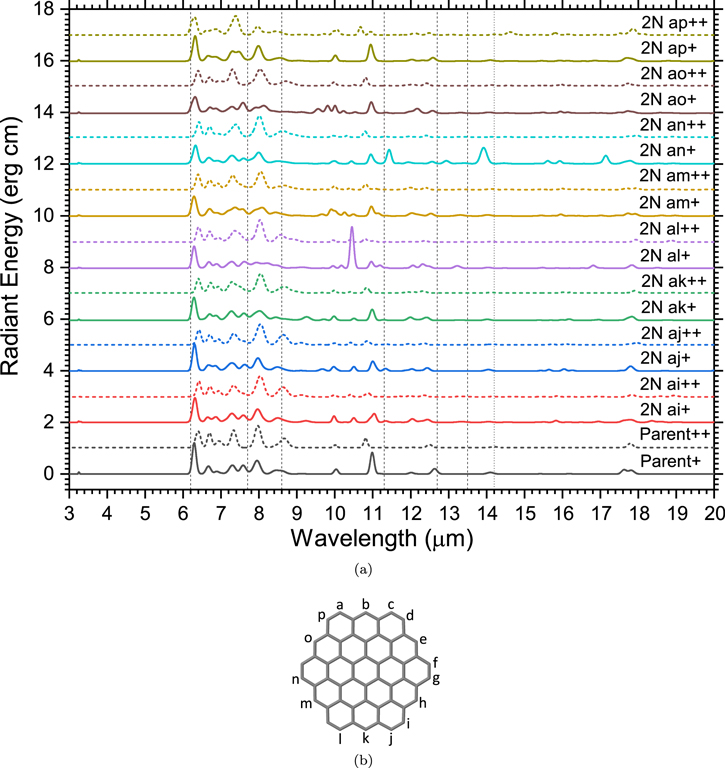
Figure 18. The 3–20 μm emission spectra, computed using the 6–31G* basis set, of the parent PAH cation C54H18 + (black curve) and exo PANH mono and dications containing two nitrogens at positions ranging from ai to ap. The plots of the monocations and dications are shown as solid and dashed lines, respectively. Vertical lines have been added at the nominal PAH band positions: 6.2, 7.7, 8.6, 11.3, 12.7, 13.5, and 14.2 μm.
Download figure:
Standard image High-resolution imageAppendix B: Anharmonic Effects
While the full treatment of anharmonicity on PA(N)H emission spectra is beyond the scope of this paper, the effect of the harmonic approximation was very cursorily explored by calculating full anharmonic absorption spectra for PANHs derived from coronene (C24H12) using the B3LYP functional and the 6–31G* basis set. The geometry optimizations were performed using a very tight convergence criterion to be as close as possible to the exact location of the stationary point. Numerical integrations were performed using a “superfine” 175,974 pruned grid to reduce numerical noise. The numerical derivatives were computed using a four-point differentiation method. Emission spectra were obtained by applying the emission model described in Section 2 to only the resulting zero-Kelvin harmonic transitions. Figure 19 shows the unique nitrogen configurations possible for coronene, which, together with its nonnitrogenated form, were considered in their neutral and singly positive ionized charge states; the results are shown in Figure 20.
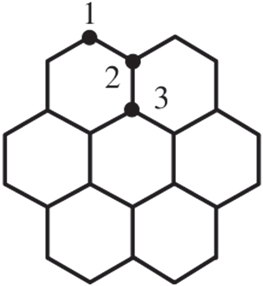
Figure 19. Unique nitrogen configurations for coronene (C24H12).
Download figure:
Standard image High-resolution image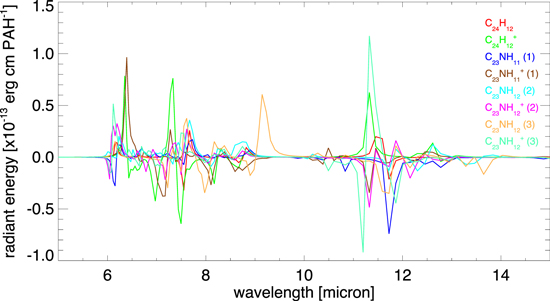
Figure 20. Difference emission spectrum between a PA(N)H’s harmonic and anharmonic counterpart. The nitrogen configurations, indicated in parenthesis, are shown in Figure 19.
Download figure:
Standard image High-resolution imageMany bands exhibit a shift, which presents itself as an intensity flip, e.g., as seen around 11.2 μm for C23NH (3); (see also Mackie et al. 2015, 2016). While in the simple case the shift retains intensity, this is not true for all bands, for example, around 9 μm for C23NH12 (3). In addition, occasionally an otherwise inactive band becomes active or an active band loses all of its intensity. Table 6 provides ratios between harmonic and anharmonic PAH band strengths using the integration limits used in this paper and do not show any systematic trends.
Table 6. Ratios between Harmonic and Anharmonic PA(N)H Band Strengths
| 6.2 | 7.7 | 8.6 | 11.2 | |
|---|---|---|---|---|
| Formula a | Harmonic/Anharmonic | |||
| C24H12 | 2.46 | 0.94 | 0.16 | 1.02 |

| 0.85 | 1.07 | 0.62 | 3.24 |
| C23NH11 (1) | 1.00 | 1.61 | 0.92 | 0.64 |
C23NH (1) (1) | 2.65 | 0.78 | 0.56 | 0.69 |
| C23NH12 (2) | 1.61 | 1.79 | 1.24 | 1.02 |
C23NH (2) (2) | 1.43 | 1.09 | 1.07 | 0.66 |
| C23NH12 (3) | 2.58 | 1.08 | 1.95 | 0.07 |
C23NH (3) (3) | 1.30 | 1.28 | 1.68 | 1.60 |
Note.
a For PA(N)Hs, the position for the nitrogen is given in parentheses; see Figure 19.Download table as: ASCIITypeset image
One needs to be very careful generalizing these results, as computing a proper anharmonic PAH emission spectrum is far more involved than implied here (see, e.g., Mackie et al. 2018). Furthermore, with the inherent redshifts, bands can move out of set integration ranges and, notably for the 6.2 μm band, much emission in the region is ignored by only taking the harmonic bands in our simple approximation. The only thing that can really be concluded from this exercise is that band ratios are likely to be affected by anharmonicity in one way or another.
Appendix C: PANH Band Strength Ratios
Figures 21–24 show some PAH band strength ratios that could be of potential interest to the reader. The figures compare a number of ratios as observed in the northwest PDR of NGC 7023 (orange; Boersma et al. 2013) with those derived from the PA(N)H spectra computed in this paper, at an ionization fraction of 0.5. See also Section 4.2.
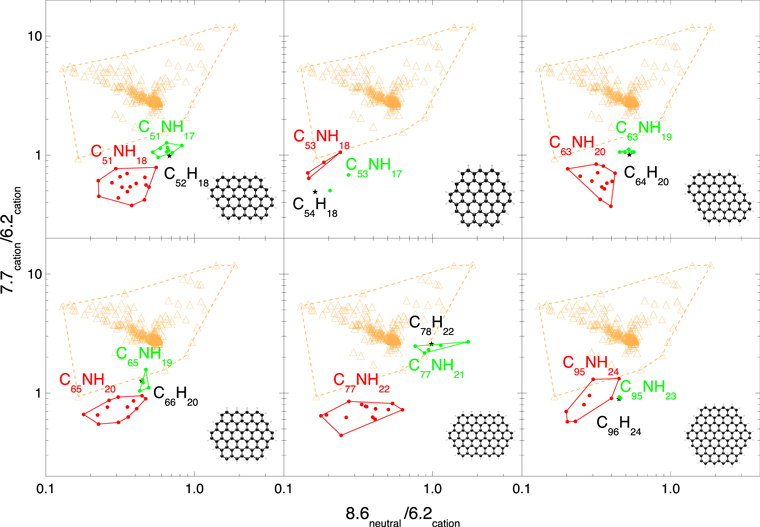
Figure 21. Comparison of the 7.7/6.2 vs. 8.6/6.2 band strength ratios as observed in the northwest PDR of NGC 7023 (orange; Boersma et al. 2013) with the 6.2cation/6.2cation and 8.6cation/11.2neutral ratios for the PA(N)H spectra computed in this paper, separated in panels according to their parent PAH, at an ionization fraction of 0.5. The parent PAH is shown as the black star (⋆), 1-exo PANHs in green, and 1-endo PANHs in red. See also Section 4.2.
Download figure:
Standard image High-resolution image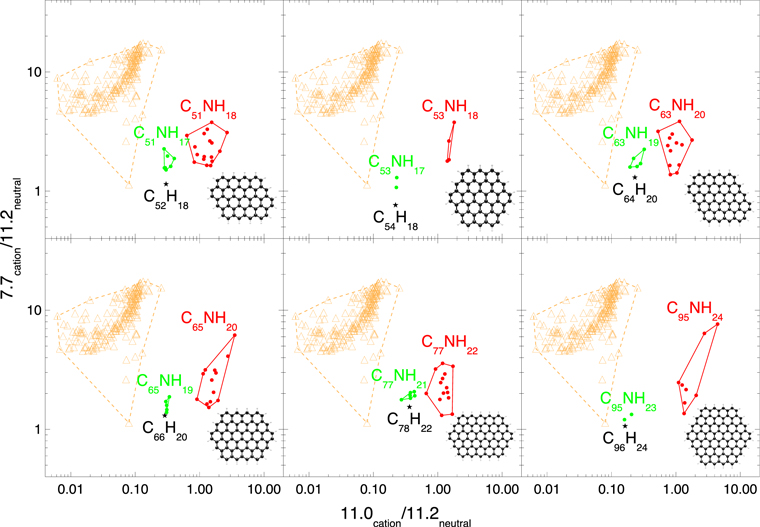
Figure 22. Comparison of the 7.7/11.2 vs. 11.0/11.2 band strength ratios as observed in the northwest PDR of NGC 7023 (orange; Boersma et al. 2013) with the 7.7cation/11.2neutral and 11.0cation/11.2neutral ratios for the PA(N)H spectra computed in this paper, separated in panels according to their parent PAH, at an ionization fraction of 0.5. The parent PAH is shown as the black star (⋆), 1-exo PANHs in green, and 1-endo PANHs in red. See also Section 4.2.
Download figure:
Standard image High-resolution image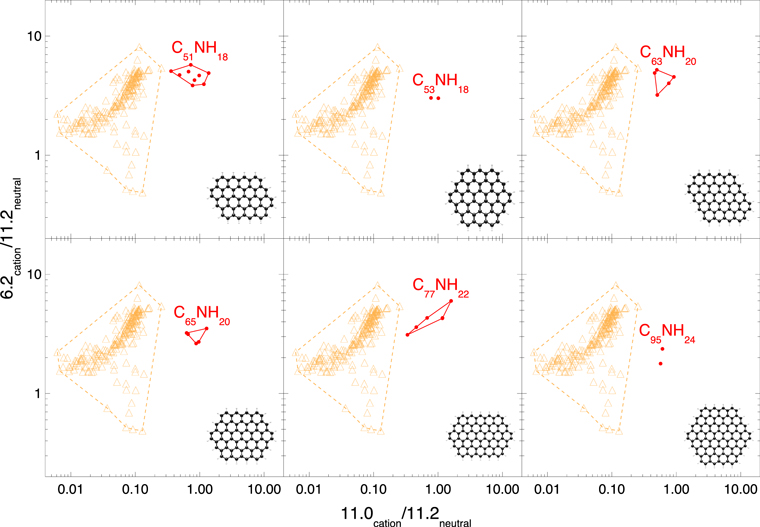
Figure 23. Comparison of the 6.2/11.2 vs. 11.0/11.2 band strength ratios as observed in the northwest PDR of NGC 7023 (orange; Boersma et al. 2013) with the 6.2cation/11.2neutral and 11.0cation/11.2neutral ratios for the hydrogenated (exo) PANH spectra computed in this paper, separated in panels according to their parent PAH, at an ionization fraction of 0.5. See also Section 4.2.
Download figure:
Standard image High-resolution image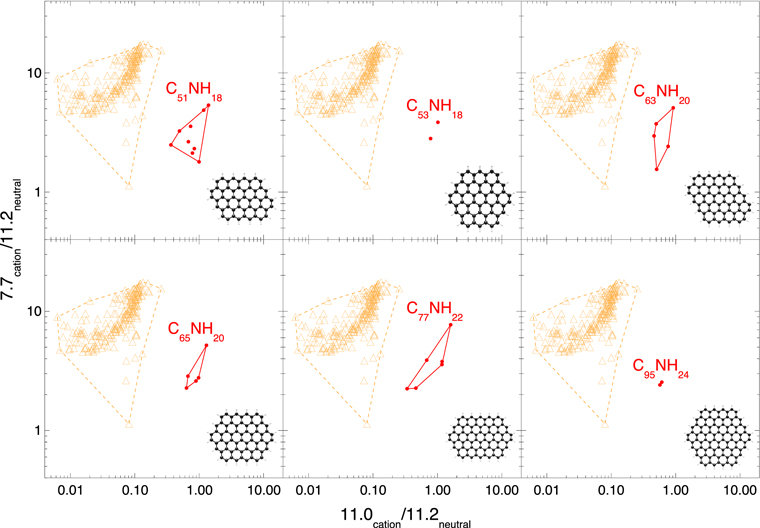
Figure 24. Comparison of the 7.7/11.2 vs. 11.0/11.2 band strength ratios as observed in the northwest PDR of NGC 7023 (orange; Boersma et al. 2013) with the 7.7cation/11.2neutral and 11.0cation/11.2neutral ratios for the hydrogenated (exo) PANH spectra computed in this paper, separated in panels according to their parent PAH, at an ionization fraction of 0.5. See also Section 4.2.
Download figure:
Standard image High-resolution imageAppendix D: Spectroscopic Fitting
The PAH emission model used in the spectroscopic fits follows that from Boersma et al. (2013), with a few adjustments. As in Boersma et al. (2013), Gaussian line profiles are used, but now with a FWHM of 10, 15, and 20 cm−1 for bands falling longward of 15, between 10–15, and short of 10 μm, respectively. These FWHMs better reflect the bandwidth variations observed in astronomical spectra (e.g., Peeters et al. 2002a; van Diedenhoven et al. 2004). Each PAH band position is shifted 15 cm−1 to the red and the cooling cascade is calculated as each PAH has absorbed an 8 eV photon. Figure 25 and Table 7 present the details of PA(N)H species contributing to the spectroscopic fits presented in Section 4.3.
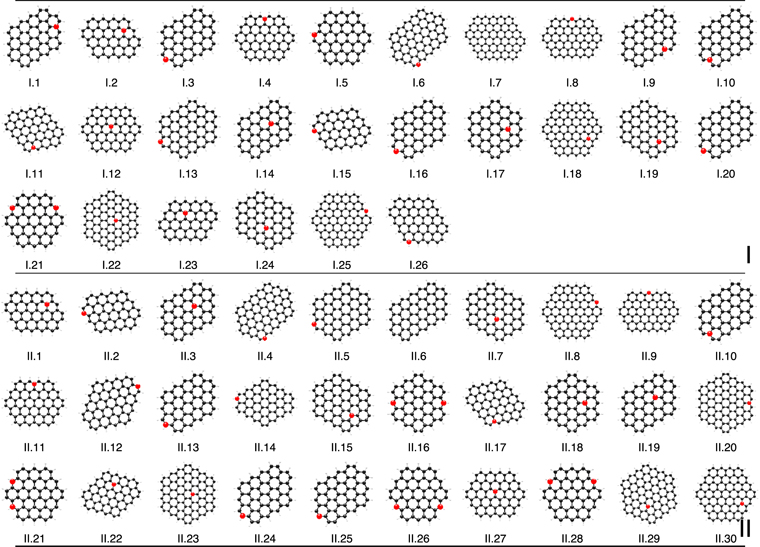
Figure 25. Overview of the PAH structures contributing to the fits of the 5–15 μm Spitzer-IRS spectra shown in Figure 9. The structures are presented in order of their contribution to the fit in terms of flux. Table 7 shows, for each structure, the chemical formula, its contribution to the total number of PA(N)Hs (a), and its contribution to the total flux (f) in percent. See Section 4.3 for details.
Download figure:
Standard image High-resolution imageTable 7. Overview of the PA(N)Hs Contributing to the Fit of the 5–15 μm Spitzer-IRS Spectrum of Positions I and II of the RN NGC 7023 Using the PAH Spectra from This Work
| Position I | Position II | ||||||
|---|---|---|---|---|---|---|---|
| Ref. | Formula | f (%) | a (%) | Ref. | Formula | f (%) | a (%) |
| I.1 | C51NH18 (33) | 11.1 | 11.0 | II.1 = I.2 | C51NH18 (15) | 17.1 | 17.2 |
| I.2 = II.1 | C51NH18 (15) | 9.1 | 9.1 | II.2 = I.15 | C51NH (53) (53) | 14.0 | 13.2 |
| I.3 = II.24 | C51NH (51) (51) | 8.6 | 8.4 | II.3 = I.14 | C51NH (10) (10) | 8.1 | 8.0 |
| I.4 = II.11 | C65NH20 (2c) | 7.5 | 7.4 | II.4 = I.6 | C77NH (1c) (1c) | 7.3 | 7.0 |
| I.5 | C53NH (1) (1) | 7.5 | 7.2 | II.5 = I.13 | C65NH19 (1) | 5.8 | 6.6 |
| I.6 = II.4 | C77NH (1c) (1c) | 7.1 | 6.8 | II.6 |

| 5.5 | 5.2 |
| I.7 | C94H24 | 5.8 | 6.5 | II.7 = I.24 | C65NH (5a) (5a) | 4.8 | 5.2 |
| I.8 = II.9 | C77NH (1e) (1e) | 5.2 | 5.3 | II.8 = I.25 | C95NH23 (1a) | 4.7 | 4.8 |
| I.9 | C51NH18 (6) | 5.2 | 4.9 | II.9 = I.8 | C77NH (1e) (1e) | 4.5 | 4.3 |
| I.10 = II.10 | C51NH18 (34) | 4.2 | 4.1 | II.10 = I.10 | C51NH18 (34) | 3.0 | 3.2 |
| I.11 = II.17 | C63NH20 (6) | 4.0 | 4.1 | II.11 = I.4 | C65NH20 (2c) | 2.9 | 2.9 |
| I.12 = II.27 | C65NH20 (6) | 3.3 | 3.6 | II.12 | C63NH19 (35) | 2.7 | 2.9 |
| I.13 = II.5 | C65NH19 (1) | 3.2 | 3.4 | II.13 = I.20 | C51NH18 (51) | 2.3 | 2.3 |
| I.14 = II.3 | C51NH (10) (10) | 3.0 | 3.1 | II.14 | C63NH20 (35) | 2.2 | 2.2 |
| I.15 = II.2 | C51NH (53) (53) | 2.9 | 2.9 | II.15 = I.19 | C65NH20 (4) | 1.6 | 1.5 |
| I.16 = II.25 | C51NH17 (51) | 2.6 | 2.7 | II.16 | C52N2H18 (24,23) | 1.5 | 1.5 |
| I.17 = II.18 | C53NH (4) (4) | 2.1 | 2.1 | II.17 = I.11 | C63NH20 (6) | 1.5 | 1.5 |
| I.18 = II.30 | C95NH24 (3a) | 1.7 | 1.8 | II.18 = I.17 | C53NH (4) (4) | 1.2 | 1.3 |
| I.19 = II.15 | C65NH20 (4) | 1.2 | 1.1 | II.19 | C51NH18 (10) | 1.1 | 1.2 |
| I.20 = II.13 | C51NH18 (51) | 1.1 | 1.1 | II.20 | C95NH24 (2a) | 1.1 | 1.2 |
| I.21 = II.28 | C52N2H18 (24,67) | 1.1 | 1.0 | II.21 | C52N2H18 (24,68) | 1.1 | 1.1 |
| I.22 = II.23 | C95NH24 (7) | 0.8 | 0.8 | II.22 | C63NH20 (14) | 1.0 | 1.0 |
| I.23 | C51NH18 (1) | 0.8 | 0.8 | II.23 = I.22 | C95NH24 (7) | 1.0 | 1.0 |
| I.24 = II.7 | C65NH (5a) (5a) | 0.5 | 0.5 | II.24 = I.3 | C51NH (51) (51) | 0.9 | 1.0 |
| I.25 = II.8 | C95NH23 (1a) | 0.3 | 0.3 | II.25 = I.16 | C51NH17 (51) | 0.8 | 0.9 |
| I.26 | C63NH20 (8) | 0.1 | 0.1 | II.26 | C52N2H18 (24,67) | 0.6 | 0.6 |
| II.27 = I.12 | C65NH20 (6) | 0.4 | 0.4 | ||||
| II.28 = I.21 | C52N2H18 (24,67) | 0.4 | 0.3 | ||||
| II.29 | C95NH24 (5) | 0.3 | 0.3 | ||||
| II.30 = I.18 | C95NH24 (3a) | 0.3 | 0.3 | ||||
Note. The PAHs are presented in order of their contribution to the fit in terms of flux. For each PAH the chemical formula (with the location of any nitrogen in parentheses), its contribution to the total number of PAHs (a) and its contribution to the total flux (f) in percent are given. See Section 4.3 for details.
Download table as: ASCIITypeset image
Footnotes
- 4
- 5
- 6