Abstract
The isotopes 60Fe and 26Al originate from massive stars and their supernovae, reflecting ongoing nucleosynthesis in the Galaxy. We studied the gamma-ray emission from these isotopes at characteristic energies 1173, 1332, and 1809 keV with over 15 yr of SPI data, finding a line flux in 60Fe combined lines of  and the Al line flux of
  above the background and continuum emission for the whole sky. Based on the exponential disk grid maps, we characterize the emission extent of 26Al to find scale parameters
  and
and  kpc; however, the 60Fe lines are too weak to spatially constrain the emission. Based on a point-source model test across the Galactic plane, the 60Fe emission would not be consistent with a single strong point source in the Galactic center or somewhere else, providing a hint of a diffuse nature. We carried out comparisons of emission morphology maps using different candidate source tracers for both 26Al and 60Fe emissions and suggest that the 60Fe emission is more likely to be concentrated toward the Galactic plane. We determine the 60Fe/26Al γ-ray flux ratio at 18.4% ± 4.2% when using a parameterized spatial morphology model. Across the range of plausible morphologies, it appears possible that 26Al and 60Fe are distributed differently in the Galaxy. Using the best-fitting maps for each of the elements, we constrain flux ratios in the range 0.2–0.4. We discuss the implications for massive star models and their nucleosynthesis.
1. Introduction
The radioactive isotope 60Fe is produced in suitable astrophysical environments through successive neutron captures on preexisting Fe isotopes such as (stable) 54,56,57,58Fe in a neutron-rich environment. Candidate regions for 60Fe production are the He- and C-burning shells inside massive stars, where neutrons are likely to be released from the 22Ne(α,n) reaction. Production of 60Fe may occur any time during the late evolution of massive stars toward core-collapse supernovae (Woosley & Weaver 1995; Limongi & Chieffi 2003, 2006, 2013; Pignatari et al. 2016; Sukhbold et al. 2016; and references therein). There is also an explosive contribution to the 60Fe yield by the supernova shock running through the carbon and helium shells (Rauscher et al. 2003). Electron-capture supernovae may be the most significant producer of 60Fe in the Galaxy (Wanajo et al. 2013, 2018; Jones et al. 2016, 2019a). There are other possible astrophysical sources of 60Fe. From similar considerations, 60Fe can also be made and released in super-asymptotic giant branch (AGB) stars (Lugaro et al. 2012). Furthermore, high-density Type Ia supernova explosions that include a deflagration phase (Woosley 1997) can produce even larger amounts per event.
Due to its long lifetime (radioactive half-life T1/2 ≃ 2.6 Myr; Rugel et al. 2009; Wallner et al. 2015; Ostdiek et al. 2017), 60Fe survives to be detected in γ-rays after being ejected into the interstellar medium: 60Fe β-decays to 60Co, which decays within 5.3 yr to 60Ni, into an excited state that cascades into its ground state by γ-ray emission at 1173 and 1332 keV. There is a similarly long radioactive lifetime of ∼106 yr for 26Al, and it was the first live radioactive isotope detected in characteristic γ-rays at 1809 keV (Mahoney et al. 1982), thus proving currently ongoing nucleosynthesis in our Galaxy. Mapping the diffuse 26Al γ-ray emission suggested that it follows the overall Galactic massive star population (Diehl et al. 1995; Prantzos & Diehl 1996). If 60Fe and 26Al have similar astrophysical origins, with their similar radioactive lifetimes, the ratio of 60Fe to 26Al γ-ray emissions in the Galaxy would be independent of the true specific distances and locations of the sources and thus important for testing stellar evolution models with their nucleosynthesis and core-collapse supernova endings (Woosley & Heger 2007; Diehl 2013).
The steady-state mass of these radioactive isotopes maintained in the Galaxy through such production counterbalanced by radioactive decay thus converts into a ratio for the γ-ray flux in each of the two lines through

Timmes et al. (1995) carried the massive star yields into an estimate of chemical evolution for 60Fe and 26Al in the Galaxy, predicting a γ-ray flux ratio of 0.16. Various revisions of models presented different ratio values (∼0.5–1; see Rauscher et al. 2002; Limongi & Chieffi 2003, 2006; Prantzos 2004; Woosley & Heger 2007). Different massive star regions, such as Scorpius–Centaurus or Cygnus, may show a different 60Fe/26Al ratio, as the age of such associations dictates the expected fluxes (Voss et al. 2009). The average over the whole Milky Way, on the other hand, is determined by the number of massive stars and their explosions over the characteristic lifetimes of 26Al and 60Fe, respectively, providing an independent measure of the core-collapse supernova rate in the Milky Way and up to what masses stars actually explode.
The yields of these two isotopes depend sensitively on not only the stellar evolution details, such as shell burning and convection, but also the nuclear reaction rates. Tur et al. (2010) found that the production of 60Fe and 26Al is sensitive to the 3α reaction rates during He burning; i.e., the variation of the reaction rate by a factor of 2 will make a factor of nearly 10 change in the 60Fe/26Al ratio. The 60Fe may be destroyed within its source by further neutron captures, 60Fe(n, γ). Since its closest parent, 59Fe, is unstable, the 59Fe(n, γ) production process competes with the 59Fe β-decay to produce an appreciable amount of 60Fe. This reaction pair dominates the nuclear reaction uncertainties in 60Fe production, with 59Fe(n, γ) being difficult to measure in nuclear laboratories due to its long lifetime and E1 and M1 reaction channels (Jones et al. 2019b). Using effective He-burning reaction rates can account for the correlated behavior of nuclear reactions and mitigate the overall nuclear uncertainties in these shell-burning environments (Austin et al. 2017). Astronomical observations of the 60Fe/26Al ratio will help to constrain the nuclear reaction aspects of massive stars, given the experimental difficulties in measuring all reaction channels involved at the astrophysically relevant energies.
Such comparison and interpretation, however, relies on the assumption that 26Al and 60Fe originate from the same sources (see, e.g., Timmes et al. 1995; Limongi & Chieffi 2006, 2013) and have similar diffuse emission distributions originating from nucleosynthesis in massive stars throughout the Galaxy. Therefore, the observational verification of the diffuse nature of 60Fe emission is key to the above interpretation of measurements of an 60Fe/26Al ratio in terms of massive star models.
Several detections of 60Fe-enriched material in various terrestrial as well as lunar samples (Knie et al. 2004; Wallner et al. 2015; Fimiani et al. 2016; Neuhäuser et al. 2019) confirm the evidence for a very nearby source for 60Fe within several Myr. A signal from interstellar 60Fe was first reported from the Na i spectrometer on board the RHESSI spacecraft (2.6σ), which was aimed at solar science (Smith 2004). They also presented a first upper limit of ∼0.4 (1σ) for the flux ratio of 60Fe/26Al γ-ray emissions (Smith 2004). The first solid detection of Galactic 60Fe emission was obtained from International Gamma-Ray Astrophysics Laboratory (INTEGRAL) SPectrometer on INTEGRAL (SPI) measurements detecting 60Fe γ-rays with a significance of 4.9σ after combining the signal from both lines at 1173 and 1332 keV (Wang et al. 2007), constraining the flux ratio of 60Fe/26Al γ-ray emissions to the range of 0.09–0.21 (Wang et al. 2007). Subsequent analysis of 10 yr INTEGRAL/SPI data with a different analysis method similarly suggested a ratio in the range ∼0.08–0.22 (Bouchet et al. 2015).
In this paper, we use more than 15 yr of SPI observations throughout the entire Galaxy and carry out a broadband spectral analysis in the γ-ray range 800–2000 keV. Rather than striving for high spectral resolution and line shape details, this wideband γ-ray study aims at studying both 60Fe and 26Al emission signals at 1173, 1332, and 1809 keV simultaneously, i.e., using identical data and analysis methods, including data selection and background treatments. This paper is structured as follows. In Section 2, we will describe the SPI observations and data analysis steps. Our emission models to describe the 800–2000 keV band are introduced in Section 3. We present our morphological and spectral findings in Section 4. Implications and conclusions are shown in Section 5.
2. Observations and Data Analysis
2.1. SPI Observational Data
The INTEGRAL mission (Winkler et al. 2003) began with its rocket launch on 2002 October 17. The SPI (Vedrenne et al. 2003) is one of INTEGRAL’s two main telescopes. It consists of 19 Ge detectors, which are encompassed in a BGO detector system used in anticoincidence for background suppression. The SPI has a tungsten coded mask in its aperture, which allows imaging with ∼3° resolution within a 16° × 16° fully coded field of view. The Ge detectors record γ-ray events from energies between 20 keV and 8 MeV. The performance of the detectors and the behavior and variations of the instrumental backgrounds have been studied over the mission and confirmed that scientific performance is maintained throughout the mission years (Diehl et al. 2018). The INTEGRAL satellite with its coaligned instruments is pointed at predesignated target regions, with a fixed orientation for intervals of typically ∼2000 s (referred to as pointings).
The basic measurement of SPI consists of event messages per photon triggering the Ge detector camera. We distinguish events that trigger a single Ge detector element only (hereafter single event (SE)) and events that trigger two Ge detector elements nearly simultaneously (hereafter multiple event (ME)). The fast pulse shape discriminator (PSD) electronic unit digitizes the shape of the current pulse and allows suppression of background events, e.g., from localized β-decays within the Ge detectors (Roques et al. 2003) or electronic noise. In this work, we use event data that hit only one detector (i.e., SE event data) and carry the PSD flag for acceptable pulse shape (event type PE).
We apply a selection filter to reject corrupted, invalid, or background-contaminated data. We apply selection windows to “science housekeeping” parameters such as the count rates in several background-monitoring detector rates, proper instrument status codes, and orbit phase. In particular, we use the SPI plastic scintillator anticoincidence counter mounted beneath the coded mask and the rate of saturating events in SPI’s Ge detectors (i.e., events depositing >8 MeV in a single Ge detector, hereafter referred to as GeDSat rates) as background tracers. This selection leads to exclusions of strong solar-flare periods and other times of clearly increased/abnormal backgrounds. Additionally, the regular background increases during and after passages through the Earth’s radiation belts are eliminated by a 0.1–0.9 window on orbital phase. As a final step after these primary selections, we perform a quality-of-fit selection using our best background model only (see Section 2.2) and exclude all further pointings that show deviations beyond 10σ above a fit of this background plus the expected signal contribution per pointing, thus eliminating pointings with abnormal background (note that SPI data are dominated by instrumental background counts, so source counts from diffuse emission such as 60Fe alone cannot significantly deteriorate the fit to a pointing data set). These outliers are mainly due to missing “science housekeeping” parameters that are interpolated later or burst-like events in the field of view, for example, gamma-ray bursts, flares from X-ray binaries, or solar activity.
The resulting data set for our 60Fe and 26Al study encompasses 99,864 instrument pointings across the entire sky, equivalent to a total (deadtime-corrected) exposure time of 213 Ms. This includes data from INTEGRAL orbits 43–1950, or 2003 February to 2018 May. The sensitivity (effective exposure time, effective area) of the SPI observations is further reduced by the successive failure of four of the 19 detectors (2003 December, 2004 July, 2009 February 19, and 2010 May 27). In Figure 1, we show the resulting exposure map from our cleaned data set.
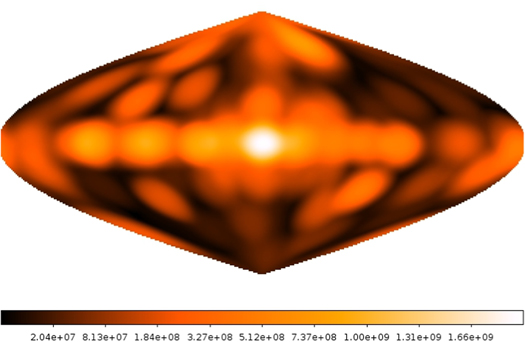
Figure 1. Exposure sky map of the fully coded field of view in Galactic coordinates (the number at the color bar in units of seconds) for the data selected from 15 yr SPI observations for our 60Fe and 26Al study (INTEGRAL orbits 43–1950).
Download figure:
Standard image High-resolution imageWe bin detector events from the range between 800 and 2000 keV into seven energy bins: three of these address γ-ray line bands for 60Fe and 26Al (1169–1176, 1329–1336, and 1805–1813 keV), and four continuum bands in between (800–1169, 1176–1329, 1336–1805, and 1813–2000 keV) are added to robustly determine the line flux above the diffuse γ-ray continuum. In the Appendix, we present an investigation of the impact of event selections using the PSD (see Figure 12). The PSD selections succeed in suppressing apparent electronics noise that is visible in raw detector spectra in the energy range 1300–1700 keV. We therefore use such PSD selections, although the impact on the resulting spectra from celestial sources is not clear except for this continuum band (see Appendix).
2.2. Data Analysis
The raw data of SPI are dominated by the intense background radiation characteristic of platforms undergoing cosmic-ray (CR) bombardment. In SPI data analysis, we combine background models with a spatial model for sky emission to fit our data, allowing for adjustments of fit parameters for background and sky intensities. In general, the counts per energy bin, per detector, and per pointing are fitted by the background model described in Siegert et al. (2019), with details outlined shortly below, and the assumed sky map of celestial emission (e.g., the 26Al distribution obtained by COMPTEL or exponential disk models; see Section 3) as convolved into the domain of the SPI data space for the complete pointing sequence by the instrument coded mask response,

where e, d, and p are indices for the data space dimensions (energy, detector, and pointing); m and n are indices for the sky dimensions (galactic longitude and latitude); A is the instrument response matrix; I is the intensity per pixel on the sky; k1 is the number of independent sky intensity distribution maps; k2 is the number of background components; and δ is the count residue after the fitting. The coefficients βs for the sky map intensity are constant in time, while βb,t is allowed to be time dependent; see Section 2.3 below. The sky brightness amplitudes βs comprise the resultant spectra of the signal from the sky. For this model-fitting analysis, we use a maximum-likelihood method, implementing Poisson statistics that apply to such a detector count analysis. Our software implementation is called spimodfit (Strong et al. 2005). The fitted model components are analyzed for further consistency checks on possible systematics in the residuals.
We thus derive, per energy bin, the best-fit parameter values with uncertainties and their covariance matrices. This provides flux estimates that are independent of spectral-shape expectations.
2.3. 60Fe Background Characteristics
Much of the radiation from the instrumental background is promptly emitted directly from CR impacts. Background components arise from radioactive isotopes produced by the CR impacts. Local radioactivity in the spacecraft and instruments themselves will thus generate both broad continuum background emission and narrow gamma-ray lines from long- and short-lived radio-isotopes. Varying with energy, background components may exhibit complex time variability due to their origins from more than one physical source (Weidenspointner et al. 2003). Background modeling by using the entire mission spectroscopy history has been established recently (Siegert et al. 2019).
For the energy bands studied here, we follow this general approach and model the background by fitting two components, one for the continuum and one for instrumental lines. From the mission spectral database (Diehl et al. 2018), we construct these background models at fine spectral precision. Then, we allow for adjustment of its overall normalization in intensity, which accounts for the fact that the (small) celestial signal that had been part of the mission data used for this database now needs to be separated out. The instrument records several detector triggers that have sufficiently high count rates, such as that of onboard radiation monitors, the SPI anticoincidence shield count rate, and the rate of saturating Ge detector events (events depositing >8 MeV in a Ge detector, GeDSat). These count rates reflect the current CR flux that causes the prompt instrumental γ-ray background, while the long-term trends of radioactive buildup and decays are inherent to the spectral background database. In this analysis, we use the GeDSat rates as a short-term background tracer and first-order description of the background variations with timescales of pointing-to-pointing from 800 to 2000 keV. This tracing is sufficient in energy bins at or below the instrumental resolution; however, in broader energy bins, such as used in this work, the superposition of the effects from different background lines blended together in a broader bin requires rescalings after suitable time intervals.
The coefficients  for background normalizations are therefore allowed time dependent, to cater for such effects and different background normalizations for each camera configuration of 19/18/17/16/15 functional detector elements, as well as for possible variations on timescales shorter than our background model was built.
In Figure 3, we show the optimal renormalization timescale for the 60Fe energy bin including the 1173 keV line. We find an optimum fit when renormalizing the background at a timescale of one orbit, which corresponds to 1674 background parameters per component. As a consistency check, we performed an estimate of the 60Fe signal significance of the 1169–1176 keV band (continuum plus line), as could be expected from earlier measurements (Wang et al. 2007). In this estimation, we consider only the inner Galaxy and assume the COMPTEL 26Al map as a tracer for the morphology of 60Fe emission, and we adopt a total galaxy-wide flux of  . We then make use of the approach by Vianello (2018), who extended the Bayesian significance estimates of Li & Ma (1983), and assume herein that our background model parameters are normally distributed. This obtains the black line shown in Figure 3, estimating a significance of 6σ for our optimal background model rescaling. In case about half of the flux of
  is degenerate and absorbed in the diffuse γ-ray continuum component, the line significance will be around 4σ in our estimate for a single line.
The background rescaling investigations in the remaining energy bins show similar optimum timescales, except for the lowest energy bin (800–1169 keV), which requires four parameters per orbit. The number of degrees of freedom is thus 1,591,831 for 1,595,180 data points in the 60Fe, 26Al, and higher-energy continuum bins, taking into account all fitted parameters for the sky, detector failures, and background variations.
Analyzing the resulting background variations in the 60Fe line bands, we now investigate the candidate origins based on our detailed spectral analysis of the instrumental background with high spectral resolution. The most important background lines are the ones expected from the decay of  in the instrument and satellite at the same line energies because this is the same cascade de-excitation in both cases. This 60Co background builds up in intensity with time due to its 5.3 yr radioactive lifetime and thus will increasingly contribute to the total measured
  γ-ray line signal. In addition, there is a strong background line from activated Ge at 1337 keV, which blends into the high-energy 60Fe line at 1332 keV. This Ge line, however, shows no radioactive buildup, as the decay time is of the order of nanoseconds; hence, the count rate in this line closely follows the general activation of backgrounds. All of these lines are superimposed onto an instrumental continuum background that is dominated by bremsstrahlung inside the satellite and also includes Compton-scattered photons and a composite of weaker lines that escape identification in our deep spectral background analysis (Diehl et al. 2018). In Figures 2–3(c), we show the characteristic background components as they vary with time, as determined from our data set.
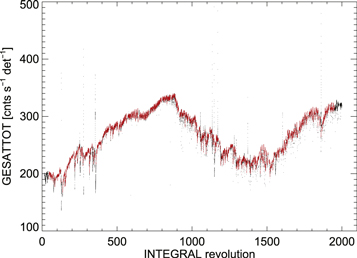
Figure 2. The SPI background tracer variations with time from saturated events in the Ge camera (GeDSat). In the panel, the full SPI database is shown in black, and the chosen data based on our selection criteria are in red.
Download figure:
Standard image High-resolution image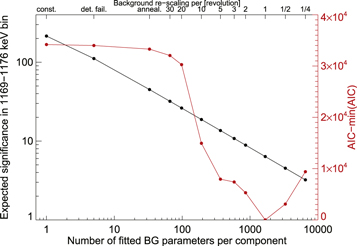
Figure 3. Expected significance (in σ units; black points) above a background-only description of the data in the 1169–1176 keV band, estimated from likelihood tests, background vs. background plus source, using different numbers of background parameters (bottom axis), i.e., varying the background on different timescales (top axis: number of INTEGRAL revolutions; or whenever an annealing was performed, a detector failed; or assuming a constant background). The red points show the AIC ( , where npar is the total number of fitted parameters; right axis), which was used to find the required number of background parameters to describe the data in this bin sufficiently well. The optimum is found at one INTEGRAL orbit or 1674 background fit parameters. The black points show the expected significance in the band with a total flux of 4 × 10⁻⁴ ph cm−2 s−1 as a function of fitted background parameters. See text for details.
Download figure:
Standard image High-resolution image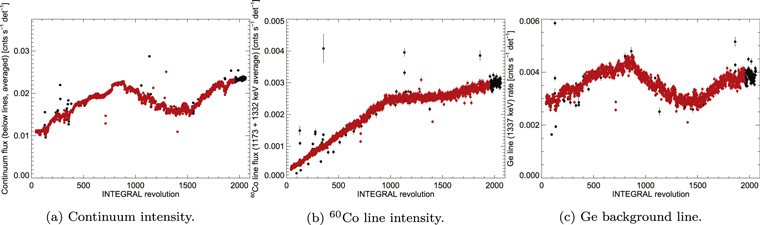
Figure 4. The SPI background continuum and line components relevant in the spectral regime of 60Fe lines: (a) continuum count rate, (b) 60Co activation, and (c) Ge activation line. In each panel, the full SPI database is shown in black, and the chosen data based on our selection criteria are in red.
Download figure:
Standard image High-resolution imageHere we focus on the total galactic emission, so that extrapolated estimates from the inner Galaxy toward the full Galaxy only may serve as guidance, rather than a precise prediction. Nevertheless, we see that the steadily rising  background line flux leads to a very shallow increase in the significance of celestial 60Fe over time, shallower than the 60Fe count accumulation alone would suggest. While our previous result with only 3 yr of data (Wang et al. 2007) showed a 4.9σ signal, in this case, using both 60Fe lines together and both SE and ME (single- and multiple-trigger event types), which is consistent with our expectations, the increase of data by more than 200% in our current data set would result in only 6σ significance for SE and the two lines combined. We now also understand the additional background time variation: because the background line rate increases almost linearly (Figure 4(b)), fitting the background requires more parameters than typical for the SPI background that follows the solar cycle directly.
3. Modeling 60Fe in the Milky Way
The 60Fe signal is too weak to derive the spatial distribution or perform an imaging analysis. Therefore, we attempt to constrain the size of the 60Fe emission region through fitting a parameterized geometrical model: an exponential disk profile (see Equation 3), and we determine the scale radius and scale heights. Doing this for all energy bins between 800 and 2000 keV, we obtain information on how this approach deals with known spatial distributions of γ-ray emission, thus helping to judge systematics limitations with the 60Fe interpretation. The exponential disk models in this analysis have been adopted in the following form:

In Equation (3), ρ(x, y, z) is the 3D emissivity that is integrated along the line of sight (l/b) to produce maps of sky brightness with a pixel size of 1° × 1°. These maps are then folded through the coded mask response to create the expected count ratios for all selected pointings. The normalization A, equivalent to  in Equation (2), is determined (fitted) for a grid of scale radii R0 and scale heights z0 that we test. Here we use a grid of 16 R0 values from 500 to 8000 pc in steps of 500 pc times 32 z0 values between 10 and 460 pc in steps of 30 pc and between 500 and 2000 pc in steps of 100 pc. These models are independently fitted to all seven energy bins to obtain a likelihood chart for all morphologies tested. From this, we can determine both the best-fitting flux and the best scale dimensions of the emission, plus their uncertainties. Doing this in all of our energy bands, we can directly compare the emission size characteristics of 26Al versus 60Fe, obtaining systematics information from the continuum bands in between (i.e., possible biases for scale dimensions, influenced by the continuum below the lines).
All previous searches for 60Fe (Harris et al. 2005; Wang et al. 2007; Bouchet et al. 2015) generally assumed that the 60Fe diffuse emission follows the sky distribution of the 26Al line. In this study, we explore the morphology of 60Fe by comparing with 26Al emission, as well as continuum emission. We test different tracers of potential candidate sources for 60Fe emission and compare those tracer maps to that of 26Al emission as measured and deconvolved from γ-ray data. This provides an independent judgment of how similar 60Fe and 26Al are (Section 4.3) compared to tracers that may include some of the expected deviations from a strict correlation with 26Al. Similar to previous studies (Wang et al. 2009; Siegert 2017), we fit all-sky survey maps from a broad range of different wavelengths to our SPI data. From this, we obtain a qualitative measure that maps are favored at our chosen energies. We test a comprehensive set of maps to trace different emission mechanisms that may be related to our SPI data in the different energy bands. The list of tested maps (Table 1) also includes source tracers that may be weakly or not at all related to the candidate 26Al and 60Fe sources. We use this list of tracers for all of our energy bands in order to reveal degeneracies and systematics, because differences between maps are hard to quantify through fit likelihoods in absolute terms. We also include a background-only fit for reference. In Table 1, we briefly comment on each map to illustrate its main features.
Table 1. The Inventory of Candidate Source Tracers for Which We Compare How They Can Represent Emission in the Seven Energy Bands of SPI Measurements between 800 and 2000 keV
| Energy | Tracer Type and Comments |
|---|---|
| 408 MHz | Synchrotron emission of CR e-; mosaic Jodrell Bank/Effelsberg/Parkes (Haslam et al. 1982; Remazeilles et al. 2015) |
| 21 cm | H i neutral hydrogen, Effelsberg-Bonn H i Survey (EBHIS; Kerp et al. 2011; Winkel et al. 2016) |
| 1.25–4.9 μm | DIRBE infrared emission from starlight of M, K, and G stars, four individual maps (Hauser et al. 1998) |
| 12–240 μm | IRAS infrared emission from dust, six individual maps (Hauser et al. 1998) |
| 380–672 nm | Optical emission, all-sky mosaic from >3000 CCD frames (Mellinger 2009) |
| 656 nm | Hα emission, partly ionized interstellar gas, star-forming regions (Haffner et al. 2016) |
| 1.809 keV | 26Al decay emission from massive star groups, COMPTEL (Plüschke et al. 2001), and SPI (Bouchet et al. 2015) |
| 1–30 MeV | COMPTEL MeV γ-rays, CR–ISM interactions (Schönfelder et al. 1993; Strong et al. 1994) |
| >100 MeV | EGRET 0.1–30 GeV band, CR–ISM interactions (Hartman et al. 1999) |
| 1–3 GeV | Fermi/LAT, CR–ISM interactions, high-energy sources (Atwood et al. 2009) |
| 0.25–1.5 keV | ROSAT all-sky survey, hot ISM, X-ray binaries, three individual maps (Snowden et al. 1997; Voges et al. 1999) |
| 14–150 keV | Swift/BAT hard X-ray sources, X-ray binaries, pointlike, seven individual maps (Krimm et al. 2013) |
| 30–857 GHz | Planck radio bands, nine individual maps, synchrotron emission, individual sources (Planck Collaboration et al. 2016) |
| 30–857 GHz: AME | Anomalous microwave emission (Planck Collaboration et al. 2016) |
| 30–857 GHz: CMB | Cosmic microwave background (Planck Collaboration et al. 2016) |
| 30–857 GHz: CO |
 emission at 150 GHz (Planck Collaboration et al. 2016) emission at 150 GHz (Planck Collaboration et al. 2016) |
| 30–857 GHz: dust | ⋯ (Planck Collaboration et al. 2016) |
| 30–857 GHz: free–free | Bremsstrahlung emission (Planck Collaboration et al. 2016) |
| 30–857 GHz: synchrotron | ⋯ (Planck Collaboration et al. 2016) |
| 30–857 GHz: SZ effect | Sunyaev–Zel’dovich effect (Planck Collaboration et al. 2016) |
| 30–857 GHz: X-lines | Strong non-CO lines in the center of the Galaxy (Planck Collaboration et al. 2016) |
Download table as: ASCIITypeset image
4. Results
From independently fitting spatial emission models to SPI data for each of our seven energy bands, we obtain intensity values for the celestial emission detected in each of these bands for the same adopted spatial distribution model. In Table 2, we present the χ2 values for seven energy bands in the modeling fittings. So, the present fits are reliable, and the background model is acceptable.
Table 2.
The χ2 Values for the Analyzed Set of Seven Energy Bins from 800 to 2000 keV, Together with the Number of Degrees of Freedom and Fitted Parameters Here χ2P refers to Pearson χ2,  is Modified χ2, and
  is Cstat χ2 (see Mighell 1999)
| Energy Bin (keV) | 800–1169 | 1169–1176 | 1176–1329 | 1329–1336 | 1336–1805 | 1805–1813 | 1813–2000 |
|---|---|---|---|---|---|---|---|

|
1,666,345 | 1,578,309 | 1,586,945 | 1574,026, | 1,601,048 | 1,579,418 | 1,583,406 |

|
1,666,705 | 1,577,964 | 1,586,890 | 1,574,878 | 1,600,992 | 1,579,990 | 1,583,382 |

|
1,666,313 | 1,582,827 | 1,587,166 | 1,579,806 | 1,601,146 | 1,589,270 | 1,583,901 |
| dof | 1,591,831 | 1,591,831 | 1,591,831 | 1,591,831 | 1,591,831 | 1,591,831 | 1,591,831 |
| Parameters | 3349 | 3349 | 3349 | 3349 | 3349 | 3349 | 3349 |
Download table as: ASCIITypeset image
For further discussion and analysis, we fit each extracted set of sky intensity values with
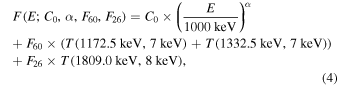
where C0 is the continuum flux density normalization at 1000 keV, α is the power-law index, and F60 and F26 are the integrated fluxes as derived from top-hat functions,  , centered at E0 with bin width ΔE. We link the parameters of the two 60Fe lines, as they are expected to reflect the same incident flux in intensity and width. The lines are expected to be somewhat broadened above the instrumental line widths by 0.1–0.2 keV due to large-scale galactic rotation of sources (Wang et al. 2009; Kretschmer et al. 2013), and the instrumental line width would be ∼2.8 keV around the 60Fe lines and ∼3.2 keV around the 26Al line (Diehl et al. 2018). Within the 7 keV bins for the 60Fe lines and the 8 keV bins for the 26Al lines, 2.9σ (99.7%) of the expected line fluxes would be contained.
4.1. Characterizing the Extents of 60Fe and 26Al Emission
In Figure 5, we show the seven-band spectral intensities as derived from an exponential disk with a scale radius of 7 kpc and scale height of 0.8 kpc as a typical example. We selected this because it reflects the best-fit dimensions in the 26Al line band. In this example, the continuum is determined as (2.4 ± 0.2) × (E/1000 keV)(−1.3±0.2) × 10−5 ph cm−2 s−1 keV−1. The 60Fe and 26Al line fluxes are (2.6 ± 0.6) × 10−4 and (14.4 ± 0.7) × 10−4 ph cm−2 s−1, respectively, which results in an 60Fe/26Al ratio of 18.3% ± 4.4%.
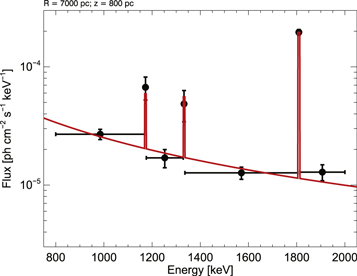
Figure 5. Spectral intensities (black) obtained from the fit to an exponential disk model with  and z0 = 0.8 kpc. The fitted total model, Equation (4), is shown in red.
Download figure:
Standard image High-resolution imageOur 16 × 32 = 512 scale size grid covers the full range of the Galactic plane and therefore provides a measure of the emission extents for 60Fe and 26Al, as well as for the continuum emission expected from bremsstrahlung and inverse Compton interactions of CR electrons. Each of the 512 exponential disk templates is treated individually in the first place, fitting its parameters without any priors or constraints. As a result, the absolute fluxes of the continuum and lines vary with the emission dimensions. We find that with larger-scale dimensions, the fluxes of the continuum and lines increase. We find no strong variation of the line-to-continuum ratio for either 60Fe or 26Al. This supports our assessment that the shape constraints that we derive are consistent and without major bias.
The strong background line at 1337 keV (see Section 2) could affect the 1332 keV 60Fe line result, which we therefore compare to the more isolated 1173 keV line; for our 60Fe spatial results, we prefer to rely on the latter line for this reason, while the 60Fe/26Al flux ratio uses the data constraints from both Fe line bands combined. In our goal of determining the spatial extent of 60Fe emission, for 60Fe and 26Al in the 1173 and 1809 keV lines, we show the likelihood contour regions versus scale heights and scale radii (in Figure 6) next to each other. For the 26Al emission, we can obtain the characteristic scale radius of  kpc and scale height of
  kpc. However, for the 60Fe emission lines, the constraints are very poor due to the weak signals, formally resulting in
  and
and  kpc. We will use the point-source model test to exclude one point-source model in the Galactic center (see Section 4.2).
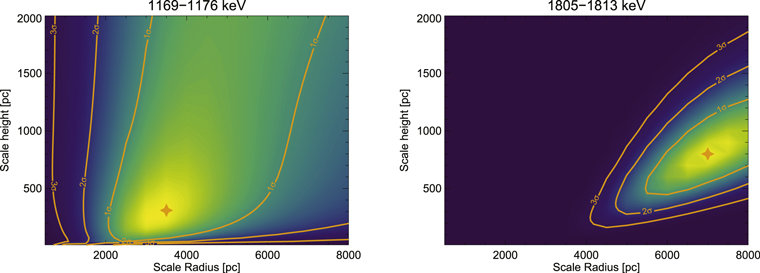
Figure 6. Two-dimensional likelihood profiles for exponential disk fits to SPI data as functions of scale radius and scale height. Shown are the 1σ, 2σ, and 3σ uncertainties, and the best-fit value is marked with a star symbol.
Download figure:
Standard image High-resolution imageIn our goal to exploit maximum information for the 60Fe/26Al flux ratio while catering to the uncertainty of the spatial extent of 60Fe emission, we include the quality of the fits to SPI data from this grid of exponential disk model fits in our assessment. We apply a weighting with the Akaike information criterion (AIC; Akaike 1974) derived from the likelihood and the number of fitted parameters in each energy bin, thus taking the individual measurement and fitting uncertainties of each model map into account. This yields an 60Fe line flux value of (3.1 ± 0.6) × 10−4 ph cm−2 s−1 and an 26Al line flux of (16.8 ± 0.8) × 10−4 ph cm−2 s−1. The 60Fe/26Al ratio resulting from this emission extent–averaged analysis is 18.4% ± 4.2%. The derived 26Al flux for the full Galaxy is also consistent with the previous 26Al map study with SPI data (Bouchet et al. 2015). In addition, a recent SPI analysis reported the 26Al flux values for both the inner Galaxy and the whole sky (Pleintinger et al. 2019): ∼0.29 × 10⁻³ ph cm−2 s−1 for the inner region and ∼(1.7–2.1) × 10−3 ph cm−2 s−1 for the whole sky. We show the 60Fe/26Al ratio distribution from all 512 exponential disk configurations in Figure 7, also indicating characteristic uncertainties.
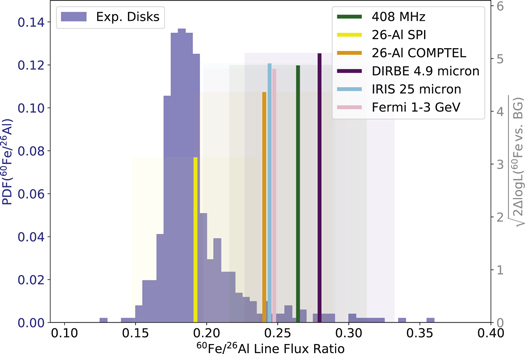
Figure 7. The 60Fe/26Al flux ratio for the grid of exponential disk models (blue; left axis). Including the uncertainties of the fluxes from each spectral fit, the total estimated 60Fe/26Al flux ratio from exponential disks is 18.4% ± 4.2%. Alternative to exponential disks, we also show the flux ratios derived from a set of tracer maps (see Section 4.2) as vertical lines according to their significance (right axis), together with their uncertainties as shaded bands. Clearly, these systematically show larger values compared to the exponential disk models. The IRIS (25 μm) map consistently shows the largest improvement above a background-only description for both lines (see Figure 11), so a flux ratio estimate from this map serves as a measure of the systematic uncertainty. We find a ratio of 0.24 ± 0.4 based on the IRAS 25 μm map, suggesting a systematic uncertainty of the order of 6%.
Download figure:
Standard image High-resolution image4.2. Point-source Model Test for the Galactic Plane
In this section, we aim to constrain the morphology of the weak 60Fe in another way. We produced a catalog of point-source locations with 91 × 21 = 1911 entries between l = −90°–90° and b = −20°–20° in 2° steps. Then we used this catalog to test a point-source origin for both 26Al and 60Fe emission lines in the Galactic plane. In this way, in Figure 8, we can check if and how extended the 26Al and 60Fe emissions are. These morphology studies of 26Al and 60Fe emission distributions suggested that the γ-ray emissions are not attributed to one or several point sources in this region. In positive longitudes, the 26Al emission extended to l ∼ 35°, which may be contributed by Aquila, and at l ∼ 80°, the emission structure is Cygnus. The truncated structure in positive longitudes will partially be the influence of the exposure map (see Figure 1). In the negative longitudes, the 26Al emission extended to l ∼ −75°, probably Carina. However, these maps should not be interpreted as the real sky distribution map but can imply that the emission is not pointlike. The use of this simplified emission model at different galactic coordinates would yield large residuals in the raw SPI data space. Likewise, the 60Fe emission morphology is unknown and could be particularly similar to 26Al.
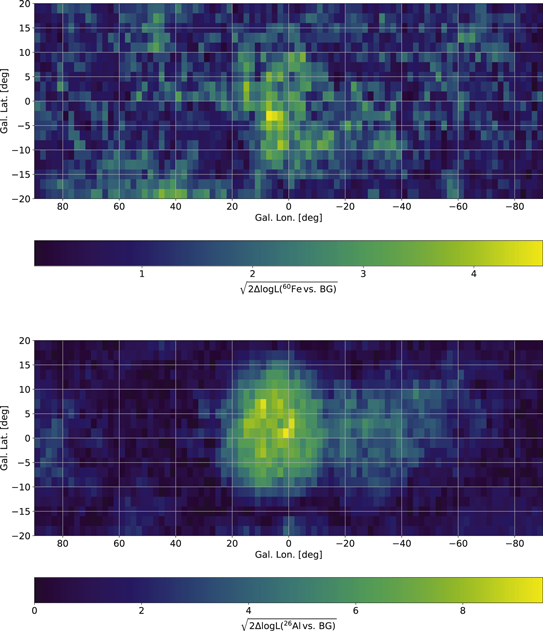
Figure 8. Summary of scanning the inner part of the Galactic plane for both 60Fe (top) and 26Al (bottom) line emissions (−90° < l < 90°, −20° < b < 20°) with individual point sources separated by 2° each. Each pixel in these visualizations represents one complete likelihood ratio test of background only vs. background plus point source; i.e., it includes all fitted parameters of the complete data set with one additional sky component, here modeled as a point source at Galactic coordinates (l/b). Each point is independent from all other points, as they represent another likelihood ratio test and thus may not be interpreted as linked to each other. The particular choice of fitting a single point source at individual positions stems from the fact that, within 3σ uncertainties, the exponential disk model extents (see Figure 7) are indistinguishable from a point source at the Galactic center. Thus, the opposite extreme of having only one or more point sources containing all of the flux is tested with this procedure.
Download figure:
Standard image High-resolution imageFrom these trials, we can estimate the influence of diffuse or pointlike emission by taking into account that a background-only fit would result in test statistics (TS) defined as

with LBG and LPS being the likelihoods of a background-only fit and a background–plus–point source fit, respectively. For finding a point source by chance at a trial position (l/b), TS would be distributed as 0.5χ2 with 3 degrees of freedom (2 position, 1 amplitude), we can compare how much the measured TS distributions deviate. A single point source would have one (or more) high points at high TS at a particular sharply defined TS value. We can see that the 60Fe case is deviating from the background-only case in more than a few points and consistently for TS > 12 (Figure 9). This would be a signature of a diffuse signal for the 60Fe emission. For comparison, the 26Al line case is shown as well. Therefore, we can exclude a single strong point source in the galactic center, as well as somewhere else in this region, as the origin of the detected 60Fe emission.
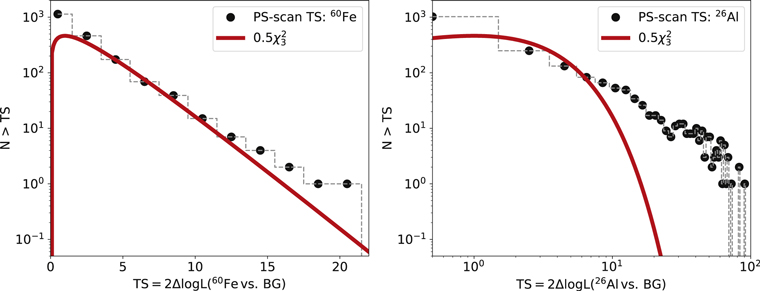
Figure 9. The TS in the 60Fe and 26Al lines, together with expectations from background-only fits, which would be distributed as 0.5χ2 with 3 degrees of freedom. A single point source would have one (or maybe a few) value at high TS. Here 60Fe is deviating from the background-only case in more than a few points and consistently for TS > 12.
Download figure:
Standard image High-resolution image4.3. Investigations of Different Emission Tracers
In our effort to investigate the spatial distribution of 60Fe emission, we fit the SPI data with a large set of maps representing different source tracers (see Table 1). These include the 408 MHz map reflecting CR electrons through their radio emission, CR-illuminated interstellar gas shining in GeV γ-rays, the COMPTEL and SPI maps reflecting 26Al radioactivity, different sets of infrared emission, and X-ray emission maps. The fit quality of these maps can be compared through their different likelihood ratios, where we normalize to a background-only reference (Figure 10). For the 26Al line, as expected, we again find as the best-fitting tracer map the SPI 26Al line map that had been derived from a different data set and analysis method (Bouchet et al. 2015), which supports the consistency of our methods. For the 60Fe line, the best-fitting tracer map turns out to be the DIRBE 4.9 μm map representing emission from small dust grains and starlight from mostly M-, K-, and G-type stars.
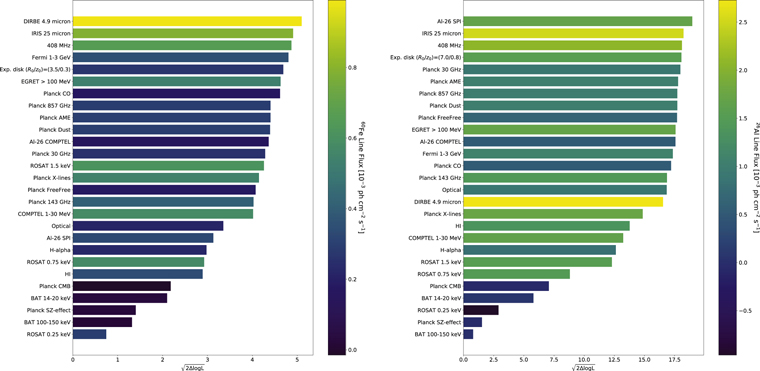
Figure 10. Likelihood ratio results for fits of different tracer maps (including the exponential disk maps) of candidate sources to the 1173 (left) and 1809 (right) keV data for 60Fe and 26Al emissions, respectively. The ratio was derived relative to the background-only fit. The fitted fluxes are given in color. For the 60Fe lines, the best-fit sky distribution model is the DIRBE infrared emission map at 4.9 μm, while for the 26Al line, the best fit is the 26Al emission map derived by INTEGRAL/SPI.
Download figure:
Standard image High-resolution imageFrom our set of candidate source tracers, Table 1, we use the likelihood ratio of the combined continuum bins, the two 60Fe lines, and the 26Al line, each normalized to a background-only fit, as a measure of the significance of a signal from the sky. We illustrate these signal significance levels and the resulting flux values in Figure 10.
For most of the tested maps, such as 408 MHz, IRAS 25 μm, COMPTEL 26Al emission, GeV γ-ray emission, and CO/dust/free–free emission maps, both the 26Al and 60Fe radioactive-line bands show a significant detection of a signal from the sky in our SPI data set, with significance levels of >16σ for the 26Al line and >4σ for the 60Fe lines. In general, for the cases for which we obtain a significant 26Al signal, such as the 408 MHz or COMPTEL 26Al maps, 60Fe also shows a significant signal above the background. Somewhat surprisingly, however, the SPI 26Al map, which fits best at 1809 keV, is particularly poor in detecting sky emission in the 1173 keV line band of 60Fe. This may be an indication that 26Al and 60Fe may indeed have a different emission morphology. In Figure 7, we also presented the 60Fe/26Al ratio ranges derived from these tracer maps with significant detections of both 26Al and 60Fe emission lines. The 26Al all-sky emission maps observed by COMPTEL and SPI gave a ratio range of 0.15–0.24, and the 408 MHz, IRAS 25 μm, and Fermi γ-ray emission maps produced a ratio range of ∼0.2–0.3. The DIRBE 4.9 μm emission map can produce the highest detection significance level for 60Fe lines, which gave an 60Fe/26Al ratio of 0.22–0.32.
For some cases, such as the hard X-ray map from SWIFT/BAT, the soft X-ray (0.25 keV) map from ROSAT, the Planck cosmic microwave background map, and the Sunyaev–Zel’dovich effect map, in both the 26Al and 60Fe bands, we obtain no or at most marginal detections of sky emission. The hard X-ray map (100–150 keV) is dominated by emission of point sources along the Galactic plane, such as X-ray binaries. Therefore, the nondetection of signals in the 26Al and 60Fe bands would be in line with both the 26Al and 60Fe emission having a diffuse nature, rather than a strong contribution from such sources. The Planck Sunyaev–Zel’dovich effect map follows the distribution of clusters of galaxies, which are mainly located at high Galactic latitudes. The ROSAT soft X-ray (0.25 keV) map is also mostly bright at high Galactic latitude regions due to the strong soft X-ray absorption by the Galactic plane. Nondetection of 26Al and 60Fe emission signals with these two tracer maps is therefore consistent with our belief in the origins of 60Fe and 26Al signals in the plane of the Galaxy and its sources.
To compare the acceptable fits for the lines and continuum from the set of tracer maps, we show the sample spectra in our energy bands in Figure 11 from six typical all-sky distribution models, including the diffuse emission maps from observations (408 MHz, 26Al γ-ray emission, infrared emission), analytical formulae (disk models), and point sources based on hard X-ray surveys. This provides an additional check against or insight into possible systematics in our spectral fit results.
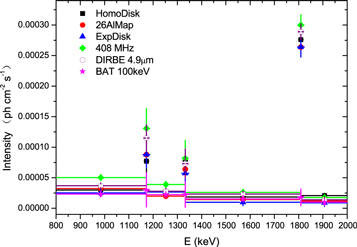
Figure 11. Comparison of the spectra from 800 to 2000 keV for different candidate source tracers in our continuum and line bands. We have included three γ-ray lines using six typical distribution models: a homogeneous disk model (constant brightness along the Galactic plane with scale height 200 pc; see Wang et al. 2009), a COMPTEL maximum entropy 26Al emission map (Plüschke et al. 2001), an exponential disk model (scale radius 3.5 kpc, scale height 300 pc), the 408 MHz map (Remazeilles et al. 2015), the DIRBE infrared emission map at 2.5 μm (Hauser et al. 1998), and a hard X-ray sky map derived by SWIFT/BAT surveys from 100 to 150 keV (bright point sources; Krimm et al. 2013).
Download figure:
Standard image High-resolution image4.4. The Diffuse γ-Ray Continuum
The hard X-ray to soft γ-ray Galactic diffuse emissions include continuum and γ-ray lines such as the positron annihilation line, 60Fe emission lines, and 26Al line. The diffuse continuum emission would originate from several physical processes: inverse Compton scattering of the interstellar radiation field, bremsstrahlung on the interstellar gas from CR electrons and positrons, neutral pion decays produced in interactions of the CRs with the interstellar gas (see Strong et al. 2010 and references therein), and some unresolved hard X-ray/soft γ-ray sources.
With the 7 yr INTEGRAL/SPI observations, Bouchet et al. (2011) derived the hard X-ray spectrum from 20 keV to 2.4 MeV in the Galactic ridge region with a power-law index of Γ ∼ 1.4–1.5 for the diffuse continuum and a flux level of ∼10−5 ph cm−2 s−1 keV−1. Using the 15 yr SPI data covering 800 keV–2 MeV, we also determine the continuum spectra of the whole Galactic plane from the fittings, which have an average flux level of ∼(2.0 ± 0.4) × 10−5 ph cm−2 s−1 keV−1 with a power-law index of Γ ∼ (1.3 ± 0.2). The continuum flux derived in this work is fitted from the whole Galactic plane, rather than only from the inner Galactic ridge (Bouchet et al. 2011). The spectral indices are consistent with each other. We conclude that our broadband analysis also determines the Galactic continuum emission that underlies the targeted line emissions.
5. Summary and Discussion
With more than 15 yr of INTEGRAL/SPI observations, we carried out a wide range of spatial model fits to SPI data from 800 to 2000 keV in seven energy bands, including the line bands for 60Fe at 1773 and 1332 keV and 26Al at 1809 keV, as well as wider continuum energy bands around these. We clearly detected the signals from both 60Fe and 26Al emissions, as well as diffuse Galactic continuum emission. With only the SE database, assuming the exponential disk distribution model, we obtained a detection significance level of 60Fe lines of ∼5.2σ with a combined line flux of (3.1 ± 0.6) × 10−4 ph cm−2 s−1 and an 26Al flux of (16.8 ± 0.7) × 10−4 ph cm−2 s−1 for the whole Galaxy above the background continuum. From the consistent analysis approach with identical data selections, response, and background treatments, we minimize biases or systematics and obtain a result for the 60Fe/26Al flux ratio of 18.4% ± 4.2% based on the exponential disk grid maps. This large-scale galactic value is consistent with a local measurement from deposits of material on Earth (Feige et al. 2018). Since we do not know the real sky distribution of 60Fe in the Galaxy, the derived 60Fe/26Al flux ratio will depend on the sky distribution tracers. In Figure 10, we compare the detection significance levels and flux values for 26Al and 60Fe using different sky distribution tracers. The best fits for 26Al are the the SPI 26Al and IRAS 25 μm maps, while for 60Fe, the best ones are the DIRBE 4.9 μm and IRAS 25 μm maps. Thus, we can use these best-fit maps to constrain the uncertainties of the 60Fe/26Al flux ratio. If we use the same tracer for both 26Al and 60Fe, i.e., the IRAS 25 μm map, the 60Fe/26Al flux ratio is 0.20–0.28; then, using the different tracers, i.e., the SPI map for 26Al and the DIRBE map for 60Fe, one finds a ratio range of 0.30–0.44.
Using an astrophysically unbiased geometrical description of a double-exponential disk, we explore a broad range of emission extents along both Galactic longitude and latitude for 26Al and 60Fe. For 26Al emission, we find  and
and  kpc. The 60Fe γ-ray signal is weak and near the sensitivity limit of current γ-ray telescopes, so imaging similar to what is obtained for 26Al γ-rays cannot be obtained at present. Formally, the scale radius and height are determined to be
  and
and  kpc. We carried out a point-source model scan in the Galactic plane (
 ) for both 26Al and 60Fe emission line cases. The morphology and TS results suggest that the 60Fe emission is not consistent with a strong single point source in the Galactic center or somewhere else in the Galactic plane. From our comparison with different sky maps, we provide the evidence for the diffuse nature of 60Fe concentrated toward the Galactic plane, which is similar to that of 26Al. But it is possible that the 26Al and 60Fe are distributed differently in the Galaxy.
The ratio of 60Fe/26Al has been promoted as a useful test of stellar evolution and nucleosynthesis models, because the actual source numbers and their distances cancel out in such a ratio. A measurement can, therefore, help theoretical predictions and shed light on model uncertainties, which are a result of the complex massive star evolution at late phases and related nuclear reaction rate uncertainties. Timmes et al. (1995) published the first detailed theoretical prediction of this ratio of yields in 60Fe and 26Al, giving a γ-ray flux ratio  . With different stellar wind models and nuclear cross sections for the nucleosynthesis parts of the models, different flux ratios
  were presented (Prantzos 2004). Limongi & Chieffi (2006) combined their yields for the stellar evolution of stars of different mass using a standard stellar mass distribution function to produce an estimate of the overall galactic 60Fe/26Al γ-ray flux ratio around 0.185 ± 0.0625. Woosley & Heger (2007) suggested that a major source of the large discrepancy was the uncertain nuclear cross sections around the creation and destruction reactions for the unstable isotopes 26Al and 60Fe that cannot be adequately measured in the laboratory. A new model of massive stars with the solar composition and the same standard stellar mass distributes from 13 to 120
  compared yields with and without effects of rotation (Limongi & Chieffi 2013). For the models including stellar rotation, they determined a flux ratio of
  . For the nonrotation models, they obtained a flux ratio of
  , and if one only considers the production of stars from 13 to 40
  , the predicted flux ratio reduces to ∼0.11 ± 0.04. For stars more massive than 40
  , the stellar wind and its mass-loss effects on stellar structure and evolution contribute major uncertainty in 60Fe ejecta production. But these stars may not actually explode as supernovae, but rather collapse to black holes, so their contributions may not be effective and could be ignored in a stellar mass–weighted galactic average. The measured values from γ-rays suggest that the (generally) higher values from theoretical predictions may overestimate 60Fe and/or underestimate 26Al production. This could be related to the explodability of massive stars for very massive stars beyond 35 or 40
  .
.
We are grateful to the referee for the fruitful suggestions to improve the manuscript. W.W. is supported by the National Program on Key Research and Development Project (grant No. 2016YFA0400803) and the NSFC (11622326 and U1838103). T.S. is supported by the German Research Society (DFG-Forschungsstipendium SI 2502/1-1). The INTEGRAL/SPI project has been completed under the responsibility and leadership of CNES; we are grateful to ASI, CEA, CNES, DLR (Nos. 50OG 1101 and 1601), ESA, INTA, NASA, and OSTC for support of this ESA space science mission.
Appendix
In Figure 12, we present the spectral examples from 800 to 2000 keV for the seven energy bands for both SE and PSD data sets. In the case of SE, the strong electronic noise cannot be suppressed in the band of 1336–1805 keV, while this electronic noise does not affect the spectral counts for the PSD data set. The reader can also refer to the supplementary information in Siegert et al. (2016), where we have done the test on the pulse shape selections. Thus, in this work, we only refer to the PSD data set.
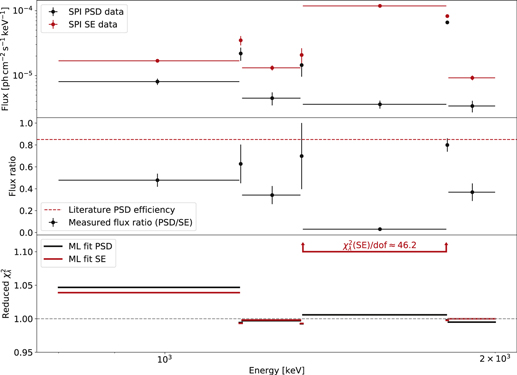
Figure 12. Comparison between the fitted broad spectra derived by the SE and PSD data sets from 800 to 2000 keV. In the band of 1336–1805 keV, the strong electronic noise cannot be suppressed in the case of SE.
Download figure:
Standard image High-resolution imageIn the present work, we have tried to constrain the sky distributions of 60Fe and 26Al lines in the Galaxy, so we determine the γ-ray spectra of three γ-ray lines (1173, 1332, and 1809 keV) for the entire sky. In the previous work (Wang et al. 2007, 2009), we studied the spectra and fluxes of 60Fe and 26Al using only the maps covering the inner Galaxy (−30° < l < 30°, −10° < b < 10°). In this appendix (see Figure 13), we also show the spectral fitting of the broad spectrum with the same map as in Wang et al. (2007, 2009) for comparison. For the inner Galaxy region, the 26Al flux is determined to be (2.60 ± 0.13) × 10−4 ph cm−2 s−1, and the combined 60Fe flux value is (4.5 ± 0.8) × 10−5 ph cm−2 s−1. These flux value levels are consistent with the previous work (Diehl et al. 2006; Wang et al. 2007, 2009; Bouchet et al. 2015). Based on the used COMPTEL 26Al map in the inner Galaxy, the 60Fe/26Al flux ratio is 0.17 ± 0.03, consistent with the estimates from the full Galaxy, with smaller uncertainties because of the larger average exposure and increased signal-to-noise ratio when more flux is actually expected in the analyzed region. Of course, for the inner Galaxy, the diffuse γ-ray continuum has a mean flux of (4.3 ± 0.6) × 10−6 ph cm−2 s−1 keV−1 at 1 MeV with a spectral index of 1.7 ± 0.3.
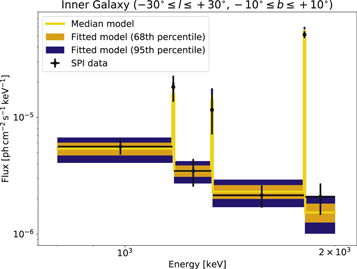
Figure 13. Fitted broad spectrum derived from the COMPTEL 26Al map only for the inner Galaxy −30° < l < 30°, −10° < b < 10°. From this fitting, we derive the combined 60Fe flux of (4.5 ± 0.8) × 10−5 ph cm−2 s−1 and the 26Al flux of (2.60 ± 0.13) × 10−4 ph cm−2 s−1. These values are consistent with the results in our previous work (Diehl et al. 2006; Wang et al. 2007, 2009).
Download figure:
Standard image High-resolution image