Abstract
We present the results of the Cosmic Origins Spectrograph-Intragroup Medium (COS-IGrM) Survey that used the COS on the Hubble Space Telescope to observe a sample of 18 UV bright quasars, each probing the IGrM of a galaxy group. We detect Lyα, C ii, N v, Si ii, Si iii, and O vi in multiple sightlines. The highest ionization species detected in our data is O vi, which was detected in eight out of 18 quasar sightlines. The wide range of ionization states observed provide evidence that the IGrM is patchy and multiphase. We find that the O vi detections generally align with radiatively cooling gas between 105.8 and 106 K. The lack of O vi detections in 10 of the 18 groups illustrates that O vi may not be the ideal tracer of the volume filling component of the IGrM. Instead, it either exists at trace levels in a hot IGrM or is generated in the boundary between the hotter IGrM and cooler gas.
1. Introduction
The majority of galaxies in the universe exist in groups, where the dark matter halos cover mass ranges of 1012 ≲ Mhalo ≲ 1014.5 M⊙ (Tully 1987). The diffuse, hot gas gravitationally bound to the group is commonly referred to as the intragroup medium (IGrM) and may constitute a significant entry into the missing baryon problem (Persic & Salucci 1992; Fukugita & Peebles 2006; Spergel et al. 2007). The effect on galaxy evolution of the IGrM and the halos of groups remains uncertain. The gas in galaxy group halos can be characterized through X-rays, the Sunyaev–Zel’dovich (SZ) effect, and through UV absorption lines from background quasars (QSOs).
Early IGrM detections were based on ROSAT observations of high mass, elliptical rich groups (Mulchaey et al. 1996a; Helsdon & Ponman 2000a; Mulchaey 2000). These groups were believed to be more massive than spiral rich groups and hence more luminous in X-rays. From these observations, initial scaling relations (Helsdon & Ponman 2000a) were derived and the mass of the hot gas was determined to be comparable to the stellar mass of the galaxies (Mulchaey et al. 1996a). More recently, Bregman & Lloyd-Davies (2007) studied O vii absorption to distinguish its origin as from the Milky Way’s galactic halo or from the Local Group’s IGrM. In searching for the IGrM, they found that the Milky Way halo models were preferred, but a contribution to the O vii absorption from the IGrM could not be conclusively ruled out.
The thermal SZ effect, where cosmic microwave background photons are scattered as a result of energetic, free electrons, provides an alternative means of observing the diffuse gas bound to dark matter halos. While the SZ effect is typically used to analyze galaxy clusters, recent studies using large stacks have led to detections around galaxy groups and individual galaxies (Greco et al. 2015; Vikram et al. 2017; Bregman et al. 2018; Pratt & Bregman 2020; Tanimura et al. 2020, and references therein). As noted in Le Brun et al. (2015), Tumlinson et al. (2017), and Tanimura et al. (2020), the gas content of galaxy halos down to 1011 M⊙ comes into tension with existing X-ray observations as the self-similar scaling relations appear to fail.
However, Le Brun et al. (2015) proposes that the discrepancy may result from the low resolution of the Plank SZ map and therefore might not be as robust at low radii (r ≲ r500) when compared to X-ray observations. This effect was reproduced using X-ray simulations were convolved with the Plank beam (Le Brun et al. 2015). Cosmological zoom-in simulations by van de Voort et al. (2016) find that hot gas near the virial temperature causes more consistent X-ray luminosity scaling relations for halos with Mhalo ≳ 1013 M⊙, while less massive halos show X-ray luminosities that are more strongly affected by star formation feedback.
Ultraviolet (UV) absorption lines observed in the spectra of background QSOs remain one of the most robust methods to probe gas at intermediate temperatures, where the gas is not hot enough for X-ray emission. QSO absorption lines have shown that a significant amount of baryons lie in the diffuse gas that makes up the intergalactic medium (IGM) (Rauch 1998; Shull et al. 2012). This provides means of probing the composition of the IGrM since the large majority of galaxy groups are lower in mass and do not have the temperature and density necessary for X-ray emission. At the virial temperature of typical galaxy groups, Mulchaey et al. (1996b) predicted the existence of broad, shallow O vi absorption with Lyman series transitions without lower ions such as C iv and N v based upon collisional ionization equilibrium (CIE) models. In this scenario, C iv and N v are present at levels not currently detectable with current instruments such as the Cosmic Origins Spectrograph (COS; Green et al. 2012) on board the Hubble Space Telescope.
With this background, studies by Tripp et al. (2000), Tripp & Savage (2000), and Stocke et al. (2006) used background quasars to search for O vi, but the data were inconclusive in correlating O vi absorption with the IGrM. Stocke et al. (2014) conducted redshift surveys around 14 previously detected broad Lyα and O vi detections, which were indicative of gas above 105 K. They found galaxy groups around these QSO sightlines and concluded with 2σ confidence that these absorbers were due to the group environment and not the nearest galaxy to the sightline. The possibility that the O vi detections were tracing cooler clouds rather than the hot component of the IGrM was still a hypothesis and it lacked any direct observational confirmation. Other O vi studies by Pointon et al. (2017) and Stocke et al. (2017) compared the detections in group environments to the circumgalactic medium (CGM) of isolated galaxies. These studies found that group environments contained O vi absorption that could be modeled with broader components than isolated systems and concluded that O vi was characteristic of the boundary between cooler CGM gas and the hotter IGrM.
Studies by Tripp et al. (2008), Savage et al. (2010, 2012, 2014), and Rosenwasser et al. (2018) detected O vi absorption features that are consistent with multiphase gas at both cooler and hotter temperatures that could be produced by photoionization or collisional ionization, respectively.
However, from these studies, it is difficult to distinguish the origin of O vi as being due to the boundary of multiphase gas in the IGrM or resulting from the CGM of member galaxies. The COS-Halos Survey (Tumlinson et al. 2011, 2013; Peeples et al. 2014; Werk et al. 2014, 2016) analyzed spectra of 44 QSO-galaxy pairs and found O vi in addition to a significant amount of metals in the halos of isolated galaxies. The COS-Halos Survey found a strong correlation of O vi detections in the inner CGM of star-forming galaxies leading to the idea that it may originate from large streams of cooling gas or from the hotter component of the CGM if a temperature gradient is assumed as opposed to a uniform halo at the virial temperature (Werk et al. 2014; McQuinn & Werk 2018).
Heckman et al. (2002) and Bordoloi et al. (2017) (and references therein) show that O vi observed in the IGM, CGM of galaxies, and the Milky Way halo can be explained by radiative cooling models. These models agree with observations and simulations showing complex, multiphase structures at the interfaces between hot and cold gas (Oppenheimer & Davé 2009; Churchill et al. 2012; Pachat et al. 2016; Narayanan et al. 2018; Ahoranta et al. 2020).
Recently, Stocke et al. (2019) carried out a survey of 12 galaxy groups paired with background QSOs to look for O vi associated with galaxy groups. They find that O vi was not uniformly detected within the sample, leading to the idea that CGM-like clouds can escape individual galaxies and can be observed within the group. They do not find evidence that these clouds can easily escape the group, which means that galaxy groups might be closed boxes for galaxy evolution. Lastly, they conclude that the gas traced through O vi is not volume filling and that a hotter component is necessary for a complete baryon census in the group environment.
Here, we present the COS-IGrM survey, designed to probe the IGrM of lower mass groups than those probed by Stocke et al. (2019), where O vi could be a better tracer of the IGrM due to lower virial temperatures. The COS-IGrM sample consists of 18 galaxy groups paired with background UV bright quasars (QSOs) and was selected without bias toward predefined sightlines with O vi detections. This is the largest sample of low redshift (zgp ≤ 0.2) galaxy groups ever probed for O vi associated with the IGrM.
This paper is organized as follows: in Section 2 we describe the COS-IGrM sample, Section 3 details the HST/COS observations along with the data reduction and analysis, Section 4 presents the results of the survey, Section 5 discusses the overall significance of our results and Section 6 presents the conclusions of our survey.
2. Sample
The COS-IGrM sample 6 is composed of 18 galaxy groups 7 each with a background QSO with a GALEX far-ultraviolet (FUV) magnitude brighter than 19. The sample was created by cross referencing the Tago et al. (2010) galaxy group catalog with the catalog of unique GALEX Data Release 5 QSOs (Bianchi et al. 2011). Four additional criteria were implemented to create a robust sample from the Tago et al. (2010) group catalog:
- 1.The groups must have at least three spectroscopically confirmed members;
- 2.The group redshifts must be between 0.075 ≤ zgp ≤ 0.2 for O vi to be within the COS bandpass;
- 3.The QSO redshift, zQSO > zgp + 0.1 to eliminate confusion between absorption features from the group and from the QSO;
- 4.The QSO impact parameter must be less than 1.5 times the group’s virial radius (1.5Rvir).
In order to ensure that the groups in the COS-IGrM sample are physical groups, the Yang et al. (2007) galaxy group catalog was used to look for confirmed groups in the same location and with similar halo mass as provided by the Tago et al. (2010) catalog. This additional check aided in confidently identifying galaxy groups with as little as three spectroscopically confirmed members. The environment of one group in our sample is shown in Figure 1 along with the location of the background QSO. The remaining 17 group environments are listed in the Appendix. Since galaxy groups were identified from Sloan Digital Sky Survey (SDSS) spectroscopic group catalogs, our sample is biased toward groups with luminous galaxies, L ≳ L*.
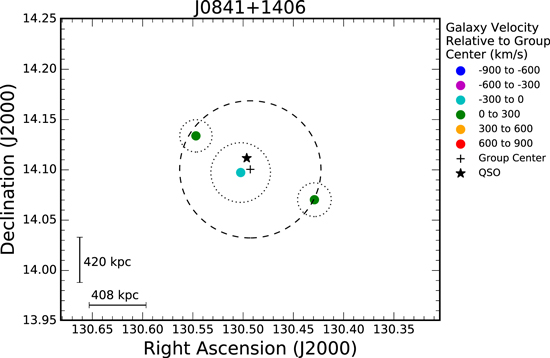
Figure 1. Environment of galaxy group J0841+1406. The color of the points represent the velocity of the member galaxies relative to the center of the group. The thick, dashed line represents the virial radius of the group and the thin, dotted lines represent the virial radii of the member galaxies.
Download figure:
Standard image High-resolution imageWe also include sightlines from Stocke et al. (2019) in our analysis to extend the sample to larger halo masses. In order to make sample parameters consistent with those from Stocke et al. (2019), we redefined the group parameters such as the group halo mass, virial radius, and velocity dispersion through the following relations from their paper:

where Lgp is total the r-band luminosity of the group members calculated via the r-band magnitudes from the Tago et al. (2010) catalog.

and

In Equation (2), the virial radius is defined as the limit where the overdensity of the medium is equal to 200ρcrit as described in Shull et al. (2012) and Stocke et al. (2019). The full properties of our galaxy group sample and each corresponding background QSO are listed in Table 1 along with the adopted values for the halo mass, virial radius, and velocity dispersion.
Table 1. COS-IGrM Sample
| Sightline | Group | R.A.gp | Decl.gp | zgp | R.A.qso | Decl.qso | zqso | Ngp | σTago | Rvir,Tago | ρQSO | log[Mhalo] | Rvir | σgp | R.A.cg | Decl.cg | Subset |
|---|---|---|---|---|---|---|---|---|---|---|---|---|---|---|---|---|---|
| (1) | (2) | (3) | (4) | (5) | (6) | (7) | (8) | (9) | (10) | (11) | (12) | (13) | (14) | (15) | (16) | (17) | (18) |
| 1 | J0841+1406 | 130.493 | 14.100 | 0.1250 | 130.496 | 14.112 | 1.2514 | 3 | 81.3 | 638 | 95 | 13.32 | 567 | 229 | 130.502 | 14.097 | CGM + IGrM |
| 2 | J1017+4702 | 154.246 | 47.049 | 0.1637 | 154.379 | 47.040 | 0.3350 | 3 | 91.9 | 710 | 926 | 13.33 | 573 | 232 | 154.302 | 47.025 | IGrM |
| 3 | J1020+1003 | 155.222 | 10.137 | 0.1229 | 155.235 | 10.059 | 0.6074 | 3 | 223.0 | 466 | 632 | 13.19 | 516 | 209 | 155.200 | 10.092 | IGrM |
| 4 | J1025+4808 | 156.286 | 48.110 | 0.1333 | 156.304 | 48.148 | 0.3317 | 4 | 135.7 | 315 | 340 | 13.31 | 564 | 228 | 156.293 | 48.164 | CGM + IGrM |
| 5 | J1102+0521 | 165.676 | 5.296 | 0.1314 | 165.653 | 5.355 | 0.4987 | 4 | 210.1 | 528 | 536 | 13.23 | 532 | 215 | 165.695 | 5.355 | IGrM |
| 6 | J1126+1204 | 171.691 | 12.122 | 0.1640 | 171.637 | 12.077 | 0.9759 | 5 | 76.0 | 686 | 707 | 13.61 | 709 | 287 | 171.641 | 12.094 | CGM + IGrM |
| 7 | J1127+2654 | 171.875 | 26.900 | 0.1521 | 171.902 | 26.914 | 0.3790 | 3 | 89.6 | 492 | 267 | 13.40 | 606 | 245 | 171.904 | 26.904 | CGM + IGrM |
| 8 | J1216+0712 | 184.140 | 7.148 | 0.1360 | 184.169 | 7.207 | 0.5864 | 3 | 242.7 | 404 | 572 | 13.35 | 579 | 234 | 184.161 | 7.174 | IGrM |
| 9 | J1301+2819 | 195.206 | 28.410 | 0.1439 | 195.254 | 28.329 | 1.3597 | 3 | 141.2 | 613 | 836 | 13.33 | 574 | 232 | 195.243 | 28.361 | IGrM |
| 10 | J1339+5355 | 204.814 | 53.990 | 0.1590 | 204.802 | 53.924 | 0.2933 | 4 | 85.1 | 523 | 653 | 13.43 | 620 | 251 | 204.852 | 53.969 | IGrM |
| 11 | J1343+2538 | 206.031 | 25.700 | 0.0749 | 205.986 | 25.647 | 0.0866 | 3 | 43.0 | 291 | 346 | 12.85 | 396 | 160 | 205.975 | 25.675 | IGrM |
| 12 | J1344+5546 | 206.195 | 55.802 | 0.1546 | 206.198 | 55.782 | 0.9369 | 3 | 177.2 | 570 | 194 | 13.44 | 625 | 253 | 206.210 | 55.795 | CGM + IGrM |
| 13 | J1348+4303 | 207.343 | 43.017 | 0.0947 | 207.228 | 43.053 | 0.2748 | 7 | 207.7 | 574 | 580 | 13.60 | 705 | 285 | 207.276 | 43.047 | IGrM |
| 14 | J1408+5657 | 212.222 | 56.911 | 0.1302 | 212.226 | 56.962 | 0.3363 | 3 | 43.2 | 403 | 427 | 13.46 | 632 | 256 | 212.257 | 56.980 | IGrM |
| 15 | J1424+4214 | 216.247 | 42.261 | 0.0995 | 216.231 | 42.235 | 0.3162 | 3 | 46.3 | 459 | 189 | 13.17 | 506 | 205 | 216.219 | 42.251 | CGM + IGrM |
| 16 | J1426+1955 | 216.465 | 19.914 | 0.1091 | 216.555 | 19.924 | 0.2133 | 3 | 111.1 | 594 | 616 | 12.89 | 407 | 165 | 216.504 | 19.867 | IGrM |
| 17 | J1428+3225 | 217.304 | 32.404 | 0.1308 | 217.246 | 32.419 | 0.6270 | 4 | 123.6 | 777 | 433 | 13.32 | 567 | 229 | 217.320 | 32.431 | IGrM |
| 18 | J1617+0854 | 244.430 | 8.913 | 0.0993 | 244.349 | 8.904 | 0.2064 | 6 | 69.3 | 392 | 533 | 13.36 | 585 | 237 | 244.395 | 8.884 | IGrM |
Note. Columns (10) and (15) are in units of kilometers per second; Columns (11), (12), and (14) are in units of kiloparsec; Column (13) is in units of M⊙. R.A.cg and DECcg are the coordinates of the closest member galaxy to the QSO sightline.
Download table as: ASCIITypeset image
While each sightline probes the IGrM, some also pass through within the CGM of member galaxies. Therefore, we divide our sample into two subsamples—one with sightlines passing through the CGM of member galaxies and the other where the sightline is at impact parameters larger than the viral radius of the member galaxies (assuming an isolated halo). This assumption may overestimate the size of the CGM of group members; however, it remains the most reliable radius estimate without requiring extensive cosmological simulations. The first group contains six sightlines and are referred to as the CGM+IGrM. The remaining 12 sightlines fall in the latter category. In the absence of a deeper spectroscopic survey, our limiting magnitude allows us to claim that the pure IGrM sightlines do not go through the CGM of any ∼L* galaxies. While it is possible that occasionally a much smaller galaxy could be close to the QSO sightline, care was taken to identify any possible galaxy candidates at the same redshift near the QSO sightline. Statistically, we do not find a significant number of possible member galaxies. This was followed up by recent multi-object spectroscopy of two of the fields with the MMT and the Gemini Observatory, which confirmed this result, i.e., very few new galaxies were detected to be part of the groups and none very close to the QSO. These results will be discussed further in a future paper (T. McCabe et al. 2021, in preparation). In Table 1, we refer to the subgrouping for each sightline/group as either IGrM or CGM+IGrM depending on the location of the QSO sightline.
3. HST/COS Observations
The 18 QSOs in our sample were observed with the G130M grating of COS on board the Hubble Space Telescope. Data for 16 of the QSO sightlines were obtained under program 13314, while the remaining were obtained through archival data. The observations were designed to achieved a signal-to-noise ratio (S/N) greater than 10 per resolution element for each sightline. This resolution is necessary in order to observe broad and shallow absorption lines that are expected to be associated with hot media. The spectra covered a observed frame wavelength from 1070–1465 Å corresponding to a rest-frame wavelength range of 946–1295 Å for the median redshift of the sample of z = 0.1311.
The QSO spectra were created by coadding the individual exposures. The spectra were binned by three pixels, corresponding to half the resolution element, to enhance the S/N before any analysis was performed. As the first step, we identified the absorption lines associated with the groups. To do so, absorption lines in the entire spectra were identified. This is critical to ensure that the absorption lines associated with the target system are not blended with intervening or Milky Way absorbers. Special care has been given to the identification of metal-line species, in particular to O vi. Fortunately, the redshift range of our sample resulted in the observed wavelength of O vi shortward of 1215 Å, thus eliminating the possibility of any contamination from weak Lyα absorbers in the IGM.
Continua were fit through an automated pipeline created and described by Tumlinson et al. (2011) and Werk et al. (2012). A few sightlines exhibited complicated continua where the automated system failed, and as a result, those data were reduced individually by the authors following the prescriptions in Sembach & Savage (1992) and Sembach et al. (2004). The continuum fitting was done in a way consistent with the automated system.
Our data covered absorption lines from species such as Lyα λ1215, Lyβ λ1025, C ii λ1036, N v λ, Si ii λ1190 λ1193 λ1260, Si iii λ1206, and O vi λ λ1031 λ λ 1037, which trace gas from 102-6 K. Absorption features were searched within ±800 kms−1 of the group’s systematic redshift. Features beyond this range were not considered to be physically related to the group. Figure 2 shows one example of our COS spectra with Lyα and O vi detections for the group J0814+1406. The rest of the spectra can be found in the complete figure set, which is available in the online journal.
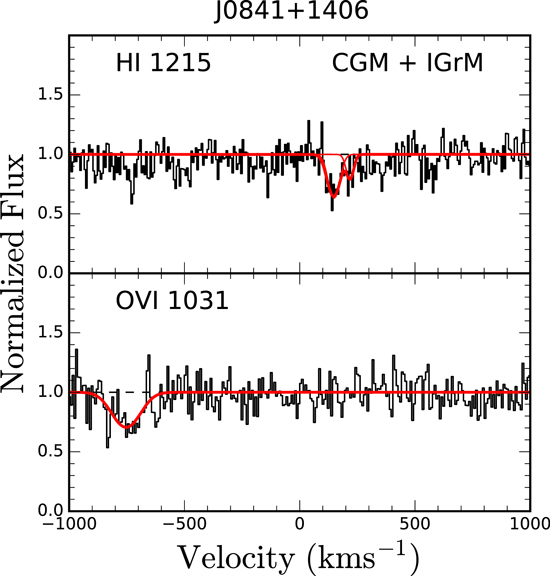
Figure 2.
The observed spectra of sightline J0841+1406 showing H i and O vi detections. The Voigt profile fits are shown in red. The complete figure set (12 images) is available in the online journal. (The complete figure set (12 images) is available.)
Download figure:
Standard image High-resolution imageFeatures with an equivalent width greater than 3σ were considered detections; otherwise, a 3σ upper limit was estimated. The uncertainty corresponding to each equivalent width measurement was determined through the rms noise of the data within the measurement window. Each feature was fit with a Voigt profile in order to determine the column density, Doppler “b” parameter, and velocity centroid. For sightlines with multiple absorption systems, we determined the total column density by linearly adding up the components. Unless stated otherwise, the column density represented in the figures refers to the total column density along the line of sight.
4. Results
We detected Lyα, Lyβ, C ii, N v, Si ii, Si iii, and O vi throughout the 18 sightlines. The detection rate of Lyα is the highest at 67 ± 5% (12/18) followed by O vi at 44 ± 5% (8/18). We also detected low-ionization species such as Si ii and C ii at detection rates of 6 ± 5% (1/18) and 28 ± 5% (5/18), respectively; the intermediate species Si iii at 28 ± 5% (5/18); and high ionization N v at 11 ± 5% (2/18).
Table 2 presents measurements for each of these species for the COS-IGrM sample. 8 In the following subsections, we discuss and analyze the properties and distribution of each species. In our analysis, we also include data from the Stocke et al. (2019) IGrM survey, which covered higher mass groups. This allows us to search for trends over a larger range of halo masses and group sizes. One significant difference to note between the two surveys is that unlike the Stocke et al. sample, we do not eliminate QSO sightlines that fall within 0.25 Rgp in our sample selection.
Table 2. Absorption Line Measurements within ±800 kms−1 of Group Center
| Species | λrest | Wrest | vobs | logN | b |
|---|---|---|---|---|---|
| (Å) | (mÅ) | (kms−1) | (log[cm−2]) | (kms−1)488 | |
| J0841+1406 at zgp=0.125 | |||||
| H i | 1215 | 113.5 ± 20.1 | 148.8 ± 7.3 | 13.33 ± 0.11 |

|
| 218.7 ± 10.1 | 12.80 ± 0.29 |

| |||
| C ii | 1036 | −8.4 ± 17.1 | … | ≤13.63 | … |
| N v | 1238 | 0.7 ± 18.0 | … | ≤13.41 | … |
| Si ii | 1260 | 48.7 ± 18.6 | … | ≤12.53 | … |
| Si iii | 1206 | 38.3 ± 15.3 | … | ≤12.33 | … |
| O vi | 1031 | 107.5 ± 19.9 | −752.9 ± 14.7 | 14.15 ± 0.10 |

|
| J1017+4702 at zgp=0.164 | |||||
| H i | 1215 | 1602.1 ± 29.9 | 340.1 ± 11.8 | 14.73 ± 0.34 |

|
| 499.0 ± 24.3 | 14.89 ± 0.11 |

| |||
| 645.6 ± 6.8 | 14.39 ± 0.29 |

| |||
| C ii | 1036 | 67.5 ± 18.7 | 502.8 ± 5.9 | 13.41 ± 0.21 |

|
| 587.5 ± 4.3 | 13.82 ± 0.10 |

| |||
| N v | 1238 | 6.4 ± 24.0 | … | ≤13.53 | … |
| Si ii | 1260a | … | … | … | … |
| Si ii | 1193 | 12.8 ± 11.7 | … | ≤12.68 | … |
| Si iii | 1206 | 250.5 ± 28.0 | 496.9 ± 5.4 | 12.30 ± 0.20 |

|
| 581.2 ± 3.7 | 13.20 ± 0.06 |

| |||
| O vi | 1031 | 103.1 ± 24.5 | 463.2 ± 30.4 | 13.67 ± 0.26 |

|
| 615.7 ± 23.8 | 13.78 ± 0.19 |

| |||
| J1020+1003 at zgp=0.123 | |||||
| H i | 1215 | 75.8 ± 21.2 | 508.5 ± 3.1 | 13.23 ± 0.12 |

|
| C ii | 1036 | 27.0 ± 56.9 | … | ≤14.15 | … |
| N v | 1238 | 32.8 ± 24.6 | … | ≤13.54 | … |
| Si ii | 1260a | … | … | … | … |
| Si ii | 1193 | −12.6 ± 23.2 | … | ≤12.98 | … |
| Si iii | 1206 | −18.3 ± 21.7 | … | ≤12.48 | … |
| O vi | 1031 | 14.9 ± 56.4 | … | ≤14.13 | … |
| J1025+4808 at zgp=0.133 | |||||
| H ɪ | 1215 | 6.4±11.6 | ≤12.81 | … | … |
| C ii | 1036 | 25.4 ± 14.8 | … | ≤13.57 | … |
| N v | 1238 | 10.0 ± 17.2 | … | ≤13.39 | … |
| Si ii | 1260a | … | … | … | … |
| Si ii | 1193 | 6.5 ± 14.0 | … | ≤12.76 | … |
| Si iii | 1206 | 20.9 ± 11.7 | … | ≤12.21 | … |
| O vi | 1031 | −2.5 ± 15.5 | … | ≤13.57 | … |
| J1102+0521 at zgp=0.131 | |||||
| H i | 1215 | 12.2 ± 16.8 | … | ≤12.97 | … |
| C ii | 1036 | 8.0 ± 13.7 | … | ≤13.53 | … |
| N v | 1238 | 18.2 ± 16.9 | … | ≤13.38 | … |
| Si ii | 1260a | … | … | … | … |
| Si ii | 1193 | 27.3 ± 15.9 | … | ≤12.81 | … |
| Si iii | 1206 | 32.5 ± 16.5 | … | ≤12.36 | … |
| O vi | 1031 | 2.8 ± 17.8 | … | ≤13.63 | … |
| J1126+1204 at zgp=0.164 | |||||
| H i | 1215 | 269.8 ± 21.6 | −70.3 ± 27.6 | 13.72 ± 0.44 |

|
| −35.2 ± 14.3 | 13.54 ± 0.72 |

| |||
| C ii | 1036 | −32.3 ± 17.0 | … | ≤13.63 | … |
| N v | 1238 | 5.2 ± 21.9 | … | ≤13.49 | … |
| Si ii | 1260a | … | … | … | … |
| Si ii | 1193 | −12.6 ± 17.7 | … | ≤12.86 | … |
| Si iii | 1206 | 16.0 ± 18.7 | … | ≤12.42 | … |
| O vi | 1031 | 15.0 ± 15.8 | … | ≤13.58 | … |
| J1127+2654 at zgp=0.152 | |||||
| H i | 1215 | 1385.7 ± 16.0 | −58.9 ± 8.8 | 15.51 ± 0.10 |

|
| 32.1 ± 8.3 | 18.34 ± 0.13 |

| |||
| 115.6 ± 4.1 | 15.26 ± 0.07 |

| |||
| H i | 1025 | 1094.7 ± 16.1 | −58.9 ± 8.8 | 15.51 ± 0.10 |

|
| 32.1 ± 8.3 | 18.34 ± 0.13 |

| |||
| 115.6 ± 4.1 | 15.26 ± 0.07 |

| |||
| C ii | 1036b | ≤506.2 ± 23.7 | −78.4 ± 10.0 | 14.21 ± 0.29 |

|
| −13.2 ± 7.3 | 14.49 ± 0.10 |

| |||
| 73.6 ± 7.5 | 13.92 ± 0.12 |

| |||
| 145.3 ± 5.1 | 13.98 ± 0.10 |

| |||
| N v | 1238 | 2.7 ± 24.4 | … | ≤13.54 | … |
| Si ii | 1260 | 460.0 ± 46.7 | −47.2 ± 8.4 | 13.66 ± 0.07 |

|
| −1.8 ± 1.1 | 13.29 ± 0.10 |

| |||
| 53.0 ± 7.5 | 12.91 ± 0.21 |

| |||
| 122.4 ± 6.6 | 12.90 ± 0.12 |

| |||
| Si ii | 1193 | 324.0 ± 26.9 | −47.2 ± 8.4 | 13.66 ± 0.07 |

|
| −1.8 ± 1.1 | 13.29 ± 0.10 |

| |||
| 53.0 ± 7.5 | 12.91 ± 0.21 |

| |||
| 122.4 ± 6.6 | 12.90 ± 0.12 |

| |||
| Si ii | 1190 | 267.8 ± 27.4 | −47.2 ± 8.4 | 13.66 ± 0.07 |

|
| −1.8 ± 1.1 | 13.29 ± 0.10 |

| |||
| 53.0 ± 7.5 | 12.91 ± 0.21 |

| |||
| 122.4 ± 6.6 | 12.90 ± 0.12 |

| |||
| Si iii | 1206 | 710.9 ± 25.3 | −67.8 ± 8.1 | 13.29 ± 0.09 |

|
| −5.1 ± 3.4 | 13.27 ± 0.12 |

| |||
| 61.4 ± 11.9 | 12.95 ± 0.25 |

| |||
| 130.2 ± 2.3 | 12.80 ± 0.20 |

| |||
| 178.5 ± 53.8 | 12.91 ± 0.36 |

| |||
| O vi | 1031 | 322.9 ± 23.7 | −25.2 ± 5.8 | 14.48 ± 0.04 |

|
| 127.7 ± 8.1 | 13.79 ± 0.12 |

| |||
| O vi | 1037 | 171.3 ± 25.4 | −25.2 ± 5.8 | 14.48 ± 0.04 |

|
| 127.7 ± 8.1 | 13.79 ± 0.12 |

| |||
| J1216+0712 at zgp=0.136 | |||||
| H i | 1215 | 64.9 ± 18.9 | 83.4 ± 4.4 | 13.20 ± 0.14 |

|
| H i | 1215 | 401.8 ± 26.6 | 794.2 ± 2.2 | 14.56 ± 0.06 |

|
| 880.8 ± 10.5 | 12.87 ± 0.31 |

| |||
| H i | 1025 | 131.8 ± 35.3 | 794.2 ± 2.2 | 14.56 ± 0.06 |

|
| 880.8 ± 10.5 | 12.87 ± 0.31 |

| |||
| C ii | 1036 | 26.9 ± 26.1 | … | ≤13.81 | … |
| N v | 1238 | −9.0 ± 27.2 | … | ≤13.59 | … |
| Si ii | 1260a | … | … | … | … |
| Si ii | 1193 | 24.3 ± 24.5 | … | ≤13.00 | … |
| Si iii | 1206 | 6.0 ± 36.8 | … | ≤12.71 | … |
| O vi | 1031 | 132.7 ± 34.7 | 314.1 ± 21.6 | 13.83 ± 0.30 |

|
| 390.0 ± 18.6 | 13.80 ± 0.31 |

| |||
| J1301+2819 at zgp=0.144 | |||||
| H i | 1215 | 563.7 ± 20.2 | −204.8 ± 10.4 | 13.05 ± 0.19 |

|
| −131.4 ± 5.4 | 13.99 ± 0.10 |

| |||
| −68.7 ± 3.14 | 14.53 ± 0.06 |

| |||
| H i | 1025 | 251.2 ± 24.8 | −204.8 ± 10.4 | 13.05 ± 0.19 |

|
| −131.4 ± 5.4 | 13.99 ± 0.10 |

| |||
| −68.7 ± 3.14 | 14.53 ± 0.06 |

| |||
| C ii | 1036 | 23.8 ± 17.2 | … | ≤13.63 | … |
| N v | 1238 | 90.2 ± 18.6 | −135.7 ± 5.6 | 13.10 ± 0.18 |

|
| −85.8 ± 7.0 | 13.16 ± 0.17 |

| |||
| Si ii | 1260 | −8.1 ± 38.8 | … | ≤12.85 | … |
| Si iii | 1206 | 9.9 ± 16.3 | … | ≤12.36 | … |
| O vi | 1031 | 88.0 ± 20.5 | −238.2 ± 10.7 | 13.65 ± 0.19 |

|
| −96.7 ± 15.9 | 14.00 ± 0.12 |

| |||
| J1339+5355 at zgp=0.159 | |||||
| H i | 1215 | 536.9 ± 46.3 | 504.6 ± 26.8 | 13.55 ± 0.33 |

|
| 599.3 ± 7.9 | 14.34 ± 0.12 |

| |||
| C ii | 1036 | −33.0 ± 29.4 | … | ≤13.86 | … |
| N v | 1238 | −10.5 ± 42.6 | … | ≤13.78 | … |
| Si ii | 1260a | … | … | … | … |
| Si ii | 1193 | −6.3 ± 28.6 | … | ≤13.07 | … |
| Si iii | 1206 | 26.3 ± 29.6 | … | ≤12.62 | … |
| O vi | 1031 | 53.2 ± 26.4 | … | ≤13.80 | … |
| J1343+2538 at zgp=0.075 | |||||
| H i | 1215 | 52.2 ± 3.8 | −333.5 ± 1.1 | 13.06 ± 0.03 |

|
| H i | 1215 | 48.9 ± 6.0 | 5.2 ± 4.8 | 12.95 ± 0.05 |

|
| C ii | 1036 | 12.8 ± 8.3 | … | ≤13.31 | … |
| N v | 1238 | 9.0 ± 4.0 | … | ≤12.75 | … |
| Si ii | 1260a | … | … | … | … |
| Si ii | 1193 | −1.7 ± 5.6 | … | ≤12.36 | … |
| Si iii | 1206 | −4.8 ± 5.0 | … | ≤11.84 | … |
| O vi | 1031 | 47.0 ± 12.0 | 33.0 ± 7.5 | 13.60 ± 0.11 |

|
| J1344+5546 at zgp=0.155 | |||||
| H i | 1215 | 74.8 ± 53.6 | … | ≤13.47 | … |
| C ii | 1036 | −1.8 ± 25.3 | … | ≤13.80 | … |
| N v | 1238 | 15.2 ± 25.6 | … | ≤13.56 | … |
| Si ii | 1260a | … | … | … | … |
| Si ii | 1193 | −4.3 ± 43.4 | … | ≤13.25 | … |
| Si iii | 1206 | 73.1 ± 44.9 | … | ≤12.80 | … |
| O vi | 1031 | −5.3 ± 26.7 | … | ≤13.81 | … |
| J1348+4303 at zgp=0.095 | |||||
| H i | 1215 | 678.4 ± 14.4 | −335.0 ± 93.3 | 13.61 ± 0.34 |

|
| −248.0 ± 1.7 | 14.61 ± 0.06 |

| |||
| −12.5 ± 18.6 | 13.49 ± 0.12 |

| |||
| C ii | 1036 | 126.0 ± 26.2 | −336.6 ± 12.1 | 13.39 ± 0.31 |

|
| −259.7 ± 8.6 | 13.80 ± 0.16 |

| |||
| −210.6 ± 3.6 | 13.67 ± 0.91 |

| |||
| N v | 1238 | 11.1 ± 13.4 | … | ≤13.28 | … |
| Si ii | 1260a | … | … | … | … |
| Si ii | 1193 | 13.9 ± 9.7 | … | ≤12.24 | … |
| Si iii | 1206 | 85.7 ± 7.3 | −275.6 ± 1.6 | 12.73 ± 0.04 |

|
| O vi | 1031 | 17.7 ± 21.0 | … | ≤13.70 | … |
| J1408+5657 at zgp=0.130 | |||||
| H i | 1215 | 14.9 ± 12.6 | … | ≤12.84 | … |
| C ii | 1036 | 22.8 ± 18.1 | … | ≤13.65 | … |
| N v | 1238 | 22.1 ± 17.1 | … | ≤13.38 | … |
| Si ii | 1260a | … | … | … | … |
| Si ii | 1193 | −25.9 ± 18.6 | … | ≤12.88 | … |
| Si iii | 1206 | −36.4 ± 21.8 | … | ≤12.48 | … |
| O vi | 1031 | −2.3 ± 19.1 | … | ≤13.66 | … |
| J1424+4214 at zgp=0.100 | |||||
| H i | 1215 | 521.0 ± 9.8 | −65.9 ± 0.9 | 14.39 ± 0.02 |

|
| C ii | 1036 | 66.2 ± 12.2 | −26.6 ± 7.3 | 13.88 ± 0.09 |

|
| N v | 1238 | 40.7 ± 6.9 | −102.0 ± 4.7 | 13.01 ± 0.08 |

|
| Si ii | 1260a | … | … | … | … |
| Si ii | 1193 | 19.0 ± 8.4 | … | ≤12.18 | … |
| Si iii | 1206 | 109.6 ± 8.3 | −106.9 ± 4.4 | 12.03 ± 0.18 |

|
| −50.3 ± 2.9 | 12.76 ± 0.05 |

| |||
| O vi | 1037 | 64.5 ± 12.5 | −91.6 ± 13.7 | 14.25 ± 0.09 |

|
| J1426+1955 at zgp=0.109 | |||||
| H i | 1215 | −4.8 ± 13.6 | … | ≤12.87 | … |
| C ii | 1036 | 0.8 ± 12.6 | … | ≤13.48 | … |
| N v | 1238c | … | … | … | … |
| Si ii | 1260a | … | … | … | … |
| Si ii | 1193 | 31.1 ± 11.7 | … | ≤12.70 | … |
| Si iii | 1206 | 20.9 ± 12.1 | … | ≤12.25 | … |
| O vi | 1031 | −11.1 ± 13.0 | … | ≤13.50 | … |
| J1428+3225 at zgp=0.131 | |||||
| H i | 1215 | 606.8 ± 24.4 | −370.7 ± 18.3 | 13.05 ± 0.27 |

|
| −296.5 ± 1.40 | 14.71 ± 0.05 |

| |||
| −161.8 ± 10.0 | 13.70 ± 0.06 |

| |||
| H i | 1215 | 111.8 ± 16.1 | 392.4 ± 3.9 | 13.38 ± 0.06 |

|
| H i | 1025 | 222.1 ± 21.0 | −370.7 ± 18.3 | 13.05 ± 0.27 |

|
| −296.5 ± 1.40 | 14.71 ± 0.05 |

| |||
| −161.8 ± 10.0 | 13.70 ± 0.06 |

| |||
| C ii | 1036 | 48.8 ± 12.1 | −311.8 ± 16.1 | 13.89 ± 0.11 |

|
| N v | 1238 | −4.3 ± 15.3 | … | ≤13.34 | … |
| Si ii | 1260a | … | … | … | … |
| Si ii | 1193 | 20.7 ± 12.7 | … | ≤12.36 | … |
| Si iii | 1206 | 199.6 ± 17.5 | −290.6 ± 14.0 | 13.03 ± 0.08 |

|
| O vi | 1031 | 45.4 ± 13.4 | −291.9 ± 8.1 | 13.61 ± 0.14 |

|
| J1617+0854 at zgp=0.099 | |||||
| H i | 1215 | 41.7 ± 24.4 | … | ≤13.13 | … |
| C ii | 1036 | −5.2 ± 31.4 | … | ≤13.89 | … |
| N v | 1238 | −9.8 ± 25.0 | … | ≤13.55 | … |
| Si ii | 1260a | … | … | … | … |
| Si ii | 1193 | −31.8 ± 23.7 | … | ≤12.98 | … |
| Si iii | 1206 | −11.8 ± 25.8 | … | ≤12.56 | … |
| O vi | 1031 | 18.6 ± 39.2 | … | ≤13.97 | … |
Note. (a) There is no COS coverage of Si ii 1260 at the observed wavelength. (b) C ii is blended with Milky Way Si ii 1193, which was modeled and removed. Since the Milky Way Si ii line was saturated, the current data do not allow for all C ii absorption to be measured. (c) There is no COS coverage of N v 1238 at the observed wavelength.
Only a portion of this table is shown here to demonstrate its form and content. A machine-readable version of the full table is available.
4.1. H i Lyα Absorption
We detected Lyα absorption features in 12 of our 18 galaxy groups, with four groups having accompanying Lyβ. Figure 3 presents our H i column density measurements as a function of the halo mass of the group. We found that lower mass halos exhibit a slightly narrower range of Lyα column densities compared to higher mass halos. We see no evidence of varying column densities of Lyα absorption between CGM+IGrM and IGrM sightlines. We find that there appears to be two main populations of data points: one with moderate column densities, log[N(H i)] ∼ 14.5–15, and another set clustered around log[N(H i)] ∼ 13. These groupings may indicate that the QSO sightlines are passing through patchy, nonuniform H i clouds as opposed to a continuous distribution with a decreasing density gradient.
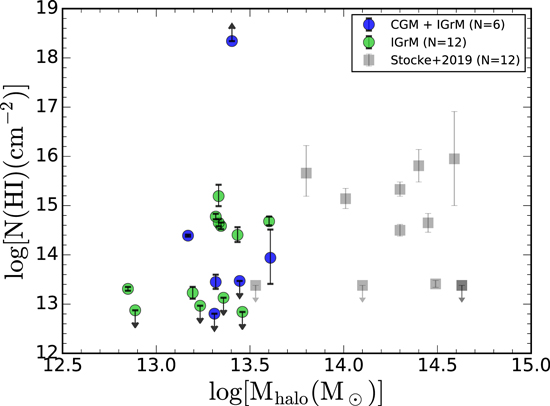
Figure 3. Lyα column density as a function of group halo mass. The COS-IGrM sightlines are shown as filled circles and the data from Stocke et al. (2019) are are gray squares. The COS-IGrM sample is further split into sightlines that are expected to probe the CGM and the IGrM of galaxy groups (blue data points) and those that probe just the IGrM of the group (green data points).
Download figure:
Standard image High-resolution imageOne sightline, J1127+2654 (Figure 2.5), was seen to have saturated Lyα and Lyβ absorption. The column density of this absorption feature should be treated as a lower limit due to the absorption line occupying the flat regime of the curve of growth. This sightline probes the IGrM as well as the CGM of the closest galaxy to the sightline, which is at ∼70 kms−1 from the group’s systematic velocity and an impact parameter of ∼119 kpc. This saturated H i feature is composed of three components centered at −59, 32, and 116 kms−1, respectively from the systemic velocity of the group, with the middle component being the strongest. The low impact parameter of ∼119 kpc from the closest galaxy to the sightline suggests that we are likely probing the CGM of this galaxy. The location of the QSO with respect to the group member in the full environment plot in the Appendix.
Figure 4 shows the distribution of Lyα column density as a function of impact parameter (ρQSO) in the left panel and as a function of normalized impact parameter in the right panel (ρQSO/Rvir). We overplot the Stocke et al. (2019) sample as gray squares in Figure 4. We find no statistically significant correlation between the column density of Lyα absorbers and the QSO impact parameter using the Kendall’s Tau correlation test provided in the Astronomy SURvival Analysis (ASURV) package (Feigelson & Nelson 1985; Isobe et al. 1986; Isobe & Feigelson 1990). Using the ASURV Kendall’s Tau test, we observed no correlation between the column density of Lyα absorption and IGrM or CGM+IGrM sightlines. Most of the stronger Lyα absorbers (log[N(H i)] ∼ 14.5–15) are seen in sightlines that pass through only the IGrM.
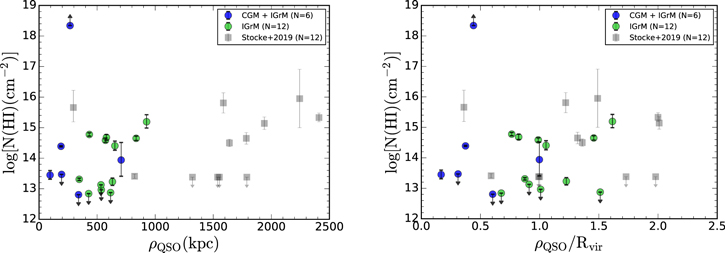
Figure 4. Lyα column densities as a function of projected QSO impact parameter (left) and the QSO impact parameter normalized by the group’s virial radius (right). The colors are the same as for Figure 3.
Download figure:
Standard image High-resolution imageThe origins of cooler, partially neutral gas are not well understood. Possible scenarios include remnants of tidally stripped structures (Davis et al. 1997; Bekki 2009; Borthakur et al. 2010; Nestor et al. 2011; Gauthier 2013; Fossati et al. 2019; Chen et al. 2019; Péroux et al. 2019), in situ condensation (Voit 2019), outflowing material from star-forming galaxies (Veilleux et al. 2005; Tripp et al. 2011; Nielsen et al. 2018; Frye et al. 2019) and/or cold gas accretion from the IGM (Kereš et al. 2005; Vogt et al. 2015; Bielby et al. 2017; Borthakur et al. 2019). These processes are all capable of producing strong Lyα absorption. On the other hand, lower column density absorbers and nondetections are seen in sightlines irrespective of whether they probe the CGM or just the IGrM. The presence of weak Lyα absorbers (≤1014 cm2), including several nondetections, indicates that the sightlines pass through an ionized medium. In those sightlines, we do not find O vi or N v, indicating that the medium must be at temperatures greater than 106 K, assuming collisional ionization equilibrium. This phenomena might be related to the inability for galaxies in groups to continue the gas accretion necessary to fuel star formation. This has been observed in galaxy clusters (Yoon & Putman 2013; Gim et al. 2021), and when scaled to the group environment, could indicate the beginning of the preprocessing and quenching processes (Zabludoff & Mulchaey 1998; McGee et al. 2009; Wetzel et al. 2013; Schawinski et al. 2014; Crossett et al. 2017; Kacprzak et al. 2021).
4.2. Low and Intermediate-ionization Tracing Tracing Cool/Warm Gas
Apart from Lyα, we also observe other transitions like Si ii C ii and Si iii tracing gas up to the ionization potentials of 33.5 eV. C ii and Si iii are the most commonly detected low and intermediate-ionization species that are seen in five of the 18 sightlines. This is consistent with other studies of the CGM and IGM (Collins et al. 2009; Shull et al. 2009; Lehner et al. 2012, 2015; Richter et al. 2016; Borthakur et al. 2016). All of these absorbers are associated with strong, most likely saturated Lyα absorbers.
4.3. O vi and N v Absorption Tracing Highly Ionized Gas
We detect O vi absorbers in eight and N v absorbers in two out of our 18 sightlines. Each N v absorption feature was also present with O vi absorption. Of the eight detections, five of the sightlines were pure IGrM sightlines, while three sightlines were CGM+IGrM. We detected both the transitions of the O vi doublet for two sightlines. Five sightlines showed the stronger of the two transition at O vi λ1031 Å, while one sightline showed absorption at O vi λ1037 Å with an intervening absorption line at the expected position of O vi λ1031 Å. As noted earlier, the redshift range places the O vi doublet at observed wavelengths lower than 1215 Å and hence we do not expect any misidentification of lower redshift Lyα absorbers as O vi. Figure 5 shows the column density of O vi absorbers from the COS-IGrM survey as well the survey by Stocke et al. (2019). Over the entire halo mass range, the O vi and N v detection rates are 44 ± 5% and 11 ± 5%, respectively.
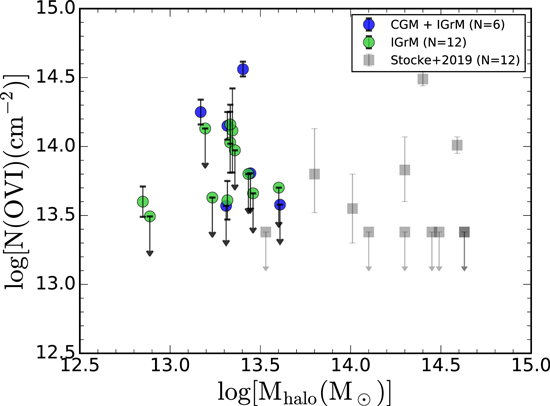
Figure 5. O vi column density detections and 3σ upper limits as a function of group halo mass for the COS-IGrM sample. The blue points indicate QSO sightlines that pass within the virial radius of individual group members, while the green points show sightlines that we expect to only probe IGrM. The gray points are from Stocke et al. (2019), which systematically selects higher mass groups.
Download figure:
Standard image High-resolution imageFigure 6 shows the O vi detections as a function of QSO impact parameter from the center of the group. We observe a flat distribution of detections from 0.1–1.5 Rvir, which suggests that the sightlines may be probing gas that is not at the virial temperature. Since X-ray studies (Helsdon & Ponman 2000b; Mulchaey 2000; Robson & Davé 2020) show temperature gradients in galaxy groups, the observed flat distribution of O vi detections provides evidence that O vi is not tracing the bulk component of the IGrM.
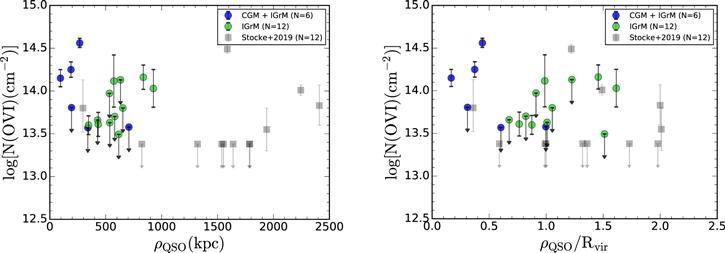
Figure 6. O vi column density detections and 3σ upper limits as a function of projected QSO impact parameter (left) and the QSO impact parameter normalized by the group’s virial radius (right). The colors are the same as in Figure 5.
Download figure:
Standard image High-resolution imageAnother indication that the OVI absorbers in our sample is tracing a mix of hot and cool gas is the fact that while all the systems that show O vi also show Lyα, but the kinematics can be quite different. For example, six of the eight sightlines with O vi detections show Lyα absorption with the same (or slightly offset) velocity centroid, while the remaining two sightlines have Lyα at a much larger (≳200 kms−1). A single ionization process could not produce both Lyα and O vi at the levels detected in some cases. Therefore, for these two different species to be observed within a close velocity offset, multiple clouds must be present, which indicates hot and cool gas in close proximity.
4.4. Absorber Kinematics
In this section, we use the kinematics of the absorbers to explore further the nature and distribution of gas as traced by absorption. First, we use the velocity spread of the absorbers to ascertain if the absorbing gas is bound to the group. Figure 7 (left) shows the absorption lines detected in the COS spectra at velocity relative to the systemic velocity of the group 9 , which is depicted by the dashed line at v − vsys = 0. Each species is color coded with the dominant absorption feature indicated by a larger halo around the data point. In total, there are 70 absorbers depicted in the plot. 29 and 12 of those are Lyα and O vi, respectively, while the remaining represent the other species discussed above. The solid lines show the escape velocity as a function of halo mass and virial radius. The right panel of Figure 7 includes the data from Stocke et al. (2019), which extends the dynamic range of halo masses.
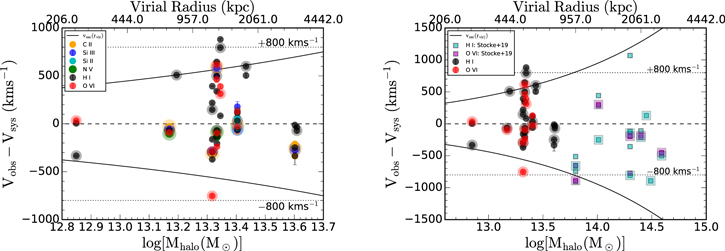
Figure 7. Left: Observed line-of-sight velocity relative to the group center for all detections compared to the halo mass of each group. The solid line represents the escape velocity of the group’s gravitational potential. The absorption features with the largest column density are marked by a lighter halo over the data point to indicate the dominant component of the transition. Right: Same as the left panel, but only for Lyα and O vi including the data from Stocke et al. (2019).
Download figure:
Standard image High-resolution imageThe vast majority of the absorption features are bound to the gravitational potential of the groups. There are nine out of 70 absorbers from five sightlines (J0841+1406, J1017+4702, J1020+1003, J1216+0712, and J1339+5355) that have sufficient velocities, relative to the group, to escape the gravitational potential. These are composed of five Lyα, two O vi, one C ii, and one Si iii absorbers. The same trend is observed with the data from Stocke et al. (2019) as only two absorption features (1 Lyα and 1 O vi) are observed at high enough velocity offsets to escape the group.
Among the 12 O vi absorbers detected in eight sightlines, 83% (10/12) are gravitationally bound to their group halo and only two absorbers show velocities greater than the escape velocity. One of the unbound O vi absorbers is seen in the sightline toward J0841+1406 passes through the CGM of a 4.4 L* galaxy at 145 kpc. The velocity offset between the O vi absorber and this is ∼650 kms−1. Interestingly, the O vi absorber does not have a corresponding Lyα absorber. The Lyα absorber is seen in this group is more than 600 kms−1 offset from the O vi absorption feature and is offset by ∼150 kms−1 to the closest member galaxy. Hence, the O vi absorber could be tracing infalling or outflowing gas. The large Doppler width of the O vi absorber of b = 81.6 kms−1 suggests that this absorber is a tracing material similar to the warm, hot intergalactic medium (WHIM; Cen & Ostriker 1999; Davé et al. 2001). While this Doppler width is consistent with WHIM-like material, we cannot conclusively rule out the possibility that this absorber is not related to the overall gas phase. As stated in Oppenheimer & Davé (2009), and references therein, O vi with these Doppler widths cannot be only a result of thermal broadening, but also requires a kinematic origin. This leaves some uncertainty as to the exact gas phase due to the lack of other metal-line transitions.
The second O vi absorber with a large velocity offset relative to the group is in the sightline toward J1017+4702 (Figure 2.2). The velocity offset of this O vi absorber is sufficient to escape the gravitational potential of the group. This sightline also exhibits a saturated Lyα profile with a column density, logN(HI) > 15.2. Since Lyβ is blended with an intervening absorber, we cannot utilize it to help constrain the column density. Interestingly, in this case, the sightline does not pass within the virial radius of any spectroscopically confirmed L* galaxy and is at 926 kpc ( ≡ 1.6 Rvir) from the group center. However, there is one galaxy with matching photometric redshift at 90 kpc from the sightline, which might be the host of this saturated absorption system. It also has a neighbor with similar photometric redshift at an impact parameter from the QSO sightline of 212 kpc. Future spectroscopic redshift measurements are needed to confirmation the association between this neighboring galaxy and the absorption features present in this sightline. If the photometric redshifts are confined, then these galaxies would most likely be part of the group.
Figure 8 (left) shows a histogram of all of the H i and O vi absorbers as a function of absolute velocity offset from the group center. This histogram quantitatively shows that the majority of both H i and O vi absorbers are gravitationally bound to the group, while ∼10% are observed to have velocities high enough to escape the group potential. These could either indicate infalling clouds or outflows. Therefore, we conclude that the large majority of the absorbers are tracing the cooler, gravitationally bound gas, which is centered well within the group’s escape velocity. A similar conclusion was made by the Stocke et al. (2019) study, which concluded that galaxy groups primarily act as closed boxes for galactic evolution at low redshifts. However, the IGrM should still experience outside-in enrichment from the IGM (Tegmark et al. 1993; Scannapieco et al. 2002; Oppenheimer et al. 2012). While the source of the initial IGM enrichment at early epochs is model dependent, each model of outside-in enrichment predicts that structures can regain metals that were expelled at earlier times.
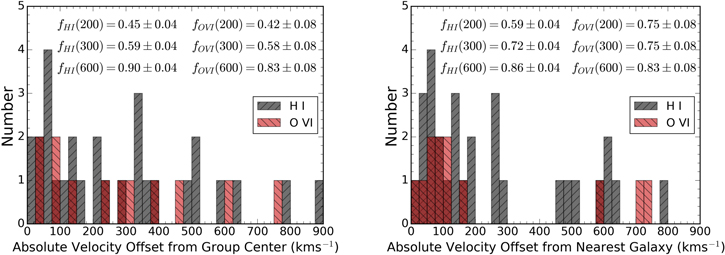
Figure 8. Left: Absolute velocity offset of H i (black) and O vi (red) absorbers from the center the group. The fraction of absorbers within 200, 300, and 600 kms−1 for both ions are displayed for all 29 Lyα and 12 O vi absorbers. Right: Absolute velocity offset of H i (black) and O vi (red) absorbers from the nearest galaxy to the sightline. The fraction of absorbers within 200, 300, and 600 kms−1 for both ions are displayed. For both ions, more than 50% are within 200 kms−1 of the closest galaxy to the sightline, which suggests that some of these absorbers may originate from galactic outflows.
Download figure:
Standard image High-resolution imageWe also investigate the velocity of the absorbers with respect to the nearest, spectroscopically confirmed member galaxy in projection. This is illustrated in the right panel of Figure 8 where H i and O vi absorption features are shown by a histogram as a function of absolute velocity from the nearest galaxy, which could range between 0 and 1600 kms−1. For both H i and O vi absorbers, we see that more than 50% are within 200 kms−1 of the closest galaxy to the QSO sightline. The fraction increases to 70% within 300 kms−1, which is less than the escape velocity of an L* galaxy. This indicates that these absorption features may originate from gas in the CGM of member galaxies in the group. On the other hand, the absorbers at higher velocity offsets are most likely tracing patchy components of the IGrM, or inflows/outflows from individual group members.
4.5. Nature of IGrM
In order to look at the overall ionization state of the IGrM, the ratio of O vi to H i was examined for each of the 18 sightlines in the COS-IGrM sample (Figure 9). For these ratios, only the components of H i found at the same velocity as O vi were used. If there were no O vi or H i detections, then an upper limit was used. Sightlines with no Lyα or O vi absorption were not included in this analysis. The sightlines with O vi column densities greater than the H i columns shows that there is highly ionized gas throughout the IGrM, while the lack of a correlation between the ratio of column densities and impact parameter shows that there is no significant dependence of ionization state on normalized impact parameter.
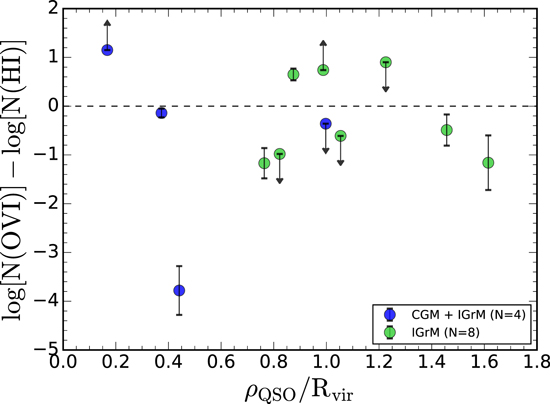
Figure 9. Ratio of O vi to H i column density as a function of normalized impact parameter for each of the 18 sightlines in the COS-IGrM sample.
Download figure:
Standard image High-resolution imageOut of the 12 sightlines that show Lyα absorption, nine of those sightlines show evidence of multiple metal-line species detected in absorption that allows us to model the ionization state of the gas. Of these nine sightlines, seven clearly depict multiphase gas, where various metal-line species are present in varying levels suggesting that the components have very different ionization states. The presence of these multiple components in most of the sightlines indicates that the absorption is associate with pockets of gas that maybe cooler than the rest of the media (and possibly more dense if they are in pressure equilibrium). Therefore, we believe that our data is primarily tracing a complex multiphase media, which cannot be described by a single ionization process. In Table 3, we present the probable ionization process for each group, based upon the observed spectra.
Table 3. Results of Ionization Modeling for Sightlines with Identified Absorption Features
| Group | Ionization Model |
|---|---|
| J0841+1406 | Consistent with CIE at ∼105.4 K or at ∼105.7 K |
| J1017+4702 | C ii/Si iii ratio consistent with photoionization between 10−3 < n(h) < 10−2.5 cm−3; |
| Higher velocity components inconsistent with photoionization | |
| J1020+1003 | Insufficient data for modeling |
| J1126+1204 | Insufficient data for modeling |
| J1127+2654 | Inconsistent with photoionization (1) |
| J1216+0712 | Consistent with CIE at ∼105.2−5.3 K |
| J1301+2819 | Lowest velocity component of Lyα and O vi consistent with CIE at ∼105.3 K or at ∼105.9−6 K; |
| The N v/O vi ratio for the higher velocity components (v ∼ −100 kms−1) is consistent with photoionization | |
| between 10−4 < n(h) < 10−3.5 cm−3. | |
| J1339+5355 | Insufficient data for modeling |
| J1343+2538 | Consistent with CIE at ∼105.3−5.4 K or ∼105.9 K |
| J1348+4303 | Cii/Si iii ratio consistent with photoionization |
| between 10−2.5 < n(h) < 10−2 cm−3 | |
| J1424+4214 | Low velocity component (v ∼ −100 kms−1) inconsistent with photoionization, but is consistent with CIE at ∼105.2−5.3 K; |
| Higher velocity component (v ∼ −55 kms−1) Cii/Si iii ratio consistent with photoionization | |
| between 10−5 < n(h) < 10−4.5 cm−3 or 10−3 < n(h) < 10−2.5 cm−3 (2). | |
| J1428+3225 | Inconsistent with photoionization |
Note. (1) Since individual O vi components may be blended, we cannot definitively rule out photoionization based upon Si iii components. (2) There may be an unresolved, blended component of C ii, which increases the uncertainty in the density required for photoionization to be confirmed.
Download table as: ASCIITypeset image
For ionization modeling, the primary interest was to determine if any of the absorption lines from the COS-IGrM sample are consistent with photoionization, collisional ionization, or inconsistent with either process. For CIE modeling, the ratio of Lyα to O vi absorption at 50% solar was examined over a range of temperatures. If the observed column density ratio was consistent with CIE predictions, then it was noted that the absorption features were consistent with CIE. Since CIE predicts broad, shallow O vi without the presence of lower ionization state transitions, only those sightlines that had Lyα and O vi were examined for consistency with CIE models.
The photoionization modeling was inherently less certain due to unresolved, blended components, and a lack of multiple metal-line species in the majority of sightlines. We used CLOUDY (Ferland et al. 2013) with a Haart–Madau background and a total hydrogen density grid (log[n(h)] from [−5, −2] particles cm−3) in 0.5 dex increments. The total neutral column density was fixed to the observed Lyα column density. If a point in the grid existed where the column density ratio each metal species was consistent within the same density grid point, then we stated that the absorption components were consistent with photoionization.
Some sightlines show absorbers that match the ratios and strengths predicted by CIE (Gnat & Sternberg 2007) for a hot ≈105.5 K medium. For example, the sightline J1343+2538 (Figure 2.9) passing through a group at an impact parameter of 346 kpc ( ≡ 0.9 Rvir), shows broad Lyα (bLy α = 47 kms−1) along with O vi suggestive of hot media (Richter et al. 2006). The ratio of O vi to Lyα column density of 0.65 dex is consistent with temperatures of 105.3−5.4 K or 105.9 K for 0.5−[1 Z/H]⊙ with temperature inverse proportional to the metallicity for the same column density ratio. The choice of this metallicity range is based on measurement from X-ray studies for groups of galaxies that typically find the average metallicities of the X-ray bright IGrM to be 0.4−0.6 [Z/H]⊙ (Helsdon & Ponman 2000b). We do not have strong metallicity constrains for non-X-ray bright groups, so we adopt the metallicities seen in X-ray studies.
Another example of collisional ionized gas are seen in the sightline toward group J1301+2819 (Figure 2.7). In addition to tracing hot gas, this sightline shows a mix of multiple ionization states at slightly different velocities possibly tracing a multiphase medium. The Lyα feature shows three components—two strong components with associated Lyβ and one weak component with log N(HI)=13.05. The strong components are seen in both N v and O vi (the components are blended in O vi), whereas the weakest component is most prominent in O vi. This indicates that the different components trace different ionization states. For the weakest component the ratios of O vi and Lyα are in agreement with collision ionization equilibrium model. The ratio of column densities, logN(OVI) − logN(HI) = 0.60, corresponds to gas at 105.3 or 105.9−6 K at 50% solar metallicity. At lower metallicities, the observed ratio of column densities between O vi and Lyα would indicate a slightly higher temperature.
On the other hand, the stronger components are quite puzzling. If photoionization was responsible for the observed ionization states, there should be other low-ionization transitions detected besides H i such as Si ii, C ii, and Si iii. Despite these transitions not being present at detectable levels in the spectra, the N v to O vi ratio is consistent with photoionization (Table 3). Therefore, we are unable to conclusively state the process behind the observed column densities, it is most likely a mixture of multiple ionization processes.
A similar case of multiphase media is seen in J1424+4214 (Figure 2.11), which shows two distinct ionization states with a velocity separation of about 45 kms−1: a less ionized system at ∼ −55 kms−1 and a highly ionized state at ∼ −100 kms−1. One component is seen in lower ionization transitions like Lyα, C ii, and Si iii, while the second components is seen in higher ionization transitions like N v, O vi, as well as Si iii that show a weak feature suggesting Si iii is not the dominant ionization state of silicon. The ratio of these lines indicate that the two components are at very different ionization states, thus suggesting that the IGrM is multiphase and cannot be described by a single ionization state. While the ionization processes for each of the two components cannot definitively be determined based upon the data at hand, the component centered at ∼−100 kms−1 is consistent with CIE at ∼105.2−5.3 K, while the component at ∼−55 kms−1 is consistent with photoionization based upon the C ii to Si iii line ratio.
Another sightline of interest is toward the group J1127+2654 (Figure 2.5). This sightline exhibits a saturated Lyα profile with column density, logN(HI) > 18.3, which makes it a Lyman-limit system (LLS; Lanzetta et al. 1995, and references therein). The absorber complex shows multiple components commonly associated with extended disk (Lehner et al. 2009), inner CGM (Werk et al. 2014; Armillotta et al. 2017; Fielding et al. 2020), and/or tidal structures (Frye et al. 2019). This QSO passes within ∼119 kpc from a known group member; however, higher resolution spectroscopy and a rotation curve is necessary to confirm the connection between this LLS and the member galaxy. Similarly, due to the blending of O vi components in this QSO spectra, we cannot rule out photoionization as the primary ionization mechanism for these absorption lines.
Lastly, the sightline toward J1017+4702 (Figure 2.2) shows that Lyα is saturated at the same position as C ii, Si iii, and broad, shallow O vi. Photoionization alone cannot produce broad, shallow O vi and CIE does not predict the existence of saturated Lyα and broad O vi at a single temperature. Since this is an IGrM sightline, the broad O vi may be tracing a hotter component; however, the lower transitions show evidence of cooler gas at the same velocity. Photoionization modeling with CLOUDY (Ferland et al. 2013) showed that the lower velocity components of C ii and Si iii are consistent with photoionization, while the higher velocity components are inconsistent with photoionization. Overall, it is clear that the ionization states of these groups are complex and the ionization processes behind the multiphase gas cannot always be explained by either photoionization or CIE. Future studies with better modeling, higher resolution observations, and broader wavelength coverage can help shed insight into these ionization processes.
4.6. Origin of O vi Absorbers
We differentiate between CGM and IGrM absorption in galaxy groups by comparing our O vi detections to those detected in the COS-Halos survey (Tumlinson et al. 2011). The COS-Halos survey discovered that a strong correlation between O vi in the CGM and the star formation rate of galaxies existed. In order to compare the our data with the COS-Halos sample, we determined the galaxy closest to the QSO sightline and then matched the galaxy to the star formation rate from the MPA-JHU DR7 10 galaxy catalog (Brinchmann et al. 2004).
Figure 10 shows our data along with those from the COS-Halos survey. The CGM+IGrM sightlines, shown as deep blue circles, have a clear host galaxy as the sightline passes within the viral radius (assuming an isolated halo) of a member galaxy. The pure IGrM sightlines do not pass through the CGM of the nearest galaxy (shown in green circles). Therefore, they are not applicable for comparison with the COS-Halos sample; nevertheless, we show them on the plot for comparison with the CGM+IGrM subsample. It is worth noting that even the blue points that do probe the CGM pass through the outer CGM (ρ > 110 kpc) and not the inner CGM, like the COS-Halos sample.
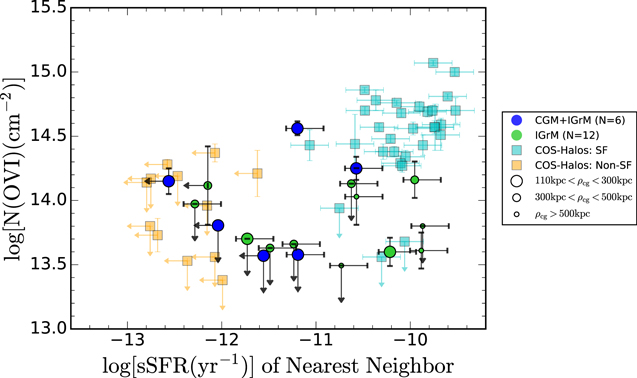
Figure 10. O vi column density as a function of the specific star formation rate of the nearest member galaxy to the QSO sightline. The blue (CGM + IGrM) and green (IGrM) points show the COS-IGrM sample and the size of the points correspond to the impact parameter from the closest, spectroscopically confirmed member galaxy. The cyan and orange data points show the results from the COS-Halos survey (Tumlinson et al. 2011), which robustly observed an increased amount of O vi in the CGM of star-forming galaxies.
Download figure:
Standard image High-resolution imageOverall, we do not see a trend of higher O vi levels as a function of the specific star formation rate (sSFR) or the star formation rate of the nearest galaxy. This is not surprising considering the impact parameters. However, it does suggest that the origin of our O vi absorbers are probably not related to the star formation activity of individual galaxies, and therefore, we are most likely not tracing the CGM gas physics as seen in the COS-Halos survey, but instead, a more group-related phenomena.
While we can confidently rule out the CGM of L⋆ galaxies as the source of O vi absorbers, there could potentially be smaller galaxies that may be present closer to the sightline. A much deeper redshift survey of galaxies in the vicinity of the QSO sightlines would enable us to quantify the presence of low-mass galaxies. Nevertheless, sub-L⋆ galaxies are not expected to have significant metal reservoirs beyond their inner CGM (ρ > 0.5 Rvir) (Bordoloi et al. 2014). Hence, it is not likely that the CGM of sub-L⋆ galaxies could dominate the O vi detected in our sample. On the other hand, material spread out by tidal interactions can have a large cross section on the sky and may survive as faint diffuse partially neutral gas in the IGrM for hundreds of millions of years (Borthakur et al. 2010, 2015).
Our sample shows a larger fraction of green valley galaxies than typically observed in the universe. Jian et al. (2020) finds that on average, 20% of galaxies populate the green valley and the majority of those are field galaxies and not those found in more dense environments. Observing ∼33% of the closest galaxies to the QSO sightline in our sample to be in the green valley reinforces the idea that galaxy group environments may act as important sites where the process of quenching is active (Wetzel et al. 2012, 2013). The role of the IGrM or the CGM in turning these galaxies green is still unclear.
Another possibility for the origin of O vi in the IGrM could be due to active galactic nuclei (AGN) activity. In order to address this, used the emission line ratios from the MPA-JHU 11 DR7 catalog to construct a Baldwin–Phillips–Terlevich (BPT) diagram (Baldwin et al. 1981) so that star-forming galaxies could be separated from AGN using the demarcation as defined by Kauffmann et al. (2003). The locations of the COS-IGrM sample compared to the SDSS DR7 sample from the MPA-JHU catalog are shown in Figure 11 as colored circles. 15 out of the 18 groups in our sample had emission line measurements for the closest galaxy to the QSO sightline and therefore, could be included in the BPT diagram. The color of the circle represents O vi detections (orange) versus nondetections (magenta). The size of the symbol represents the impact parameter of the sightline, where larger sizes indicate small impact parameter. We do not find any systematic overdensity of O vi detection or nondetection in sightlines with or without AGN. Therefore, we conclude that AGN activity is not the primarily contributor of O vi in the IGrM.
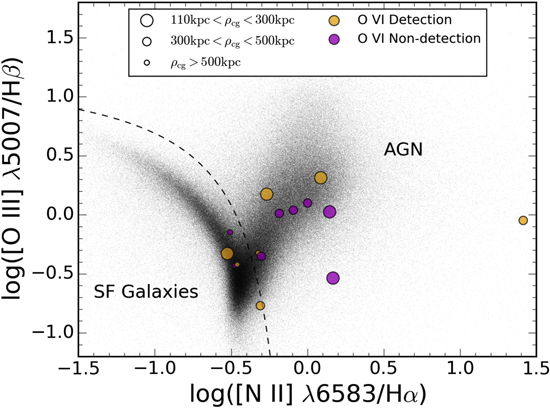
Figure 11. BPT diagram showing the locations of the COS-IGrM sample where reliable flux measurements from the MPA-JHU DR7 catalog were present. The division between phase space pertaining to either star-forming or AGN galaxies is marked by the dashed line (Kauffmann et al. 2003). The colored circles represent sightlines with O vi detections versus nondetections and the size of the circles represents the projected impact parameter to the closest galaxy to the sightline.
Download figure:
Standard image High-resolution image4.7. Stacked Spectra
In order to look for fainter gas associated with the IGrM, we stacked sightlines centered around the group systemic velocity for Lyα and O vi. For each species, stacks were created using all 18 sightlines as well as subsets of CGM + IGrM or IGrM only sightlines. These stacks are shown in Figure 12 along with the number of sightlines going into each subset. The equivalent widths were measured for velocities within ±400 and ±800 kms−1 from the group’s systematic redshift. These values are listed as W800 and W1600 respectively.
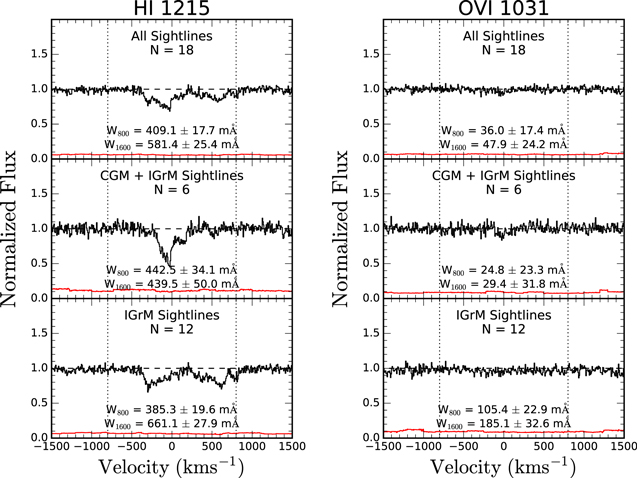
Figure 12. Stacked spectra for Lyα (left) and O vi (right) for each of the 18 sightlines in the COS-IGrM sample (top). The sightlines were also divided into the IGrM and CGM sightlines and stacks of each were created (middle and bottom, respectively). The stacks are centered on the center of mass velocity of the group and all intervening absorption features were removed.
Download figure:
Standard image High-resolution imageThe Lyα stacks show net absorption centered around zero velocity for the CGM +IGrM subset, and absorption corresponding to higher velocity offsets in the IGrM stack. When we stack the full COS-IGrM sample, we observe a combination of the two subsets meaning that the IGrM in our sample is traced by two distinct regions: gas at the systematic velocity of the group as well as gas that is at larger velocities than the group’s systemic velocity. This could perhaps be a result of warmer gas condensing in the outskirts and falling back toward the center of the group.
The O vi stacks show weak net absorption throughout all the sightlines. However, there is absorption in the IGrM sightlines. Both the CGM + IGrM stack and the pure IGrM stack show that the majority of the absorption is within of the central 800 kms−1 of the group. The covering fraction of the IGrM stacks is more uniform than the CGM stacks as there is net absorption throughout the ±800 kms−1. Nondetection of O vi in the full stack indicates that there is not a volume filling phase of the IGrM, but instead, an O vi traced IGrM is a more transient phenomena.
5. Discussion
From the COS-IGrM survey, we have observed no significant trends between the column density of Lyα or O vi and the physical parameters of the group such as virial radius, impact parameter, and halo mass. This may be an indication that we are not observing a hot, volume filling IGrM; instead we are detecting cooler pockets of gas that are perhaps in pressure confinement within the IGrM. This would line up more closely with what was concluded in Stocke et al. (2017), Pointon et al. (2017), and Stocke et al. (2019) for more massive groups. If this is indeed correct, X-ray spectroscopy of O vii and O viii would be required to observe the hotter component of the IGrM, even for lower mass groups (1012.8–1013.7 M⊙).
This idea is further reinforced by looking at the virial temperatures of the groups compared to the predicted O vi column densities from collisional ionization equilibrium models (Gnat & Sternberg 2007). Figure 13 (left) shows the predicted and observed column densities of O vi normalized by the total hydrogen column density through the group as a function of virial temperature (denoted by N(H ɪ)model). The column density of hydrogen was estimated by using the IGrM gas density of n = 10−3 cm−3, and multiplying it by the total path length through each group in our sample, which is approximated by a sphere of radius, 2 Rvir. The gas density was selected as a conservative estimate based upon electron density profiles from X-ray data of galaxy groups (Sun et al. 2003; Khosroshahi et al. 2004) and from density measurements of the IGrM from double bent radio jets (Freeland & Wilcots 2011). From this figure, it is evident that we are primarily observing cooler gas than what would be at the group’s virial temperature based upon the amount of O vi observed, which provides more support to our previous statements.
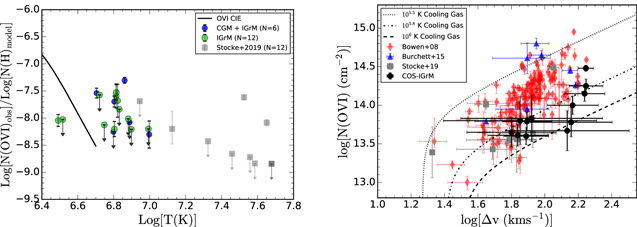
Figure 13. Left: observed O vi column densities normalized by the QSO path length through the group as a function of group virial temperature (N(H i)model). The blue and green data points are from the COS-IGrM sample, while the gray squares show the results from Stocke et al. (2019). The solid, black line represents theoretical predictions based on collisional ionization equilibrium models from Gnat & Sternberg (2007) assuming 50% solar metallicity, assuming a total hydrogen density of 10−3 cm−3. Right: O vi column density as a function of the detected O vi line width (Δv). The dotted, dotted–dashed, and dashed lines show radiative cooling models from Bordoloi et al. (2017) at 105.5, 105.8, and 106 K, respectively.
Download figure:
Standard image High-resolution imageTo investigate the theory that the observed O vi is due to cooler gas than the hotter IGrM, we looked at the relationship between the O vi column density and the O vi line width for our sample and other samples from various environments (right panel of Figure 13). Heckman et al. (2002) demonstrated that O vi absorption lines in various environments such as the Milky Way, high velocity clouds, Magellanic Clouds, starburst galaxies, and the IGM all can be described by radiatively cooling gas through the relationship between column density and the Doppler “b” parameter. Bordoloi et al. (2017) revisited these models to show that the line width,  , is a more appropriate tracer of the flow velocity than the Doppler “b” parameter in describing the radiatively cooling O vi. We show data from Bowen et al. (2008); Burchett et al. (2015), and Stocke et al. (2019) along with the COS-IGrM survey O vi detections
12
to show that the trends observed from O vi in the Milky Way and the IGM also largely agree with O vi detected in the IGrM, respectively. On average, the COS-IGrM data can be described by radiatively cooling gas between 105.8 K, and 106 K. This may be indicating that the O vi detected in our sample originates from gas falling toward member galaxies and cools radiatively as it passes through the CGM of a group member or passes through cooler pockets within the hotter IGrM.
, is a more appropriate tracer of the flow velocity than the Doppler “b” parameter in describing the radiatively cooling O vi. We show data from Bowen et al. (2008); Burchett et al. (2015), and Stocke et al. (2019) along with the COS-IGrM survey O vi detections
12
to show that the trends observed from O vi in the Milky Way and the IGM also largely agree with O vi detected in the IGrM, respectively. On average, the COS-IGrM data can be described by radiatively cooling gas between 105.8 K, and 106 K. This may be indicating that the O vi detected in our sample originates from gas falling toward member galaxies and cools radiatively as it passes through the CGM of a group member or passes through cooler pockets within the hotter IGrM.
The cooling models described in Bordoloi et al. (2017) predict that N v column densities should be about an order of magnitude lower than those predicted for O vi. This prediction is consistent with our three N v detections as well as our upper limits in this sample based upon the 105.27 K cooling curves in Bordoloi et al. (2017). Since many of the O vi detections are relatively close to the detection limit, the lack of N v detections is not unexpected due to this prediction.
Lastly, we can make an estimate as to the total amount of oxygen in these galaxy groups. Following Equation (1) in Tumlinson et al. (2011), we can calculate the minimum mass of oxygen in galaxy group halos by

where fOVI is the fraction of oxygen that is in O vi based upon CIE models Gnat & Sternberg (2007). Using both the mean and median values of the O vi column densities and group virial radii, we can determine the minimum amount of oxygen mass in our galaxy groups. This can be compared to the amount of oxygen in the member galaxies by assuming MO ∼ 0.065 M* (Peeples et al. 2014; Tumlinson et al. 2017). This difference (gray shaded region) is shown in Figure 14 for both the mean (dashed lines) and median (solid lines) values of the stellar masses of group members. Based upon the virial temperature of these galaxy groups in Figure 13, the corresponding fraction of oxygen in O vi is <10−4. Therefore, we can estimate that over the narrow temperature range corresponding to fOVI of 10−4–10−5 (106.55–106.75 K), there is upward of 1011.6 M⊙ of oxygen in the IGrM.
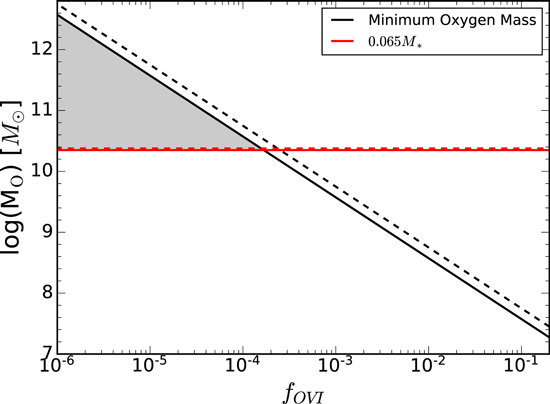
Figure 14. The minimum mass of oxygen as calculated by Equation (4) compared to the mass of oxygen in the member galaxies. The solid lines show the masses determined by median values, while the dashed lines show the masses determined through the mean of the stellar mass, virial radii, and O vi column densities. The gray shaded region shows the mass of oxygen that can be attributed to the IGrM at various values of fOVI, the fraction of oxygen that is in O vi.
Download figure:
Standard image High-resolution image5.1. Future Outlook
In order to accurately and completely characterize the IGrM, higher ionization species should be targeted in future studies. From the COS-IGrM survey, it is clear that O vi is not an ideal tracer of the IGrM. Since O vi is only observed in eight out of our 18 groups, the predominant, volume filling component of the IGrM should exist at a hotter temperature for galaxy groups at halo masses between 12. M⊙ < log[Mhalo] <14.7 M⊙. We can rule out a pervasive media of the IGrM at cooler temperatures due to the weak low and medium ionization potential lines observed in our data. Therefore, to observe the dominant phase of the IGrM, future studies should look to O vii, O viii, Ne iii, and Mg x, which are stronger transitions at temperatures of 106.5–107.5 K.
Once the pervasive phase of the IGrM is observed, it can be combined with other studies to fully characterize the IGrM of galaxy groups. Simulations by Davé et al. (2002), Le Brun et al. (2017), and Farahi et al. (2018) have made substantial progress in determining consistent scaling relations for lower mass halos that are consistent with observational programs such as those by Sun et al. (2003), Eckmiller et al. (2011), Babyk et al. (2018), and Lovisari et al. (2020). Additionally, the thermal SZ effect is being utilized in order to determine the baryonic content of lower mass galaxy clusters and groups (Vikram et al. 2017; Henden et al. 2019; Pratt & Bregman 2020, and references therein). By the combination of these results, these hot halos can be fully characterized.
6. Conclusions
We present the results of the COS-IGrM survey, where 18 QSO sightlines passing through galaxy groups (0.2 Rvir ≤ ρ ≤ 1.6 Rvir) were studied in an effort to characterize the IGrM. Our conclusions are as follows:
- 1.We detect Lyα absorption in 12 of the 18 galaxy groups, with four of those groups also having corresponding Lyβ absorption. However, we detect no statistically significant trend between Lyα column density and halo mass or QSO impact parameter.
- 2.Eight of the 18 groups show the presence of O vi thus the covering fraction of O vi is 44 ± 5%. The lack of O vi absorption in over 50% of our sample indicates that the volume filling IGrM at (or near) the virial temperature of galaxy groups is not primarily traced by O vi. We also find no correlation between column density of O vi and halo mass or QSO impact parameter.
- 3.C ii, Si ii, Si iii, and N v absorption was detected in 5, 1, 5, and 2 groups, respectively. These lead to covering fractions of 28 ± 5%, 6 ± 5%, 28 ± 5%, and 11 ± 5% for C ii, Si ii, Si iii, and N v, respectively. These data suggest that the low-ionization transitions are primarily due to photoionization or other nonequilibrium processes.
- 4.We find evidence that the IGrM is multiphase and has a complex structure. While higher resolution spectra and coverage of more intermediate-ionization transitions are necessary for complete ionization modeling, we find five instances where CIE explains the observed spectra and four instances where photoionization is consistent with the transitions present.
- 5.We find that nine out of 70 absorbers (13 ± 1%) have sufficient velocities, relative to the group, to escape the group’s gravitational potential. Therefore, we conclude that galaxy groups are primarily closed boxes for galaxy evolution at low redshifts (0.1 ≤ z ≤ 0.2).
- 6.We show that the O vi absorbers can be described by radiatively cooling gas between 105.8 and 106 K. This might indicate that the O vi detected in our sample originates from pockets of gas cooling within the hotter component of the IGrM.
- 7.We do not find evidence of AGN activity having an impact on whether or not O vi is detected within a group or not. Similarly, we do not observe the star formation of the nearest spectroscopically confirmed neighbor to be a driver for O vi.
- 8.We observe some O vi absorption in our stacked data. This shows evidence of O vi traced IGrM throughout our sample. Despite O vi not being the dominate form of oxygen at the virial temperature of these galaxy groups, we see evidence that we are observing gas cooler than the hot, volume filling component of the IGrM that could be observed in X-rays via O vii, O viii, Na xii, or extreme-UV lines such as Ne viii.
Since the O vi detections are determined to be primarily tracers of cooler pockets of gas and not the IGrM at the virial temperature of the group, full accounting for the amount of baryonic matter in these groups cannot be accurately measured with the data in hand. In order to complete the baryon census for galaxy groups, future studies should try and observe higher ionization states such as O vii and O viii, which will trace gas closer to the virial temperature of galaxy groups.
The authors would like to thank the anonymous referee for their feedback and suggestions to improve this manuscript. T.M., S.B., and T.H. are supported by HST-GO-13314 from STScI. The authors would also like to thank Mark Voit along with Chris Dupuis, Mansi Padave, Ed Buie II, Hansung Gim, Jacqueline Monkiewicz, and Martin Flores from the STARs Lab at ASU for thoughtful discussion and input throughout this project. The Arizona State University authors acknowledge the twenty two Native Nations that have inhabited this land for centuries. Arizona State University's four campuses are located in the Salt River Valley on ancestral territories of Indigenous peoples, including the Akimel O’odham (Pima) and Pee Posh (Maricopa) Indian Communities, whose care and keeping of these lands allows us to be here today. We acknowledge the sovereignty of these nations and seek to foster an environment of success and possibility for Native American students and patrons.
Appendix: Group Environments
The remaining group environments are shown below in Figure 15. These environments were constructed from the New York University Value-Added Galaxy Catalog (NYU-VAGC; Blanton et al. 2005) based on SDSS Data Release 2. These environments were used to distinguish between QSO sightlines that pass through only the IGrM from those passing through the CGM and the IGrM.
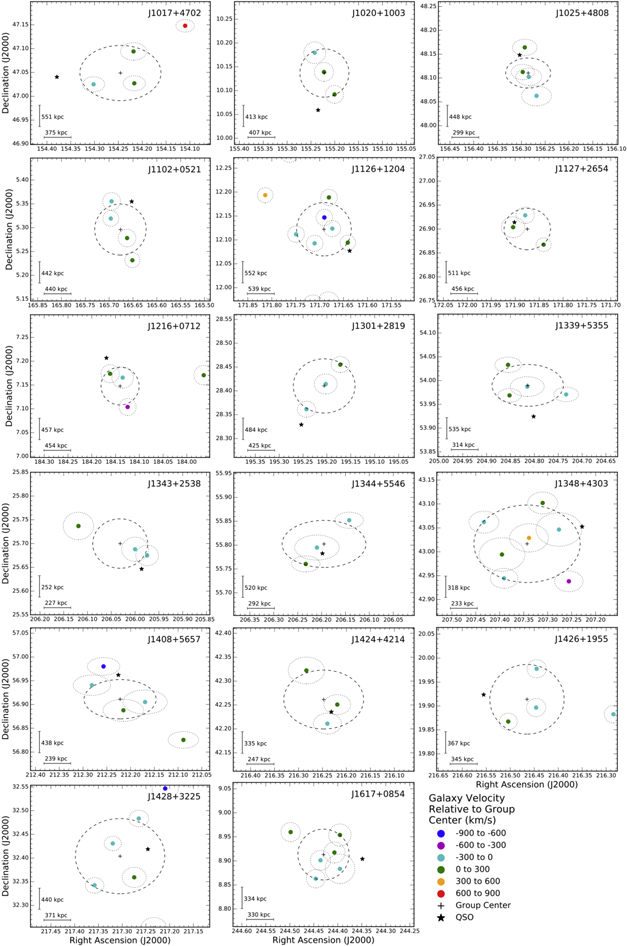
Figure 15. Environment plots for the remaining groups in the COS-IGrM sample that showed absorption lines within ±800 kms−1 of the group center. The color of the points represent the velocity of the member galaxies relative to the center of the group. The thick, dashed line represents the virial radius of the group, the thin, dotted lines represent the virial radii of the group members, the QSO sightline is represented by the star, and the group center is marked by the plus sign.
Download figure:
Standard image High-resolution imageFootnotes
- 6
The data is available at MAST:10.17909/t9-wqg9-9043.
- 7
In the HST proposal, there were 19 sightlines; however, one sightline had an insufficient signal to noise to use for this analysis.
- 8
Table 2 is published in machine-readable format in the online journal.
- 9
This velocity offset is only from the line-of-sight velocity. As a result, if the other two velocity components were known, then the fraction of unbound absorbers could increase.
- 10
- 11
- 12
Since the line width is related to the Doppler “b” parameter and therefore a Voigt profile fit, there is no physical upper limit for nondetections.