Abstract
We report on a long-term optical monitoring of the neutron star X-ray binary Centaurus X-4 performed during the last 13.5 yr. This source has been in quiescence since its outburst in 1979. Our monitoring reveals the overall evolution of the accretion disk; we detect short-duration flares, likely originating also in the disk, superimposed with a small-amplitude (<0.1 mag) ellipsoidal modulation from the companion star due to geometrical effects. A long-term (∼2300 days) downward trend, followed by a shorter (∼1000 days) upward one, is observed in the disk light curve. Such a rise in the optical has been observed for other X-ray binaries preceding outbursts, as predicted by the disk instability model. For Cen X-4, the rise of the optical flux proceeded for ∼3 yr, and culminated in a flux increase at all wavelengths (optical–UV–X-rays) at the end of 2020. This increase faded after ∼2 weeks, without giving rise to a full outburst. We suggest that the propagation of an inside-out heating front was ignited due to a partial ionization of hydrogen in the inner disk. The propagation might have stalled soon after the ignition due to the increasing surface density in the disk that the front encountered while propagating outward. The stall was likely eased by the low-level irradiation of the outer regions of the large accretion disk, as shown by the slope of the optical/X-ray correlation, suggesting that irradiation does not play a strong role in the optical, compared to other sources of emission.
Original content from this work may be used under the terms of the Creative Commons Attribution 4.0 licence. Any further distribution of this work must maintain attribution to the author(s) and the title of the work, journal citation and DOI.
1. Introduction
Low-mass X-ray binaries (LMXBs) are binary systems hosting a compact object, which can be a neutron star (NS) or a stellar-mass black hole (BH), and a low-mass companion star (with mass ≲ 1M⊙). The latter is typically a main-sequence star, filling its Roche lobe and transferring matter and angular momentum to the compact object through the formation of an accretion disk. LMXBs can be transient, displaying short and sudden outbursts, with X-ray luminosities that can reach LX ∼ 1036 − 1038 erg s−1 and high accretion rates, and longer, quieter intervals of quiescence, with a drop of the X-ray luminosity by up to seven orders of magnitude. At X-ray frequencies, outbursts are typically characterized by a sharp increase of the flux, lasting days to months, and a longer, slower decay that can take place over weeks to months, until reaching its former quiescent level (Frank et al. 1987).
X-ray radiation typically comes from the internal part of the accretion disk, close to the compact object (Lasota 2001), from the corona (which is a region of hot electron plasma that is thought to surround the compact object—and according to some models, the accretion disk as well), and in the case of NSs, from the compact object itself; optical radiation, on the other hand, is thought to primarily come from the companion star and the external part of the disk, the latter being dominant during outbursts, plus a contribution in some systems from synchrotron radiation from compact, collimated jets (see, e.g., Homan et al. 2005; Russell et al. 2007; Buxton et al. 2012; Kalemci et al. 2013; Baglio et al. 2018, 2020). A rise in the optical flux is expected to occur as the temperature in the disk increases, triggering the ionization of hydrogen, which may start the outburst (see Lasota 2001 for a review).
The mechanism that triggers such outbursts is still uncertain. The most accredited scenario is called the disk-instability model (DIM; see Lasota 2001; Hameury 2020 for reviews). The DIM was first suggested to explain the outbursts in dwarf novae (a subclass of cataclysmic variables, that display recurrent outbursts; see Cannizzo et al. 1982), and then extended to LMXBs due to the analogy that was observed between the two classes of systems during outbursts, in particular regarding their fast rise and exponential decay (van Paradijs & Verbunt 1984; Cannizzo et al. 1985). According to the DIM, the instability is driven by the ionization state of hydrogen in the disk. If all the hydrogen in the disk is ionized, the system is considered to be stable, as it happens, e.g., in persistent LMXBs or in nova-like systems (i.e., the class of cataclysmic variables that show a persistent behavior). However, if the mass accretion rate or the temperature becomes low enough to allow for the recombination of hydrogen, then a thermal-viscous instability can occur in the disk, that oscillates between a hot, ionized state, which we refer to as outbursts, and a cold, recombined state, known as quiescence. When the system is in quiescence, the cold accretion disk accumulates mass until a critical density, and at the same time the temperature rises until the hydrogen ionization temperature is reached at a certain radius (ignition point). At the ignition point, two heating fronts are generated (Smak 1984; Menou et al. 1999), one propagating inward, and the other outward.
Two different types of outbursts can be observed, depending above all on how fast the two fronts propagate. “Inside-out” outbursts start at small radii, and the inward heating front will fast reach the inner accretion disk; “outside-in” outbursts instead are ignited further away in the disk, therefore the propagation toward the inner disk takes longer. In addition, in inside-out outbursts, the outward heating front propagates toward regions of higher densities, while outside-in fronts will always encounter regions with decreasing surface density (Dubus et al. 2001). Therefore, it is easier for an inside-out outburst to stall and to develop a cooling front that switches off the outburst. Inside-out outbursts therefore typically propagate slowly, leading to long rise times of the outburst.
Once the outburst is triggered, accretion continues at high rates, giving rise to the observed high X-ray luminosity. Then the outburst starts to decay and the disk is depleted, bringing the system back to its quiescent state (Lasota 2001).
This picture is very simplified, and many studies have shown that the effect of direct and indirect irradiation from the compact object, plus the evaporation of the accretion disk in a region that is close to the compact object (for example, the hot inner flow, or corona), plus geometrical effects, are important to take into account in order for the DIM to work for LMXBs (see Dubus et al. 1999, 2001). In particular, irradiation has been found to ease the propagation of the outward heating front in inside-out outbursts by reducing the critical density needed for a certain ring of the disk to become thermally unstable (Dubus et al. 2001). Moreover, some variations are observed for different systems; for example, the time delay between the occurrence of the disk instability (coinciding with the beginning of the heating front propagation in the disk), and the actual start of the outburst (when accretion onto the compact object is detected as an increase in X-ray luminosity) can be different from system to system.
Observations of the optical rise to outburst are crucial in order to probe the DIM (in particular, the measurement of the optical to X-ray delay of the rise to outburst, and the gradual long-term increase in the optical that is sometimes observed before an outburst is triggered). Unfortunately, such observations are often difficult, since outbursts typically rise within a few days and are frequently detected only when the X-ray flux rises above the all-sky monitors’ detection threshold, and therefore the initial stages of the optical rise are missed. Such optical to X-ray delays during the rise of an outburst have been measured using optical monitoring and X-ray all-sky monitors in a few systems, such as V404 Cyg (<7 days; Bernardini et al. 2016b), GRO J1655-40 ( <6 days; Orosz & Bailyn 1997; Zhang et al. 2019), XTE J1550–564 (<9 days; Jain et al. 2001), XTE J1118+480 (<10 days; Wren et al. 2001; Zurita et al. 2006), 4U 1543–47 ( <5 days), ASASSN–18ey (MAXI J1820+070; <7 days; Tucker et al. 2018), Aql X-1 (3–8 days; Shahbaz et al. 1998; Russell et al. 2019), etc. Recently, a delay of 12 days was measured for the NS LMXB SAX J1808.4–3658 (Goodwin et al. 2020) using an X-ray instrument more sensitive than an all-sky monitor (NICER), giving an important confirmation of the optical to X-ray delay during the onset of outbursts in LMXBs.
It is clear that the continuous optical monitoring of LMXBs is essential in order to obtain such measurements, together with many other possible achievements (like, e.g., the study of the quiescent behavior of the sources, or the monitoring of the different stages of an LMXB outburst; Russell et al. 2019). As part of this effort, we have been monitoring ∼50 LMXBs with the Las Cumbres Observatory (LCO) and Faulkes 2 m and 1 m robotic telescopes since 2008 (Lewis et al. 2008), and recently we developed a pipeline, the X-ray Binary New Early Warning System (XB-NEWS) that is able to process all the collected data as soon as they are acquired, and produces real-time light curves of all the monitored objects (for more details on the project, see Russell et al. 2019). Since the monitoring was started and the pipeline has been routinely running, we have been able to detect the onset of outbursts in a few cases before the X-ray all-sky monitors could, like in the case of SAX J1808.4-3658 (Goodwin et al. 2020) and the one presented in this work.
2. Centaurus X-4
Cen X-4 (short for Centaurus X-4) is an NS LMXB, discovered in 1969 July during an outburst by the X-ray satellite Vela 5B (Conner et al. 1969). The source had a second outburst 10 years later, in 1979, as detected by the All-Sky Monitor experiment on the Ariel 5 satellite (Kaluzienski et al. 1980), and radio detections were reported (Hjellming 1979). The optical counterpart was identified with a bright, blue object, which brightened to a magnitude of V ∼ 12.8 mag from V ∼ 18.7 mag (Canizares et al. 1980). Later, the companion star was classified as a 0.35 M⊙ K5–7 V star, filling a 0.6 R⊙ Roche lobe (Shahbaz et al. 1993; Torres et al. 2002; D’Avanzo et al. 2005; Shahbaz et al. 2014). The ratio between the masses of the two stars has also been carefully evaluated by Shahbaz et al. (2014), thanks to which a relatively accurate estimate of the neutron star mass has been derived ( ). The orbital period has been measured with different techniques, leading to a period of ∼15.1 hr (see McClintock & Remillard 1990; Torres et al. 2002; Casares et al. 2007). Cen X-4 is one of the brightest quiescent NS-LMXBs in the optical, with V ∼ 18.7 mag, and a non-negligible accretion disk contribution at optical frequencies also in quiescence (Shahbaz et al. 1993; Torres et al. 2002; D’Avanzo et al. 2005). The interstellar absorption is low, AV = 0.31 ± 0.16 mag (Russell et al. 2006), and the distance to the system is 1.2 ± 0.2 kpc (Chevalier et al. 1989), which is reasonably consistent with the most recent estimate obtained with Gaia (
 kpc; Bailer-Jones et al. 2018).
Cen X-4 has been in quiescence since the end of its second outburst in 1979. In 2020 December, signs of a possible gradual brightening over the previous ∼3 yr were reported thanks to an optical monitoring of the source performed with the LCO 2 m and 1 m robotic telescopes (Waterval et al. 2020). After 2020 August 31 (MJD 59092), the source was Sun-constrained until 2020 December 30 (MJD 59213); the first LCO observation after the Sun constraint ended showed a significant brightening in all optical bands (Saikia et al. 2021), which then resulted in prominent flaring activity that lasted for ∼2 weeks. By mid-January, the source was back to its quiescent levels at all wavelengths (van den Eijnden et al. 2021a). In this paper, we present long-term optical monitoring of Cen X–4, which led to the prediction of a possible new outburst, and we report on the subsequent observed flaring activity using optical and X-ray observations. For the whole study presented in this work, the following Python packages have been used for coding purposes: Matplotlib (Hunter 2007) and NumPy (Van Der Walt et al. 2011). Additional data analyses were done using IDL version 8.7.3.
3. Observations and Data Analysis
3.1. Optical Monitoring with LCO
Cen X-4 has been regularly monitored in the optical during the last ∼13.5 yr with the LCO 2 m and 1 m robotic telescopes, from 2008 February 14 (MJD 54510) to 2021 June 30 (MJD 59395), mostly using V, R, and  filters (Table 1). In total, the monitoring campaign until 2021 June 30 has acquired 316, 183, and 315 images in V, R, and
  , respectively, plus 110 and 36 images in the
  and
and  filters, respectively. The images have been processed and analyzed by the recently developed XB-NEWS pipeline, which downloads the reduced images (i.e., bias, dark, and flat-field corrected images) from the LCO archive,
16
automatically rejects poor-quality reduced images, performs astrometry using Gaia DR2 positions,
17
carries out multi-aperture photometry (MAP; Stetson 1990), solves for photometric zero-point offsets between epochs (Bramich & Freudling 2012), and flux-calibrates the photometry using the ATLAS-REFCAT2 catalog (Tonry et al. 2018). If the target is not detected in an image above the detection threshold, then XB-NEWS performs forced MAP at the target coordinates. In this case, we reject all forced MAP magnitudes with an uncertainty >0.25 mag, as these are very uncertain photometric measurements. The pipeline produces near real-time calibrated light curves. For further details on XB-NEWS, see Russell et al. (2019) and Goodwin et al. (2020).
filters, respectively. The images have been processed and analyzed by the recently developed XB-NEWS pipeline, which downloads the reduced images (i.e., bias, dark, and flat-field corrected images) from the LCO archive,
16
automatically rejects poor-quality reduced images, performs astrometry using Gaia DR2 positions,
17
carries out multi-aperture photometry (MAP; Stetson 1990), solves for photometric zero-point offsets between epochs (Bramich & Freudling 2012), and flux-calibrates the photometry using the ATLAS-REFCAT2 catalog (Tonry et al. 2018). If the target is not detected in an image above the detection threshold, then XB-NEWS performs forced MAP at the target coordinates. In this case, we reject all forced MAP magnitudes with an uncertainty >0.25 mag, as these are very uncertain photometric measurements. The pipeline produces near real-time calibrated light curves. For further details on XB-NEWS, see Russell et al. (2019) and Goodwin et al. (2020).
Table 1. Central Frequency νc of the UV/Optical/NIR Filters That Are Relevant for This Work
| Filter | νc (Hz) | Filter | νc (Hz) |
|---|---|---|---|
| uvw2 | 1.556 × 10¹⁵ | R | 4.680 × 10¹⁴ |
| uvm2 | 1.334 × 10¹⁵ |

| 3.979 × 10¹⁴ |
| uvw1 | 1.154 × 10¹⁵ |

| 3.286 × 10¹⁴ |
| u | 8.658 × 10¹⁴ | J | 2.419 × 10¹⁴ |

| 6.289 × 10¹⁴ | H | 1.807 × 10¹⁴ |
| V | 5.505 × 10¹⁴ | K | 1.389 × 10¹⁴ |

| 4.831 × 10¹⁴ |
Download table as: ASCIITypeset image
By visual inspection of the light curves, the presence of a number of outliers was evident. We therefore performed a systematic search for outliers in the light curves by plotting each band against the other, using observations taken a maximum of 0.5 days apart. We then selected all points lying outside the 2 σ interval and investigated the corresponding images. The majority of these images (a total of nine in the V, R, and  bands, respectively) were found to be of poor quality for various reasons (i.e., background issues) and were therefore rejected.
In the end, a total of 109, 292, 36, 163, and 294 reliable magnitudes in the  , V,
, V,  , R, and
  bands (Table 1), respectively, have been obtained during our long-term optical monitoring of Cen X-4 with LCO (Figure 1).
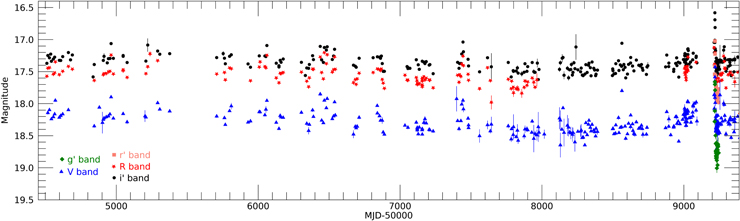
Figure 1. Thirteen and a half years of optical monitoring of Cen X-4 performed with LCO in the  , V,
, V,  , R, and
  bands. All magnitudes are calibrated; error bars represent 1σ uncertainties.(The data used to create this figure are available.)
Download figure:
Standard image High-resolution image3.2. Optical and Near-infrared Observations with REM
Cen X-4 was observed on January 5, 2021 (MJD 59219) with the 60 cm Rapid Eye Mount (REM; Zerbi et al. 2001; Covino et al. 2004) telescope (La Silla, Chile). Strictly simultaneous, 300 s integration time observations have been obtained using the optical SDSS  filters (Table 1), for a total of nine observations per filter. Images were reduced using standard procedures (bias subtraction and flat-field correction), and aperture photometry was performed on the stars in the field using PHOT in IRAF.
18
Photometry was then flux-calibrated using APASS
19
stars in the field (Henden 2019).
filters (Table 1), for a total of nine observations per filter. Images were reduced using standard procedures (bias subtraction and flat-field correction), and aperture photometry was performed on the stars in the field using PHOT in IRAF.
18
Photometry was then flux-calibrated using APASS
19
stars in the field (Henden 2019).
The system was then observed again on 2021 May 22 (MJD 59356) with REM. Observations were acquired in the optical SDSS  ,
,  ,
,  ,
,  bands, strictly simultaneously (90 s integration, for a total of 26 images/filter). Reduction and analysis of the optical data were performed as described above. At the same time, NIR (2MASS JHK bands) observations were acquired with the REMIR camera mounted on REM, alternating the filters, performing 15 s integration exposures. A total of 90 images/filter were acquired. Dithering of the images was performed with the aim of evaluating the variable contribution of the sky, which was then subtracted from each image. Images were then combined five by five to increase the signal-to-noise ratio. Flux calibration of the NIR images was performed against a group of 2MASS stars in the field.
3.3. Swift X-Ray and Optical/UV Monitoring
The Neil Gehrels Swift Observatory (hereafter Swift; Burrows et al. 2005) observed Cen X–4 16 times between 2020 December 28 and 2021 January 23 with the X-Ray Telescope (XRT; Burrows et al. 2005) and Ultraviolet and Optical Telescope (UVOT; Roming et al. 2005) instruments. For the XRT, we only analyzed data obtained when the instrument was in Photon Counting mode, as the source was too faint to be detected in the short Window Timing mode exposures. For each XRT observation, we extracted source spectra from a circular aperture with a radius of 20 pixels (∼47″) centered on the source. Background-only spectra were extracted from an annulus with inner and outer radii of 40 and 60 pixels (∼94″ and ∼141″), respectively, also centered on the source. From the background-subtracted spectra, we created a 0.5–10 keV light curve (with one data point per observation), correcting for changes in the effective area between observations that resulted from differences in how bad columns affected the source counts.
The UVOT instrument observed Cen X-4 during the 2020/2021 flare, using all available filters (v, b, u, uvw1, uvm2, and uvw2), for a total of 14 epochs between MJD 59211 (2020 December 28) and MJD 59237 (2021 January 23). The data were analyzed using the uvotsource HEASOFT routine, defining as the extraction region a circular aperture centered on the source with a radius of 3″, and as background a circular aperture (away from the source) with radius of 10″. Several detections have been obtained, in addition to some upper limits in all bands. The light curves are shown in the middle panel of Figure 2.
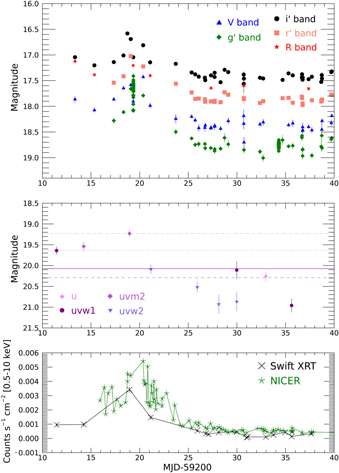
Figure 2. Top panel: zoom-in of the LCO light curve between 2020 December 30 (MJD 59213) and 2021 January 26 (MJD 59240); Middle panel: Swift/UVOT observations of the 2021 flare. Upper limits are not plotted, for clarity. All UVOT magnitudes are AB magnitudes. With solid, dashed, dotted, and dashed–dotted lines, the quiescent levels in uvw1, uvw2, uvm2, and u (respectively) of the source are drawn. The quiescent levels have been estimated by averaging UVOT archival data, starting with 2012 January. Bottom panel: Swift/XRT and NICER observations of the 2021 flare.(The data used to create this figure are available.)
Download figure:
Standard image High-resolution image3.4. NICER Monitoring
The Neutron-star Interior Composition Explorer (NICER, Gendreau et al. 2012, 2016) observed Cen X-4 extensively in early 2021. We analyzed all observations made between January 1 and February 19. The observations, each comprised of one or more good time intervals, were reprocessed using the nicerl2 script that is part of the NICERDAS package in HEASOFT v6.28, using calibration version 20200722.
Spectra were extracted for each good time interval (GTI) using the tool nibackgen3C50, which also creates background spectra (Remillard et al. 2022). For some GTIs, the parameters used to calculate background spectra could not be matched with the precalculated library of background spectra that is used by nibackgen3C50. In those cases, the GTI was excluded from our analysis, leaving a total of 186 spectra, with exposure times ranging from 51 s to 2627 s.
Background-subtracted light curves in the 0.5–10 keV band were extracted from the spectra, with each data point representing the average count rate of a single GTI. Inspection of the resulting light curve revealed strong flaring during the time interval of MJD 59240–59250 (2021 January 26–February 5), likely due to residual background. By filtering out GTIs for which the background count rate in the 0.5–10 keV band was >0.5 counts s−1, these “flaring” episodes were almost completely removed. Several suspicious outliers on MJD 59241-59242 and after MJD 59260 were removed manually.
4. Results
4.1. The Long-term Optical Monitoring
The long-term optical light curves obtained with LCO are shown in Figure 1. Strong variability is observed, characterized by the emission of optical flares or dips on the order of up to ∼0.5 mag on timescales of 1–2 months. A similar level of activity was previously reported in the optical by Zurita et al. (2003) and in the X-rays/UV by Campana et al. (2004) and Bernardini et al. (2013). Moreover, a decreasing trend in the average optical flux is observed in the long-term monitoring, up to ∼MJD 58016 (2017 September 20). After that date, the average flux gradually increased until right before the start of the 2020 period of Sun constraint (i.e., 2020 September). Any long-term variability in the optical light curve of LMXBs is typically related to an evolution of the accretion disk (see, e.g., the case of V404 Cyg; Bernardini et al. 2016b), or, rarely, of the jet (as in the case of Swift J1357.2-0933; Russell et al. 2018; E. Caruso et al. 2022, in preparation). The companion star contribution is instead expected to exhibit a double-humped ellipsoidal modulation at the orbital period of the source (Orosz & Bailyn 1997). We know from previous studies that jets are unlikely to contribute to the quiescent optical emission of Cen X-4 (Baglio et al. 2014), and therefore we will principally focus on the accretion disk emission. To estimate the level of variability of the stable accretion disk, we first determined a flux threshold for the emission of flares. Flares likely originate in the accretion disk, and are probably due to variability in the accretion rate, which happens on the viscous timescale (days–weeks), or could be related to irradiation and have timescales of seconds to minutes.
Following the work by Jonker et al. (2008), performed on the accreting millisecond X-ray pulsar IGR J00291+5934, we first folded the light curves on the known orbital period of the source (0.6290630 days; McClintock & Remillard 1990); then we established a possible magnitude threshold brighter than which the points are assumed to be flares from the disk, and we removed all the magnitudes that were brighter than the threshold in each band. We further binned these points in 20 bins of orbital phase of equal width. To better approximate the double-humped ellipsoidal modulation of the companion star emission, we performed a nonlinear weighted least-squares fit to the binned magnitudes (m) versus phase (x) data with a double sinusoidal function plus a constant: m =  , where C is a constant magnitude, Φ is the phase corresponding to the inferior conjunction of the companion star, and A1 and A2 are the semi-amplitudes of the two oscillations; we note that one oscillation has a fixed double periodicity with respect to the other, and the free parameters of the fit are C, A1, A2, and Φ. We computed the χ2 and the degrees of freedom (dof) of the fit. We then changed the threshold value and repeated the above steps. Eventually, we plotted our results in a χ2 against number of dof plot, for all bands (see Figure 3 for the R-band plot); as in Jonker et al. (2008), the relation is linear until a certain level, then it deviates from the linear correlation. We therefore took the point where the deviation occurs as the threshold level for the flares: V =17.98 mag, R = 17.27 mag, and
  mag.
mag.
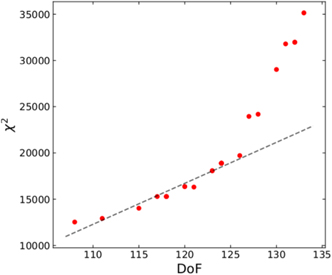
Figure 3. The χ2 of the fit of a double sinusoidal function plus a constant to the R-band light curve of Cen X-4 against the number of dof in the fit for the different magnitude thresholds that we considered. Superimposed, we plotted a dashed line corresponding to the linear fit of the lowest dof points, before the transition to a steeper correlation happens.
Download figure:
Standard image High-resolution imageOnce all flares were excluded, the folded light curves show a modulation, which is expected from the companion star, and some scatter (the errors from the photometry are much smaller than the observed scatter; see Figure 4). In all filters, the semi-amplitude of the modulations is low (∼0.1 mag).
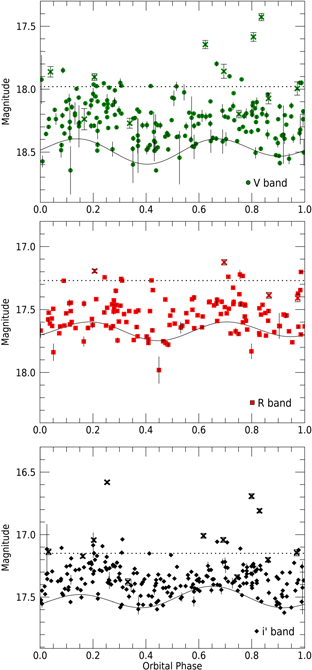
Figure 4. From top to bottom, V-, R-, and  -band light curves folded on the ∼15.1 hr orbital period (McClintock & Remillard 1990). Orbital phases are calculated according to the ephemeris by McClintock & Remillard (1990). The black solid curve shows the best fit to the lower envelope in each case, considering a simple model for the expected ellipsoidal modulation. In each panel, a horizontal black dashed line indicates the magnitude threshold for the flares (see text). All points lying above the dashed line therefore have to be considered as flares. All the observations during the 2020/2021 misfired outburst are plotted with an “x” symbol for comparison.
Download figure:
Standard image High-resolution imageWe first performed a fit with the double sinusoidal function model, in order to evaluate the parameters of the modulation. However, the light curves still have a significant contribution coming from the accretion disk. In order to isolate the modulation from the companion star, we estimated the lower envelope of the modulation following Pavlenko et al. (1996) and Zurita et al. (2004). We divided the  light curves into 10 identical phase bins; for each bin, we found the minimum brightness; we defined the lower envelope emission as all the observations that differ from this minimum by at most twice the average uncertainty of the 10 faintest observations in the bin. We then performed the fit of the lower envelope of the modulation with the double sinusoidal model, fixing the parameters of the modulation to those obtained for the whole light curves, after the flares removal (solid line in Figure 4). The constant magnitude of the modulation corresponds to V = 18.48 ± 0.01, R = 17.66 ± 0.01,
  .
.
The lower envelope of the modulation is plotted as a solid line in Figure 4.
We then subtracted the contribution of the lower envelope (constant+modulation) from every data point, with the aim of isolating the emission from the accretion disk. We converted the resulting magnitudes into flux densities (mJy), and built a light curve of the nonstellar flux densities during the last 13 yr of observations. The result is presented in Figure 5, and clearly shows a downward trend of the flux emitted from the disk before ∼2017 September 20 (MJD 58016), followed by an upward trend after this date. We performed a weighted least-squares fit with a constant plus a linear function (C + A t, where C is a constant flux, t is time expressed in MJD, and A is the gradient of the line) of the two trends separately for each band (no upward trend fitting was possible for the R band, due to the lack of data after MJD 58016). We note that the inclusion of the linear function improves the fit in all cases with a >10σ significance, according to an F-test.
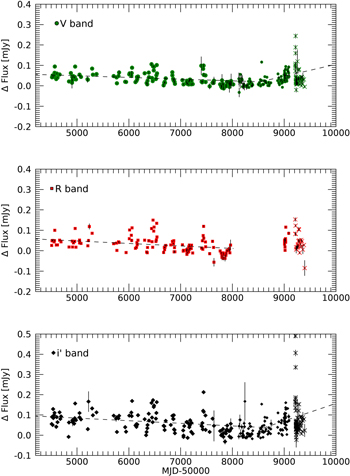
Figure 5. From top to bottom, V-, R-, and  -band light curves of the residuals, obtained after the subtraction of the sinusoidal modulation from the original light curves. Only the points from before the beginning of the 2020 Sun constraint are shown. Superimposed with dashed lines, the linear fits of the long-term trends are shown, where possible. The observations acquired during the 2020/2021 misfired outburst are plotted with an “x” symbol for comparison.
Download figure:
Standard image High-resolution imageThe results of the fit show a decrease of flux of (0.83 ± 0.02) × 10−5 mJy day−1, (1.22 ± 0.02) × 10−5 mJy day−1, and (1.28 ± 0.03) × 10−5 mJy day−1 in the V, R, and  bands, respectively, before MJD 58016, and an increase of flux of (5.85 ± 0.08) × 10−5 and (8.67 ± 0.11) × 10−5 mJy day−1 in the V and
  bands, respectively, after MJD 58016. The upward trend is therefore ∼7 times steeper with respect to the downward one, both in the
  and V bands.
4.2. The 2020/2021 Flare
After the Sun constraint ended, on 2020 December 30 (MJD 59213), Cen X-4 was found to be significantly brighter at optical wavelengths than before (Saikia et al. 2021), with a brightening of 0.57 ± 0.12 and 0.42 ± 0.09 mag in the V and  bands, respectively, compared to the previous point. During the first days of activity, the rise in the optical emission was found to be steep, with a flux increase of ∼0.3 mag and ∼0.8 mag in ∼6 days (i.e., until 2020 January 5; MJD 59219) in the V and
  bands, respectively. Our long-term monitoring of Cen X-4 with LCO shows that the modulation of the source has a ∼0.1 mag semi-amplitude, which is much smaller than what is required to explain the amplitude of the variability. However, instead of undergoing a full outburst, the flare peaked on MJD ∼59219–20 (2021 January 5–6) in all optical bands, and then started to fade rapidly, at a steep rate similar to that of the rise (losing ∼1–1.2 mag in ∼8–9 days in all bands), and reached quiescent levels again on MJD ∼59228 (2021 January 14), ∼8 days after the peak. Since a proper outburst did not have the chance to start, we classify this peculiar activity as a “misfired outburst.”
Looking at Figure 5, we note that, soon before the beginning of the Sun constraint, a few detections were lying above the quiescent level indicated by the linear fit at all wavelengths. However, this flux increase looks comparable to the amount of activity typically observed during quiescence for Cen X-4 (see Figure 5). Therefore, we consider it unlikely that these points are marking the beginning of the misfired outburst, which likely started during the Sun constraint or at the end of it.
4.2.1. Short-term Optical Variability
The REM observations performed during the misfired outburst on 2021 January 5 (MJD 59219) resulted in optical light curves showing variability (Figure 6, left panel). Following Vaughan et al. (2003), we evaluated the fractional root mean square (rms) of the light curves in order to quantify the variability in the  ,
,  , and
, and  bands, and we measured a fractional rms of (12.9 ± 2.9)%, (12.1 ± 2.3)%, (15.1 ± 3.4)% in the
  ,
,  , and
, and  bands, respectively. The intrinsic variability is therefore comparable in all bands. In the
  band, a dramatic variability is observed, with ∼1 mag difference between the lowest and highest point of the light curve (and a fractional rms of 28.6 ± 2.8%. However, very similar variability is also observed for a comparison star of similar brightness in the
  band, so we tend to attribute it to the strong fringing of the
  -band images.
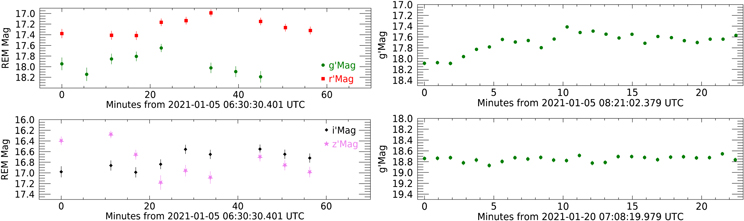
Figure 6.
Left:  ,
,  (top panel),
  , and
, and  (bottom panel) light curves obtained with REM on 2021, January 05 (MJD 59219), showing minute-timescale variability. Right:
  -band light curves obtained with LCO on 2021 January 05 and 20 (MJD 59219 and 59234, respectively), showing minute-timescale variability.(The data used to create this figure are available.)
Download figure:
Standard image High-resolution imageA similar, higher-significance variability is observed in the 22.5 min duration light curve obtained on the same day (MJD 59219; January 5) with LCO in the  band, which has a fractional rms of (15.5 ± 0.5)%, for a light curve with a time resolution of ∼56 s. A
  -band light curve with the same time resolution, obtained at the end of the flaring episode with LCO on MJD 59234 (2021 January 20), has a significantly lower short-timescale variability (fractional rms of (2.8 ± 0.9)%;Figure 6, right panel). Despite the value of the fractional rms being comparable, this variability is observed on much longer timescales (minutes; Figure 6) with respect to sources like the BH XRBs GX 339-4 or MAXI J1535-571 (seconds or less), for which the variability was attributed to the presence of a flickering jet (e.g., Gandhi et al. 2010; Baglio et al. 2018). It is therefore unlikely that the observed optical variability can be attributed to the emission of jets in the system.
4.2.2. X-Rays
The X-ray coverage of the 2020/2021 flare started on MJD 59211 (2020 December 28). The Swift/XRT and NICER light curves in Figure 2 show that the X-ray flare peaked around the same time as the optical, between MJD 58918 and MJD 59221 (2021 January 4 and January 7). The NICER light curve (which has the higher time resolution) reveals strong variability (by factors of 2–3) on a timescale of hours near the peak of the flare. Analysis of archival data shows that the X-ray peak count rates observed during the 2020/2021 flare were a factor ∼2 (Swift/XRT) and ∼2.5 (NICER) times higher than the maximum count rates of Cen X-4 in observations made prior to 2020 December, when the source was in quiescence.
Spectra obtained from most of the Swift observations and NICER GTIs were not of sufficient quality to perform detailed spectral fits. Using XSPEC V12.11.1 (Arnaud 1996), we performed a fit to the NICER spectrum with the highest count rate (MJD 59220.373038, the first GTI of observation 3652010501, with an exposure time ∼1250 s). The main goal of this spectral fit was to obtain a reliable count rate to flux conversion factor that can be used to estimate the outburst flux (see Section 5.3), under the assumption that the spectral shape did not change significantly during the outburst. The NICER spectrum was rebinned to a minimum of 30 counts per spectral bin so that χ2 fitting could be employed. Following Cackett et al. (2010) and Chakrabarty et al. (2014), who studied the variable quiescent spectra of Cen X-4, we fit the 0.5–10 keV spectrum with a continuum model comprised of a thermal and a nonthermal component. For the thermal component, we used the neutron-star atmosphere model of Heinke et al. (2006) (nsatmos in XSPEC), and for the nonthermal component, we used a power law; the bandpass of NICER did not extend high enough to test more sophisticated models for the nonthermal component (as was done in Chakrabarty et al. 2014, for example). Interstellar absorption was modeled with the tbabs model in XSPEC, with the abundances set to WILM and cross sections to VERN. For the nsatmos component, we fixed the neutron-star mass to 1.9 M⊙ (Shahbaz et al. 2014) and the distance to 1.2 kpc. The model fits well (χ2 = 145 for 145 degrees of freedom); we obtain an nH of 6.52(1)×1020 cm−2, a neutron-star temperature log(Tnsa; K) = 6.24 ± 0.05, a neutron-star radius of 9.6 ± 1.3 km, and a power-law index of 0.73 ± 0.18. The unabsorbed 0.5–10 keV flux was (1.95 ± 0.10) × 10−11 erg cm−2 s−1 (corresponding to a luminosity of ∼3.4 × 1033 erg s−1 at 1.2 kpc), with the power law contributing ∼50% in the 0.5–10 keV band. This gives a count rate to flux conversion factor of ∼2.6 × 10⁻¹²erg cm−2 cts−1. The power-law index of 0.73 is very low compared to NS LMXBs in a slightly higher luminosity range ( >1034erg s−1; see, e.g., Wijnands et al. 2015; Stoop et al. 2021) where the index is around 2.5, but it is consistent with the lowest values found by Cackett et al. (2010) for Cen X-4. We note that a fit with a single power law does not perform well, yielding χ2 = 246 for 147 degrees of freedom (power-law index of 3.37 ± 0.07 and nH of 2.6(2) × 1020 cm−2).
5. Discussion
5.1. Long-term Optical Monitoring
We have been monitoring the long-term quiescent optical behavior of Cen X-4 for almost 13.5 yr, since 2008 February 14th. After taking into account the modulation due to the companion star, we isolated the accretion activity of the source and observed a linear downward trend followed by a steeper upward trend during quiescence. From the gradual optical brightening detected in the long-term light curve of Cen X-4, Waterval et al. (2020) predicted that Cen X-4 might enter an outburst in the near future. Subsequently, flaring activity of the source was detected both at optical (Saikia et al. 2021; Baglio et al. 2021) and X-ray wavelengths (van den Eijnden et al. 2021b).
The DIM predicts a continuously increasing optical flux during quiescence (Lasota 2001), but observations of both LMXBs and dwarf novae typically show a constant or decreasing flux with time, as we detect for Cen X-4 in our optical monitoring. A very similar behavior was reported for the BH XRB V404 Cyg (Bernardini et al. 2016b), where a 0.1 mag decrease in brightness over ∼2000 days was observed and linked to changes in the accretion rate from year to year (as is likely the case for Cen X-4, too). This decay was then followed by a low-amplitude, relatively fast enhancement of optical emission (0.1 mag increase over ∼1000 days), that was an indication of an increase in the mass accretion rate, which eventually culminated in the 2015 outburst of the source. Other X-ray transient sources where a slow and significant optical rise has been seen together with an outburst include the BH XRBs GS 1354-64 (BW Cir; Koljonen et al. 2016) and Swift J1357.2–0933 (Russell et al. 2018). Similarly, a slow optical rise during quiescence was observed for the BH XRBs H1705–250 and GRS 1124–68 (see Yang et al. 2012 and Wu et al. 2016, respectively; see also Table 1 of Russell et al. 2018 for a summary), although no new outburst has yet been detected for these sources.
Even though on different timescales, an optical precursor to an outburst has recently been observed also for the NS LMXB SAX J1808.4–3658 (Goodwin et al. 2020), that underwent a complete outburst in August 2019. The optical magnitude was observed to fluctuate by ∼1 magnitude for ∼8 days before the proper outburst rise was initiated in the optical. This optical precursor could have several possible origins: an enhanced mass transfer from the companion star, which would then help triggering the outburst; instabilities in the outer disk, which could lead to heating fronts propagating through the entire disk, that would contribute to igniting the outburst; or changes in the pulsar radiation pressure, the compact object being a millisecond pulsar. Similarly, signatures of enhanced optical activity soon before the onset of an outburst have been suggested also for the NS LMXB IGR J00291+5934, whose optical light curve is dominated by flaring and flickering activity prior to the start of an outburst, completely hiding the sinusoidal modulation of the companion star (Baglio et al. 2017).
The optical flux enhancement leading toward the flaring activity observed for Cen X-4 supports the DIM with irradiation and disk evaporation/condensation (Dubus et al. 2001), which explains the evolution of the outburst–quiescence mechanisms at all wavelengths in an X-ray binary. The DIM predicts that, during quiescence, the cold disk accumulates mass from the companion star via Roche lobe overflow, and that causes the gradual brightening of the disk in optical wavelengths (Lasota 2001). Generally, an outburst is expected to occur when the accretion disk reaches a critical density. The disk temperature then increases, causing hydrogen in the disk to ionize. This heating front is propagated through the disk closer to the inner accretion flow, causing enhancement of activity in higher-energy wave bands like X-rays, and the outburst starts.
The gradual brightening of Cen X-4 in quiescence can therefore be explained by matter slowly accumulating in the accretion disk and getting optically brighter. The amount of matter in the disk, increasing year after year, could account for the increasing optical flux that is observed (similarly to what happened for V404 Cyg; Bernardini et al. 2016b). However, for Cen X-4, the optical and X-ray flaring activity did not lead to the ignition of a proper outburst, for reasons that we will discuss in the next sections.
5.2. The Misfired Outburst
5.2.1. Spectral Energy Distribution
In order to shed light on the nature of the misfired outburst, we built SEDs during the period of activity (using Swift/UVOT and REM data obtained on 2021 January 4–5) and during quiescence (using REM and LCO data acquired on 2021 May 22–23). To do so, fluxes were dereddened using the absorption coefficient AV = 0.31 ± 0.16 mag as reported in Russell et al. (2006), and considering the relations of Cardelli et al. (1989) to evaluate the absorption coefficients at all wavelengths. Although the light curves already make it clear that both disk and companion star contribute to the quiescent and flare emission of Cen X-4, we tried to model the two SEDs with a simple irradiated blackbody function, using the known parameters of the companion star (a 0.6 R⊙ radius and a 0.35 M⊙ mass; Shahbaz et al. 1993; Torres et al. 2002; Shahbaz et al. 2014). This of course constitutes a caveat, considering that no multitemperature blackbody of the disk is added to the model; for a more precise determination of the accretion disk contribution, we refer the reader to Section 5.2.2. Since the least-squares fit is insensitive to the irradiation luminosity parameter, we fixed it to the measured X-ray luminosity of LX = 4.5 × 1032 erg s−1 during quiescence (Campana et al. 2004), and to LX = 2.4 × 1033 erg s−1 during the flare, as estimated from Swift observations performed on 2021 January 4 (this work). The results are shown in Figure 7.
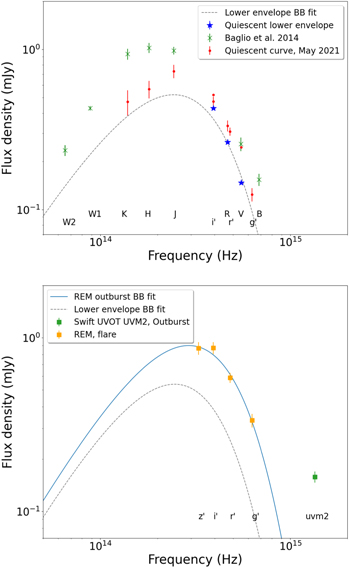
Figure 7. Top: Quiescent dereddened SED of Cen X-4 obtained in 2021 May using REM and LCO data (red dots). Green “x” symbols plot the quiescent curve published in Baglio et al. (2014), for comparison. Blue stars instead represent the fluxes obtained as the average of the lower envelope emission in the long-term monitoring of Cen X-4 during quiescence (Figure 4). Superimposed, we show the fit of the lower envelope emission with a nonirradiated blackbody. Bottom: Average dereddened SED of Cen X-4 during the recent misfired outburst, based on REM strictly simultaneous observations acquired on 2021 January 5 (orange squares) and Swift/UVOT (same date, uvm2 filter; green square). Superimposed, we show the fit of the REM points with an irradiated star blackbody (blue, solid line). A dashed gray line plots the blackbody fit of the quiescent lower envelope (from the top panel), for comparison.
Download figure:
Standard image High-resolution imageThe fit of the quiescent SED obtained with REM and LCO in 2021 May (top panel of Figure 7) gives results comparable to those reported in Baglio et al. (2014), with a blackbody temperature of (4.43 ± 0.01) × 103 K, consistent with a K5V-type star, as expected for Cen X-4 (Shahbaz et al. 1993; Torres et al. 2002). We note, however, that the NIR fluxes that we measure with our REM observations are lower with respect to the cataloged fluxes reported in 2MASS and published in Baglio et al. (2014) (plotted as a gray “x” in Figure 7, upper panel). However, considering that the 2MASS data were acquired in 2001 (and given the long-term trend observed in Figure 1), it is highly probable that the contribution from the accretion disk at optical and NIR frequencies was different in 2021, thus explaining the discrepancy.
In addition, we also plotted in Figure 7 (upper panel) the V, R, and  fluxes obtained as the average emission from the lower envelope of the LCO long monitoring of Cen X-4 (Figure 4). These fluxes are the most constraining upper limits to the companion star contribution. The fluxes are lower with respect to the ones measured in quiescence with LCO by respective factors of 1.7, 1.3, and 1.2 in the V, R, and
  bands. The fit of the three points with a blackbody gives a temperature of (4.13 ± 0.05) × 103 K, still consistent with a late-type star.
The fit of the flare SED (Figure 7, bottom panel) with the irradiated star model gives a blackbody with a higher temperature, T = (4.92 ± 0.03) × 103 K. The UV point during the flare cannot be described by this simplified irradiated star model, suggesting an origin in the inner regions of the multitemperature disk as it heats up, or as reported in Bernardini et al. (2016a) for observations during quiescence, a hot spot on the disk edge. Unfortunately, our data do not make it possible to draw any firm conclusions regarding this.
We then subtracted the blackbody obtained by fitting the lower envelope fluxes from the flare SED. The result is shown in Figure 8. The residual SED peaks below the  band; this suggests a residual component with temperature <5 × 10³ K (according to the Wien displacement law, T = b/λ, where b ∼ 2897 μm K and λ is the wavelength of the peak). It is therefore likely that we are observing the emission from a cold accretion disk, in the build-up for the start of an outburst (we note that, according to the color–magnitude diagram shown in Figure 9, the temperature of the disk at the beginning of the outburst is indeed ∼5 × 10³ K). In Figure 8, the UV excess is also visible.
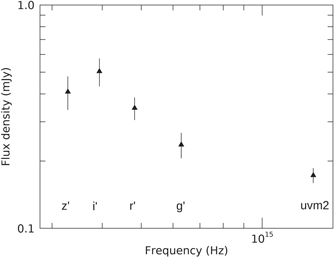
Figure 8. Residual fluxes of Cen X-4 during the misfired outburst after the subtraction of the companion star emission, obtained as the blackbody fit to the lower envelope emission (see Figure 7, upper panel).
Download figure:
Standard image High-resolution image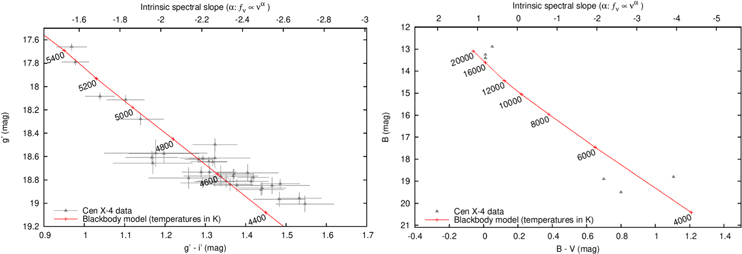
Figure 9. Left: Optical CMD ( vs.
vs.  ) during the misfired outburst of Cen X-4. Bluer colors, corresponding to higher color indices, are to the left, and redder colors, corresponding to lower color indices, are to the right. The blackbody model is plotted with a red solid curve. Different temperature values are also highlighted close to the blackbody line. Right: Optical CMD (B vs. B − V) during the 1979 outburst of Cen X-4. The red solid line represents the blackbody model that best describes the data. Errors on the B-band points are not available in the literature, and therefore are not plotted.
Download figure:
Standard image High-resolution image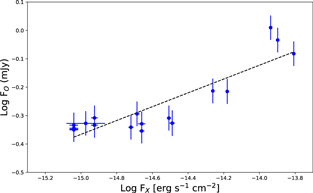
Figure 10. Optical/X-ray correlation during the recent flaring activity with quasi-simultaneous (within 1 hr) LCO i’-band optical data and NICER (0.5–10 keV) X-ray data.
Download figure:
Standard image High-resolution image5.2.2. Color–Magnitude Diagram
We studied the color–magnitude diagram (CMD),  vs.
vs.  , of Cen X-4 using LCO and REM data (Figure 9, left panel) obtained during the misfired outburst. Superimposed, we plot the blackbody model for an accretion disk, which depicts the evolution of a single-temperature, constant-area blackbody that heats up and cools down (for details, see Maitra & Bailyn 2008; Russell et al. 2011; Zhang et al. 2019). In the model, the color changes are determined by the different origins of the emission at optical frequencies: for low temperatures, the Rayleigh–Jeans blackbody tail; for high temperatures, the blackbody curved peak. We note that this model assumes that the flux emitted by the source is all coming from the accretion disk, without any contribution from other sources (like the companion star), whereas the model depicted in Section 5.2.1 is assuming that the irradiated companion star is producing all the flux. Even though it is clear that both star and disk are contributing to the emission of Cen X-4, we consider these tests useful in order to shed light on the different contributions to the emission processes.
We applied the disk model to Cen X-4 following Russell et al. (2011), assuming an optical extinction of AV = (0.31 ± 0.16) mag (Russell et al. 2006), which is used to convert the color g − i into an intrinsic spectral index (indicated on the top axis of Figure 9). The blackbody temperature depends on this color, while the normalization of the model depends on several different parameters, such as the size of the blackbody and the distance to the source. Some of these parameters are uncertain, so we varied the normalization of the model until a satisfactory approximation of the data was reached (see the methods in Maitra & Bailyn 2008; Russell et al. 2011; Zhang et al. 2019; Baglio et al. 2020).
The model approximates the data well, showing a trend that is consistent with a thermal blackbody. We therefore interpret this blackbody as that of the outer accretion disk (the surface area of the star is much smaller than that of the disk). Interestingly, the temperature of the disk remains low during the whole flare, never exceeding ∼5400 K. This is also in agreement with the residual SED during the misfired outburst after the subtraction of the companion star contribution (Figure 8), where we observed a peak below the  band frequency, suggestive of a cold accretion disk (T < 5 × 10³ K).
We note that hydrogen is expected to be completely neutral below 5 × 10³ K (and completely ionized above 104 K; Lasota 2001). It is therefore likely that the temperature required to start the heating wave in the disk, therefore kick-starting a full outburst, was never reached during the 2020/2021 activity. This condition is specific to this “misfired” outburst, as can be appreciated from the right panel of Figure 9, where the CMD (B versus B − V color) of Cen X-4 during the 1979 outburst (plus a few quiescent points) is shown, superimposed on a blackbody model that assumes the same normalization as during the 2020/2021 activity. In this outburst, the accretion disk reached and exceeded the temperature of 10,000 K, thus assuring the complete ionization of hydrogen in the disk, as required by the DIM to have a complete outburst. In particular, the brightest point in the CMD is found near the peak of the 1979 outburst. This shows that the data near the peak of the 1979 outburst are very close to the exact same model used to describe the 2020/2021 activity, thus reinforcing the idea that we witnessed a misfired outburst for Cen X-4 in 2021.
5.2.3. Multiwavelength Correlation
Another tool for disentangling the emission processes and for understanding the nature of the recent misfired outburst is the study of multiwavelength correlations.
We studied the optical/X-ray correlation of the source during its flaring phase, using our LCO detections in the  band and quasi-simultaneous X-ray observations from NICER (taken within 1 hr). For the conversion of X-ray count rate to flux, we use a power-law index of 1.7 ± 0.3 (Bernardini et al. 2013) and the same energy range (0.5–10 keV).
We find a significant correlation between the optical and X-ray emission of the source during the flaring activity (with Pearson correlation coefficient = 0.89 and p-value = 8.2 × 10⁻⁷; see Figure 10). Previously, when the source was in quiescence, Cackett et al. (2013) found no significant correlation between the X-ray and simultaneous optical fluxes, while a positive correlation was observed between the X-ray flux and the simultaneous near-UV flux. Later, Bernardini et al. (2016a) found evidence of optical (V-band), UV, and X-ray correlation at quiescence on various timescales. The correlation slope found for outburst and quiescence had a slope of ∼0.44, showing that irradiation became important at high luminosities, but the slope is shallower than expected for irradiation near quiescence.
We fit the data during the misfired outburst using the orthogonal distance regression method of least squares, and find the slope of the optical/X-ray correlation to be 0.25 ± 0.03, implying that irradiation is not playing a dominant role (the expected slope for an irradiated disk is ∼0.5; van Paradijs & McClintock 1994). The observed slope would instead be more consistent with a viscously heated accretion disk (which can result in a slope ∼0.3, depending on the wavelength and on the compact object nature; Russell et al. 2006), or a combination of both (e.g., ∼0.4 in GRS 1716–249; Saikia et al. 2022). For a viscously heated disk, a wavelength dependency of the optical/X-ray correlation slope has been observed for XRBs (Russell et al. 2006). In order to check for this, we studied the slope of the correlation using the four optical bands available during the misfired outburst ( ,
,  , V, and
  Table 1). Although the different values obtained were within the 1σ error range, we have found a slight trend of increasing slopes with increasing frequency (with values 0.25 ± 0.03 for
  -band, 0.24 ± 0.04 for
  -band, 0.30 ± 0.04 for V-band, and 0.35 ± 0.06 for
  -band). This finding strengthens the argument that the optical emission originates from a viscously heated accretion disk. From the optical/X-ray correlation coefficient, we can rule out the optical emission during the flaring activity having an origin at the synchrotron jet (for which the expected slope is much steeper, i.e., ≥0.7; Russell et al. 2006).
5.3. DIM and Inside-out Outbursts
According to the DIM, when an XRB is in quiescence, its accretion disk is cold and depleted. The mass transfer from the companion star, however, happening at low rates, replenishes the disk until the surface density at a certain annulus becomes sufficiently high to reach the critical density at which thermal equilibrium cannot be maintained. This makes the temperature of the ring increase over the hydrogen ionization temperature, and two different heating fronts begin to propagate inward and outward. Inside-out outbursts are most commonly observed in XRBs (even though the heating fronts still propagate both ways; Menou et al. 2000), because they typically possess low accretion rates (<1016g s−1; van Paradijs 1996; Smak 1984; Menou et al. 1999). Under these conditions, the accumulation time will be longer than the viscous time for diffusion, and matter will not be able to accumulate at the outer edge of the disk, resulting in an inward diffusion. Since the accretion rate decreases with radius, matter will then accumulate at a certain point, until it reaches the critical surface density for the thermal instability, triggering the inside-out outburst (Lasota 2001). Inside-out outbursts typically propagate slowly (Menou et al. 2000); in fact, the outward front encounters regions of higher density while propagating (and also the critical density will be higher for larger radii). If the front is not transporting enough matter to raise the density at a certain radius above the critical density, the propagation will stall, and a cooling wave (propagating inward) will be generated, which will prevent the outburst from occurring. Interestingly, a similar interpretation has also been given for the so-called failed-transition outbursts, i.e., outbursts that do not reach the high/soft state (Alabarta et al. 2021). LMXBs are typically subject to strong irradiation, which is important to take into account in the DIM (Dubus et al. 2001; see also Tetarenko et al. 2018, where actual data were used to test the DIM with irradiation). Irradiation has no effect on the structure of the heating front, but it is important in order to determine how long the outward heating front will be able to propagate. In fact, with the propagation of the inside-out front, the mass accretion rate at the inner disk radius rises, therefore increasing the irradiation of the outer cold disk. As a consequence, the external disk is heated, which reduces the critical density needed to undergo the thermal instability, making the outward front propagation easier.
We estimate the mass accretion rate  of Cen X-4 during the misfired outburst using our X-ray monitoring. We integrated the count rates over the entire outburst, and we converted it to flux, using the count rate to flux conversion factor obtained from the spectral fit in Section 4.2.2. We calculate the luminosity considering a distance of 1.2 kpc. Using
 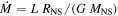 (where L is the X-ray luminosity, RNS and MNS are the typical radius and mass of a neutron star, and G is the gravitational constant; we note that we are assuming that all X-rays are due to accretion), and including an efficiency factor of 20% in converting gravitational energy into luminosity (Frank et al. 1987), we estimate a mass accretion rate of ∼1.5 × 10¹³ g s−1, which is considerably lower than the critical mass accretion rate that needs to be achieved in order to have outside-in outbursts
20
(considering Cen X-4 orbital parameters,
(where L is the X-ray luminosity, RNS and MNS are the typical radius and mass of a neutron star, and G is the gravitational constant; we note that we are assuming that all X-rays are due to accretion), and including an efficiency factor of 20% in converting gravitational energy into luminosity (Frank et al. 1987), we estimate a mass accretion rate of ∼1.5 × 10¹³ g s−1, which is considerably lower than the critical mass accretion rate that needs to be achieved in order to have outside-in outbursts
20
(considering Cen X-4 orbital parameters,  g s−1; Lasota 2001). Therefore, it is likely that an inside-out propagation front was ignited close to the inner radius of the accretion disk. At the time of the ignition, the temperature of the accretion disk according to the modeling of the CMD (Figure 9) was ∼5.4 × 10³ K. However, instead of an increasing temperature of the disk, what we observe in Figure 9 is a temperature that decreases with time, from ∼5.4 × 10³ K to ∼4.4 × 10³ K and lower. In addition, the slope of the X-ray/optical correlation shows a scarce role of irradiation in the emission from the system, in agreement with previous studies performed during quiescence (see, e.g., D’Avanzo et al. 2006), likely due to the very low mass accretion rate and to the large size of the system. It is possible that, once the front started to propagate outward, some irradiation was actually taking place, but the effect was low compared to all the other sources of emission in the optical (e.g., the companion star and the steady outer accretion disk, which emits in the optical). The overall optical emission would therefore dilute the effect of irradiation, explaining the shallow slope of the optical–X-ray correlation. In addition, among the known XRBs in the literature, Cen X-4 has one of the larger accretion discs, due to its long orbital period (∼15.1 hr), which could explain the low level of irradiation to which the external accretion disk is exposed.
We therefore conclude that the propagation of the outward front has likely stalled soon after ignition, due to the low mass accretion rate and low effect of the irradiation, the latter of which is also linked to the known large size of the system. We note that the steep, short (∼8–9 days) decay phase after the misfired outburst peak is in agreement with the low level of irradiation that we observe in this work. In fact, the cooling front that is generated after the stall can only propagate if it finds a cold branch to fall onto (Lasota 2001); this is hampered by the effect of irradiation, which could keep the accretion disk hot, giving rise to the exponential and linear decay that is typically observed in strongly irradiated XRBs.
The factors that might have led to a misfired outburst are numerous. Among them, the size of the system surely makes a contribution, reducing the effect of irradiation and therefore facilitating the stall of the heating front propagation. We therefore predict that the larger the system is, the more likely it is for similar events to occur.
Alternatively, as also suggested for the optical precursor to the 2019 outburst of the accreting millisecond X-ray pulsar SAX J1808.4-3658 (Goodwin et al. 2020), the misfired outburst of Cen X-4 could have been caused by a local thermal instability at a radius close to the inner radius of the disk, where the density was close to the critical density at which the trigger of the full outburst could begin (e.g., Menou et al. 2000, Figure 7). This interpretation could work for Cen X-4, considering that the temperature in the disk has always remained below 6 × 10³ K (i.e., the temperature of hydrogen ionization). Had the full outburst actually started for Cen X–4, the misfired outburst described in this work would therefore have been its precursor.
6. Conclusions
In this work, we report on the long-term optical monitoring of the neutron star low-mass X-ray binary Cen X-4 during the past 13.5 yr. The source spent the majority of this time in quiescence; the ellipsoidal modulation due to the companion star emission can be isolated, together with several short-timescale variations in all optical bands, likely due to activity in the accretion disk. Once the flares and the ellipsoidal modulation from the star are subtracted, the residual flux shows a linear downward trend spanning ∼3000 days, followed by an upward trend for about 1000 days, ∼7 times steeper than the downward one. In the case of the black hole X-ray binary V404 Cyg (Bernardini et al. 2016b), a similar upward trend of the flux preceded the start of an outburst in 2015. However, although a significant brightening was observed at the beginning of 2021 at all wavelengths (NIR–X-rays), a proper outburst was not triggered in the case of Cen X-4, which returned to quiescence a few weeks after the start of this enhanced activity. We term this behavior a “misfired outburst,” because the temperature required to ionize hydrogen and initiate the outburst, was not reached. The modeling of the color–magnitude diagram during the misfired outburst with a single-temperature blackbody shows an accretion disk with temperatures below 5.4 × 10³ K; this result is in agreement with the residual spectral energy distribution, after the subtraction of the contribution from the companion star, and suggests that the accretion disk never reached the temperature that is required to ionize hydrogen (in contrast to what happened during the 1979 full outburst of the source, when, according to our model, the accretion disk reached temperatures of ∼2 × 10⁴ K, where hydrogen is typically completely ionized).
A possible interpretation of this is that an inside-out type outburst was initiated. Inside-out outbursts typically propagate slowly, because the heating front meets regions of higher density while propagating outward. If the front is not transporting enough matter, it will stall unless irradiation is strong enough to heat the external disk, therefore decreasing the surface density and facilitating the propagation. However, irradiation is scarce in Cen X-4. In fact, the optical/X-ray correlation during the misfired outburst has a shallow slope, inconsistent with a strongly irradiated disk; moreover, it was already reported in the past (see, e.g., D’Avanzo et al. 2006) that the effects of irradiation are low in Cen X-4, consistent with the large size of the system. It is therefore likely that the heating front was halted soon after its ignition, with a consequent production of an opposite cooling front, which switched off the outburst. Alternatively, the observed activity could be the result of a local thermal–viscous instability in the disk, where temperatures increased but did not reach (and overcome) the temperature for hydrogen ionization. The optical monitoring of Cen X-4 is still ongoing, and will show whether a new misfired or full outburst might happen in the future, thus shedding further light on the possible mechanisms preventing a complete outburst to be triggered.
We thank the anonymous referee for useful comments and suggestions. This research has made use of data and/or software provided by the High Energy Astrophysics Science Archive Research Center (HEASARC), which is a service of the Astrophysics Science Division at NASA/GSFC. This work is also based on observations made with the REM Telescope, INAF Chile, and makes use of observations performed with the Las Cumbres Observatory network of telescopes. D.M.R. and D.M.B. acknowledge the support of the NYU Abu Dhabi Research Enhancement Fund under grant RE124. J.H. acknowledges support for this work from the NICER Guest Investigator program under NASA grant 80NSSC21K0662. We thank the Swift and NICER teams for rapidly approving, scheduling, and performing the X-ray observations. S.C. and P.D.A. acknowledge support from ASI grant I/004/11/5. J.v.d.E. is supported by a Junior Research Fellowship awarded by St. Hilda’s College, Oxford. N.M. acknowledges the ASI financial/programmatic support via the ASI-INAF agreement n. 2017-14-H.0 and the INAF Mainstream–project on the same subject. T.M.D. acknowledges support from the Spanish ministry of science under grant EUR2021-122010. T.M.D. acknowledges support from the Consejeria de Economia, Conocimiento y Empleo del Gobierno de Canarias and the European Regional Development Fund under grant ProID2020-010104.
Footnotes
- 16
- 17
- 18
IRAF is distributed by the National Optical Astronomy Observatory, which is operated by the Association of Universities for Research in Astronomy, Inc., under cooperative agreement with the National Science Foundation.
- 19
- 20
Even at the maximum X-ray flux during the misfired outburst,
 only reached 5 × 10¹⁵g s−1, ∼2 orders of magnitude lower than the critical mass accretion rate.
