Abstract
We present the first spatially resolved study of molecular gas in the vicinity of a gamma-ray burst (GRB), using CO(2−1) emission-line observations with the Atacama Large Millimetre Array at ∼50 pc scales. The host galaxy of GRB 980425 contains a ring of high column density H i gas, which is likely to have formed due to a collision between the GRB host and its companion galaxy, within which the GRB is located. We detect 11 molecular gas clumps in the galaxy, 7 of which are within the gas ring. The clump closest to the GRB position is at a projected separation of ∼280 pc. Although it is plausible that the GRB progenitor was ejected from clusters formed in this clump, we argue that the in situ formation of the GRB progenitor is the most likely scenario. We measure the molecular gas masses of the clumps and find them to be sufficient for forming massive star clusters. The molecular gas depletion times of the clumps show a variation of ∼2 dex, comparable with the large variation in depletion times found in starburst galaxies in the nearby universe. This demonstrates the presence of starburst modes of star formation on local scales in the galaxy, even while the galaxy as a whole cannot be categorized as a starburst based on its global properties. Our findings suggest that the progenitor of GRB 9802425 was originated in a young massive star cluster formed in the starburst mode of star formation.
1. Introduction
The life cycle of young, massive stars ends with violent explosions that are categorized into several populations based on the properties of the resulting emission. Long-duration gamma-ray bursts (GRBs) are among the brightest of these explosions, with powerful energy releases that make them detectable back to when the first stars and galaxies were formed (z ≳ 8, Tanvir et al. 2009). Their extreme emissions, their localizations within active star-forming regions (e.g., Fruchter et al. 2006), and the discovery of a number of them in association with broad-lined supernovae type Ic (SNe Ic-BL, see Hjorth & Bloom 2012, and references therein) strengthens the link between their progenitors and massive stars. However, the physical properties of the stellar population that gives rise to these explosions and the interstellar medium (ISM) conditions in which they form remain poorly constrained. Detailed studies of the host galaxies of these bright events, and identifying the factors that distinguish the host galaxies from the general star-forming galaxy population can provide valuable insights into addressing these unknowns.
Extensive studies of GRB hosts over the last couple of decades demonstrate a dichotomy between their hosts and the general star-forming galaxy population, especially at low redshifts (e.g., Savaglio et al. 2009; Castro Cerón et al. 2010; Krühler et al. 2015; Schulze et al. 2015; Perley et al. 2016; but see also Greiner et al. 2015; Arabsalmani et al. 2018b). The typical low mass and metallicities of GRB host galaxies have been the most noted distinguishing characteristics. These have been the basis of the paradigm where low metallicities are required for formation of GRBs and their progenitors (e.g., Nuza et al. 2007; Wolf & Podsiadlowski 2007; Perley et al. 2016; Vergani et al. 2017, but see also Kocevski et al. 2009 and Campisi et al. 2011). The low metallicities of the host galaxies have also been long interpreted as supporting evidence for progenitor models which require very metal-poor stars (for such a model see e.g., Yoon et al. 2006), failing to take into account the fact that the host metallicities are much higher than the very low metallicities required by those models. However, the detection of a significant fraction of GRBs in metal-rich host galaxies (e.g., Levesque et al. 2010; Elliott et al. 2013; Perley et al. 2013; Krühler et al. 2015; Valeev et al. 2019; also in which metal-poor stars cannot form) shows that low metallicity is unlikely to be a requirement for their formation.
The content and structure of molecular gas, the fuel of star formation, and also the efficiency of star formation in the host galaxies, are potentially important factors which have not been discussed extensively in the literature. The first few studies of the molecular gas content in GRB host galaxies reported a puzzling deficit of molecular gas in the hosts (Hatsukade et al. 2014; Stanway et al. 2015; Michałowski et al. 2016). Arabsalmani et al. (2018a) argued that this deficit was the result of improper comparisons or having assumed too low a CO-to-molecular-gas conversion factor for the low-metallicity host galaxies. In a recent study Hatsukade et al. (2020) presented the galaxy-scale properties of molecular gas for 14 GRB host galaxies and found them to follow the same molecular gas scaling relations as the general star-forming galaxy population. They also showed that most of the hosts at z ≲ 1 have somewhat higher molecular gas fractions and/or shorter molecular gas depletion times. High gas fractions, typically found in star-forming galaxies at z ≳ 1.5 (e.g., Daddi et al. 2010; Santini et al. 2014), are thought to allow for the fast collapse of large amounts of gas due to gravitational instability and result in the formation of massive and dense molecular clouds in which massive star clusters can form (Dessauges-Zavadsky & Adamo 2018).
The typical high star formation rate (SFR) surface densities and high specific star formation rates (sSFRs) of low redshift GRB hosts reported by Kelly et al. (2014) suggest the presence of starburst mode of star formation, in which formation of massive star clusters are favored. Formation of GRB progenitors in massive star clusters is compatible with the progenitor models that involve interacting massive stars in young and dense star clusters (e.g., Portegies Zwart & van den Heuvel 2007; Pan et al. 2012; van den Heuvel & Portegies Zwart 2013; Chrimes et al. 2020). While the galaxy-scale studies of GRB hosts indicate that they contain dense regions with starburst mode of star formation, spatially resolved studies of molecular gas in the host galaxies are required to investigate whether such regions are present in the vicinities of the GRBs. Note that the gas mass in cloud scales (less than a few hundreds pc) is dominated by molecular gas, and hence measurements of the molecular gas surface densities and depletion times in the explosion sites can reveal whether the progenitors were formed in the starburst mode of star formation. Spatially resolved studies are especially important in cases where internal/external effects cause local starburst conditions, without significantly impacting the global properties of the host galaxies.
Here we present the first spatially resolved study of molecular gas and its depletion time in a GRB host galaxy. ESO 184–G82 at z = 0.0086 is the host galaxy of the closest known GRB, GRB 980425, one of the first GRBs discovered in association with a SNe IC-BL (SN1998bw, Galama et al. 1998). It is consequently one of the best-studied host galaxies (e.g., Fynbo et al. 2000; Hammer et al. 2006; Christensen et al. 2008; Le Floc’h et al. 2012; Arabsalmani et al. 2015; Krühler et al. 2017). With a stellar mass of 108.7 M⊙ (Michałowski et al. 2014) and a SFR of 0.22  (based on
  emission line and corrected for dust extinction, Krühler et al. 2017), ESO 184–G82 is on the main sequence relation in the M*–SFR plane (with a sSFR of 0.44 Gyr−1; see Brinchmann et al. 2004). Michałowski et al. (2018) performed Atacama Pathfinder EXperiment observations of this GRB host and obtained a brightness temperature luminosity of
  K km s−1 pc2 for its CO(2−1) emission line. From this we calculate a molecular gas mass of
  for ESO 184–G82 (see Section 3 for assumptions used when converting the
  to molecular gas mass), similar to those of nearby galaxies with similar stellar masses (see Figure 5 of Grossi et al. 2016).
With an atomic gas mass of  , obtained from H i 21 cm emission-line observation (Arabsalmani et al. 2015), ESO 184–G82 has a total gas (atomic+molecular) fraction of ∼2, and a total gas depletion time of ∼5 Gyr, larger than the typical depletion times of starburst galaxies in the nearby universe (see Figure 5 of Kennicutt 1998). In fact the gas and star formation surface densities of ESO 184–G82,
  and
and  , place it among the non-starbursting galaxies in the Kennicutt–Schmidt relation (see Figure 2 of Kennicutt 1998, and Figure 6 of de los Reyes & Kennicutt 2019). The surface densities are corrected for the inclination angle of 50° (Christensen et al. 2008) and are averaged over the half-light radius of ESO 184–G82 (4 kpc at R-band, Michałowski et al. 2014). Since the depletion time characterizes how fast the galactic gas reservoir would be depleted by star formation (at a given SFR), it must encompass both the currently star-forming material and the non-star-forming gas. Therefore, the total (atomic+molecular) gas should be taken into account when evaluating the galactic-wide star formation regime. This is especially important in the case of star-forming dwarfs where atomic gas forms a significant fraction of (or even dominates) the total gas mass. Lee et al. (2009) used the equivalent width of
  emission line (
 ) and showed that starburst dwarf galaxies can be robustly classified to have
  100 Å. The
  of ESO 184–G82(56.0 Å, Krühler et al. 2017) thus further excludes the galaxy from being among the starburst dwarfs. It is therefore clear that the galaxy-scale properties of ESO 184–G82 do not show any evidence whatsoever for the presence of global starburst mode of star formation in the galaxy.
The H i 21 cm mapping of ESO 184–G82 identified a companion galaxy about 12 kpc from it, and also showed the presence of a high column density gas ring in ESO 184–G82 within which actively star-forming regions and the GRB reside (Arabsalmani et al. 2015, 2019b). Through multiwavelength observations and simulations, Arabsalmani et al. (2019b) demonstrated that a collision between the GRB host and its companion has given rise to the formation of the dense gas ring and has resulted in the enhancement of star formation in the ring, where the GRB progenitor was formed. In order to identify the properties of molecular gas in this interesting system and to investigate the ISM conditions in the vicinity of the GRB, we present the Atacama Large Millimetre Array (ALMA) observations of molecular gas at ∼50 pc scales in the metal-poor ( ) host galaxy of GRB 980425. We describe the details of observations and data reduction in Section 2. The measurements and results are presented in Section 3. A detailed discussion and the interpretations of results are given in Section 4. We summarize our findings in Section 5.
2. Observations and Data Analysis
2.1. ALMA
We used the Band-6 receivers of the ALMA 12 m Array in C43-5 configuration (with a maximum baseline of 1400 m) to map the CO(2−1) emission of ESO 184–G82 on 2018 November 16 (project code: 2018.1.01750.S; PI: Arabsalmani). The maximum recoverable scale for this configuration is 67, allowing the diffuse CO emission to be recovered on scales smaller than ∼1.2 kpc (projected) at the distance of the galaxy (37.3 Mpc using a flat ΛCDM with cosmological parameters from Planck Collaboration et al. 2018). The observations were for a total time of 5 hr and were conducted with a high-spectral-resolution frequency-division mode spectral window centered on 228.534 GHz, covering the redshifted CO(2−1) emission line with a usable bandwidth of 1.875 GHz. This spectral window was sub-divided into 1920 channels, yielding a velocity resolution of ∼1.3 km s−1, and a total velocity coverage of ∼2460 km s−1. The primary beam was centered on the GRB position (see Wieringa et al. 1998, for determination of the GRB position with an error of 0
1).
The data are calibrated using the ALMA Science Pipeline, part of the Common Astronomy Software Applications (casa) package (McMullin et al. 2007). We then image the data using the casa task tclean and produce a spectral cube with a velocity resolution of ∼3 km s−1. With Briggs weighting with robust = 0.5, we get a synthesized beam size of 035 × 0
25 (62 pc × 44 pc at the distance of the galaxy), and a root-mean-square (rms) noise of ∼0.4 mJy/beam/channel close to the central frequency of the cube where we expect the line. Due to the primary beam correction applied to the cube, the rms noise in regions close the edges of the primary beam increases to ∼0.6 mJy/beam/channel.
We obtain the total-intensity and intensity-weighted velocity field maps of the CO(2−1) emission line using the MOMNT task in “classic” AIPS (Greisen 2003). The MOMNT task creates a mask to apply to the spectral cube by smoothing the emission along both the spatial and velocity axes, and then applying a flux threshold to the smoothed emission. This mask is used to choose the pixels in the spectral cube to be integrated for creating the moment maps, thereby ensuring that localized noise peaks are ignored and only true emission that is correlated both spatially and along the velocity axis is selected. To create the mask we choose a Gaussian kernel of full width at half-maximum (FWHM) equal to six pixels for smoothing the emission spatially, Hanning smoothing across blocks of three consecutive velocity channels, and choose a threshold flux of approximately 2 times the rms noise in a line-free channel of the spectral cube.
We also make a continuum image combining the frequency windows of 227.7–228.5 GHz and 228.7–229.4 GHz. The continuum emission is detected in only one region, centered at R.A. = 19h35m03073 and decl. = −52d50m40
72, corresponding to the H ii region located about 800 pc to the northwest of the GRB position (see Section 4 for details). We measured an integrated flux of 0.197 ± 0.064 mJy for the continuum in this region using the imfit task in the casa package. The measured flux is consistent with the Spectral Energy Distribution presented in Michałowski et al. (2014).
2.2. Ancillary Data
We use an Hubble Space Telescope (HST) image of ESO 184–G82, obtained with the MIRVIS/Clear filter centered at 5737.453 Å on 2000 June 25 with a total exposure time of 700 s (Program ID: GO-8648, PI: Kirshner). This image, previously presented in Kouveliotou et al. (2004), was aligned and combined using drizzle, with a plate scale of 0025 per pixel (approximately half the native plate scale). The astrometric alignment was subsequently refined using the Gaia catalog, with typical uncertainties of 0
025. We also obtain archival Integral Field Unit (IFU) observations of ESO 184–G82 done using the MUSE instrument on the Very Large Telescope on 2015 May 16 (Program ID: 095.D-0172(A); PI: Kuncarayakti). These data have a spatial resolution of ∼0
84 (equivalent to ∼150 pc in projected distance), and are already presented in Krühler et al. (2017). We use the processed MUSE data cubes from the ESO-advanced data products (Program ID: 095.D-0172(A)) and apply the astrometric alignment using the Gaia catalog (with typical uncertainties of 0
2, the pixel size in the MUSE cube).We then make the total-intensity map of the
 emission line using the immoment task in the casa package.
3. Measurements and Results
The contours of CO(2−1) emission overlayed on the HST image of ESO 184–G82, in the region covered by the primary beam of ALMA in band-6, are shown in the right panel of Figure 1. These mark the regions with significant emission, belonging to molecular gas complexes. The spatial resolution of the ALMA observations allows for the identification of distinct components in these gas complexes. Given the size of the synthesized beam of our ALMA observations (62 pc × 44 pc), each of these components can potentially contain a number of distinct sub-structures which we refer to as clumps.
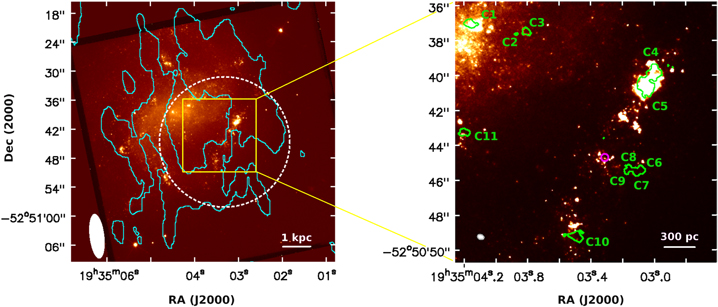
Figure 1. Left: the HST image of the GRB host galaxy obtained with the MIRVIS/Clear filter, overlayed with the contour (in cyan) of H i 21 cm total-intensity (see Arabsalmani et al. 2019b). The H i contour is at a column density of  (3σ significance) and marks the ring-like structure of high column density atomic gas in the galaxy. The synthesized beam of the H i 21 cm observations is shown in the bottom-left corner (for details see Arabsalmani et al. 2019b). The dashed circle shows the primary beam of ALMA in band-6, centered on the GRB position. The yellow box shows the frame of the panel to right. Right: contours of CO(2−1) emission at 4σ significance obtained from ALMA observations, overlayed on the HST image. C1 to C11 mark the identified molecular gas clumps. The GRB position is marked with a magenta circle. The synthesized beam of ALMA is shown in the bottom-left corner.
Download figure:
Standard image High-resolution imageIn order to identify the clumps, we identify the local peaks of emission in the moment-0 (total-intensity) map of CO(2−1) emission line that are separated by at least one synthesized beam. These are the pixels with flux densities larger than all the neighboring pixels within a synthesized beam. Note that we use the moment-0 map to identify emission peaks and not the cube itself, given that the signal-to-noise of the observation is not very high, and the fact that the moment maps were created in such a way (see Section 2.1) that localized noise peaks are ignored and only true emission peaks are picked up. We identify the area associated with each of the local peaks using the moment-0 map. For adjacent clumps within the same complex, we use the contours of emission to identify the line of minima between the two clumps and separate the regions accordingly. We then use the data cube and investigate the significance of the emission in the associated areas. If the emission in the region is detected in at least two adjacent channels, and with a total significance of at least 5σ, we identify it as a clump. Otherwise we discard the region. Furthermore, we look at the position–velocity diagram of each of the identified clumps and search for sub-structures that might be spatially coincident, but kinematically distinguishable. Such a search, however, did not reveal any such structure in any of the gas clumps.
Using the above mentioned method, we identify a total of eleven molecular gas clumps in the galaxy, marked by C1 to C11 in the right panel of Figure 1. These clumps are clearly visible in the CO(2−1) total-intensity maps presented in Figure 2. Seven of these gas clumps (C4–C10) are within the H i gas ring (see the left panel of Figure 1) which was identified through H i 21 cm emission observations presented in Arabsalmani et al. (2019b). The other four gas clumps are located in the central regions of the galaxy.
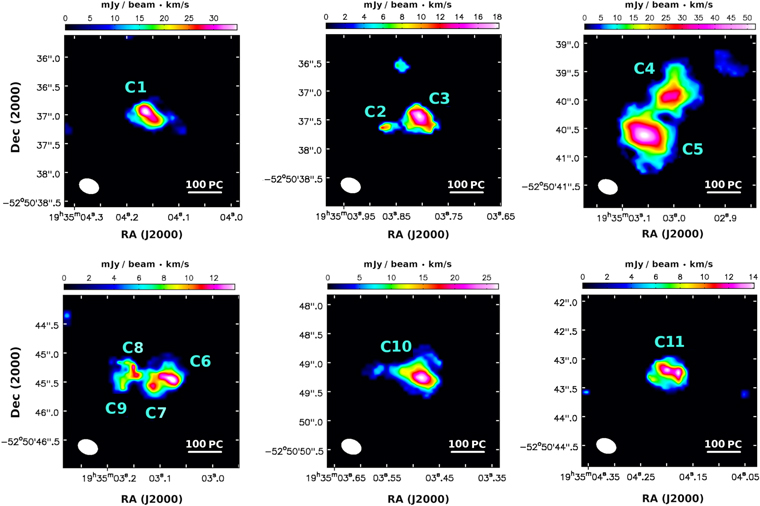
Figure 2. The total-intensity maps of CO(2−1) emission line, showing the eleven identified gas clumps (see Figure 1 for the location of the clumps in the galaxy). The colorbars show the integrated intensity of CO(2−1) per beam in each clump.
Download figure:
Standard image High-resolution imageThe spectra of CO(2−1) emission line for the eleven identified molecular clumps are shown in Figure 3. We measure the integrated flux density of CO(2−1) emission line (S dv) by integrating over the adjacent channels with fluxes above the rms noise, and obtain the brightness temperature luminosity of the CO(2−1) emission line ( ) for each of the clumps. The significance of detection for each clump is calculated by dividing the total flux by
  rms-noise-per-channel, where N is the number of adjacent channels with fluxes above the rms noise. We find that the clumps in ESO 184–G82 on average have higher
  values than clumps in nearby compact and starburst dwarfs (see for e.g., Taylor et al. 1999; Walter et al. 2001; Leroy et al. 2006, for molecular gas studies of nearby dwarf galaxies based on observations with similar spectral and spatial resolutions to our ALMA observations presented in this paper).
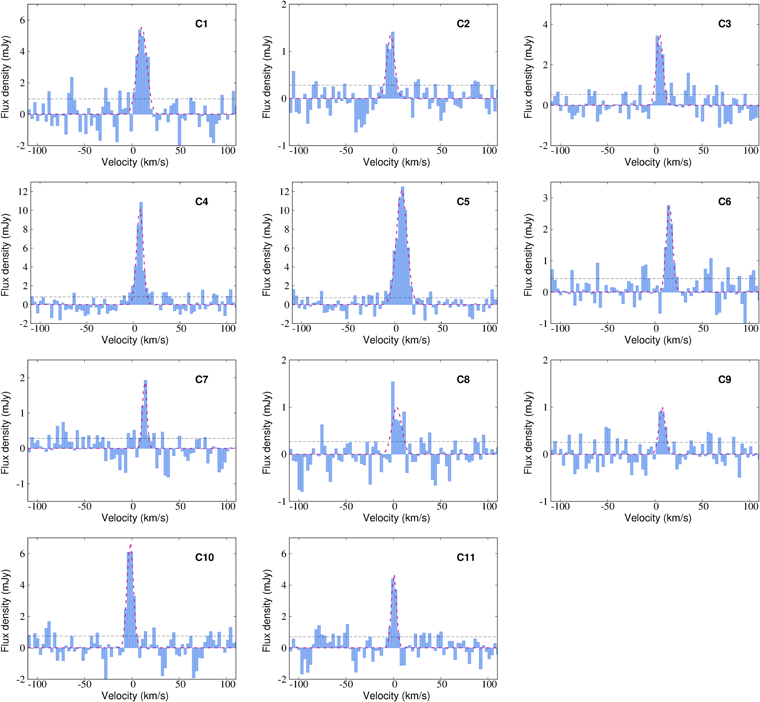
Figure 3. The CO(2−1) spectra of the eleven identified molecular gas clumps in ESO 184–G82. The x-axis shows the velocity with respect to z = 0.0086, the redshift of the galaxy obtained from the H i spectrum (Arabsalmani et al. 2015). The best-fitted Gaussian functions are shown with red dashed lines. The rms noise level in each spectrum is marked by a black dashed line. Note the different scales on the y-axis in different panels.
Download figure:
Standard image High-resolution imageTo measure the velocity dispersions, we find the maximum value in the moment-2 map, σv, for each clump and correct it for the spectral resolution of the cube. We then convert it to the FWHM velocity, FWHM (see Rosolowsky & Leroy 2006). We also fit Gaussian functions to the spectra of all the clumps (see Figure 3) and obtain the FWHM of the fitted Gaussians, FWHMGauss, also corrected for the spectral resolution of the cube. The FWHM values measured from both methods for the clumps are listed in Table 1. We find the two measurements to be consistent for all the clumps but C2. This might indicate the presence of kinematically distinct sub-structures in C2, which we can not distinguish given the spectral resolution of our observations.
Table 1. Properties of Molecular Gas Clumps in ESO 184–G82
| Clump | S/N | S dv |

|
FWHM
|
FWHM
|
Mmol | SFR | τdep |
|---|---|---|---|---|---|---|---|---|
| (mJy km s−1) | (K km s−1 pc2) | (km s−1) | (km s−1) | (105 M⊙) | ( ) ) |
(Gyr) | ||
| C1 | 10 | 68.4 ± 7.1 | 5.7 × 10⁴ | 11 | 12 | 9–28 | 1.4 | 0.6–2.0 |
| C2 | 7 | 12.1 ± 1.7 | 1.0 × 10⁴ | <3 | 9 | 2–5 | 0.1 | 5.8–19.3 |
| C3 | 9 | 28.6 ± 3.2 | 2.4 × 10⁴ | 6 | 8 | 4–12 | ||
| C4 | 14 | 102.5 ± 7.3 | 8.5 × 10⁴ | 11 | 8 | 13–43 | 45.1 | 0.08–0.26 |
| C5 | 26 | 177.6 ± 6.9 | 14.7 × 10⁴ | 16 | 13 | 22–74 | ||
| C6 | 8 | 23.1 ± 2.8 | 1.9 × 10⁴ | 7 | 7 | 3–10 | 0.36 | 2.1–7.0 |
| C7 | 7 | 11.2 ± 1.7 | 0.9 × 10⁴ | 5 | 4 | 1–5 | ||
| C8 | 8 | 13.4 ± 1.8 | 1.1 × 10⁴ | 13 | 12 | 2–6 | ||
| C9 | 5 | 7.9 ± 1.5 | 0.7 × 10⁴ | 7 | 7 | 1–3 | ||
| C10 | 11 | 55.8 ± 5.0 | 4.6 × 10⁴ | 9 | 9 | 7–23 | 0.4 | 1.8–5.9 |
| C11 | 7 | 30.7 ± 4.1 | 2.6 × 10⁴ | 4 | 5 | 4–13 | 0.2 | 1.8–5.8 |
Note. Columns: (1) clump identifier, (2) significance of the detection, (3) integrated flux density of CO(2−1) emission line, (4) brightness temperature luminosity of CO(2−1) emission line, (5), (6) the velocity dispersion measured from the moment-2 maps and Gaussian fitting, respectively, corrected for the spectral resolution, (7) estimated molecular gas mass for the molecular gas clump, assuming a range of  , (8) star formation rate of the gas complex, and (9) molecular gas depletion time of the gas complex.
Download table as: ASCIITypeset image
In order to measure the sizes of the clumps, we fit 2D-Gaussian functions to the moment-0 maps of the clumps and correct the measured standard deviations of the Gaussians for the spatial resolution of the observations by deconvolving the synthesized beam from the measured values. We find the deconvoled values to be comparable to or smaller than the major axis (and in some cases the minor axis) of the synthesized beam (≲44–62 pc). The size measurements are therefore not reliable and hence we do not report these measurements. Deeper observations with better spatial resolution are required in order to measure the sizes of the molecular clumps in ESO 184–G82.
To estimate the molecular gas masses of the clumps we need to adopt a CO-to-molecular-gas conversion factor, αCO. Extensive studies have shown that αCO increases with decreasing metallicity, especially below ∼0.5 Z⊙ (see for a review on αCO Bolatto et al. 2013, and the references therein). The values of αCO at low metallicities has been determined with a large scatter (more than an order of magnitude) based on both observations and theoretical models (see Figure 9 in Bolatto et al. 2013). In addition to this, the significant uncertainty on the emission-line metallicity measurements due to the choice of calibration (see Kewley et al. 2019, and references therein) makes it even harder to measure molecular gas mass with precision using CO emission. Christensen et al. (2008) and Krühler et al. (2017) used the IFU observations of ESO 184–G82 and obtained the metallicity maps of the galaxy. While both studies found the metallicity spread within the galaxy to be ∼0.3 dex, they reported different values in each region of the galaxy depending on the adopted calibration (see for e.g., the variation in the metallicity measurements at the position of GRB in Table 1 of Krühler et al. 2017). We therefore adopt a full metallicity range of 0.28–0.44 Z⊙ reported by Krühler et al. (2017) for the average metallicity of the galaxy and estimate the molecular gas mass of all the clumps over this metallicity range. Note that this range also covers the measurements provided by Christensen et al. (2008). Within this metallicity range, we adopt the metallicity-dependent αCO suggested by Wolfire et al. (2010) which provides one of the better fits to the estimated values of the conversion factor from observations (Bolatto et al. 2013). We therefore use a range of  for estimating the molecular gas masses of all the clumps in our analysis. We also assume a ratio of 0.8 for the brightness temperature luminosity of the CO(2−1) to CO(1−0) lines, which is the typical value derived for nearby star-forming galaxies (Leroy et al. 2009). Note that the uncertainty on the ratio of the luminosity temperatures of the CO(2−1) to CO(1−0) lines is expected to be small in comparison to that on the αCO conversion factor. This ratio is also shown not to be much sensitive to CO excitation conditions (see Daddi et al. 2015, and references therein). The measured properties of the eleven clumps are summarized in Table 1.
We are unable to determine the surface densities of the clumps due to the insufficient spatial resolution of our ALMA observations. But we use the MUSE observations to measure the SFR and compute the molecular gas depletion time (τdep, defined as the ratio of molecular gas mass to the SFR) for the gas clumps. The right panel of Figure 4 shows the total-intensity map of the  emission line in the same frame as the right panel of Figure 1. The CO contours overlayed on the
  map mark the locations of the molecular gas clumps with respect to the star-forming regions. Given the coarser spatial resolution of MUSE observations (∼0
85 compared to ∼0
3 resolution of the ALMA observations), we obtain SFR and τdep for each of the gas complexes (instead of measuring it for the 11 individual clumps). This ensures that the SFR measurements are done within regions that have comparable or larger sizes with respect to the spatial resolution of the MUSE cube (∼150 pc). The measurements are done in regions that are identified by the CO emission and irrespective of the locations of the
 peaks. We calculate the total flux in all the pixels of the
  map within the identified region for each of the gas complexes and compute the SFR associated with the gas complexes using the calibration of Kennicutt (1998), assuming a Salpeter initial mass function (IMF). With a galaxy-averaged attenuation of
  of 0.05 mag for ESO 184–G82 and a similar foreground Galactic extinction (Krühler et al. 2017), the SFR correction for dust extinction will be insignificant, and hence we do not apply such a correction. The SFR and τdep measurements for the gas complexes are presented in columns 8 and 9 of Table 1.
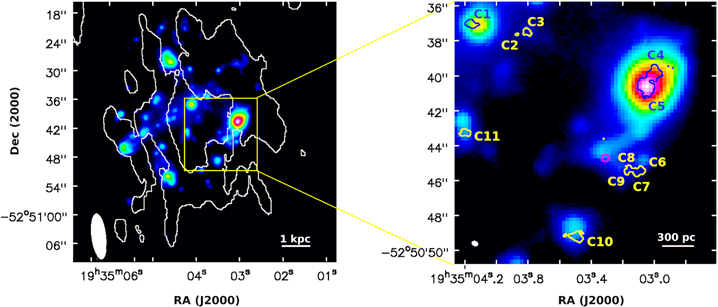
Figure 4. Left: the total-intensity map of the  emission line (made using the MUSE cube) from ESO 184–G82 overlayed with the contour (in white) of H i 21 cm total-intensity (see Arabsalmani et al. 2019b). The H i contour is at a column density of
  (3σ significance) and marks the ring-like structure of high column density atomic gas in the galaxy. The synthesized beam of the H i 21 cm observations is shown in the bottom-left corner (for details see Arabsalmani et al. 2019b). The yellow box shows the frame of the panel to right. Right: the total-intensity map of the
  emission line (made using the MUSE cube) in the same frame as the right panel of Figure 1, overlaid with the contours of CO(2−1) emission at 4σ significance. C1–C11 mark the identified molecular gas clumps. The GRB position is marked with a magenta circle. The synthesized beam of ALMA is shown in the bottom-left corner.
Download figure:
Standard image High-resolution imageIn any galaxy, the spatial offset between gas and stars on cloud scales, and also the difference between the gas that has fueled the formation of the stars with the gas coexisting with the stars at the time of observations, imply that it is not possible to consistently measure the efficiency of star formation, or the depletion time, on cloud scales. For instance, the depletion time measured at cloud scales are necessarily different from those at galactic scale that account for the entire gas reservoir (see e.g., Schruba et al. 2010). This is because gas depletion time measurements on cloud scales do not reflect the diversity of timescales of the processes involved in triggering and regulating star formation. Such measurements, however, can provide important clues regarding the nature of star formation in a galaxy. For example, spatial and temporal offsets between gas and stars on cloud scales are particularly pronounced in rapidly evolving systems, which significantly impact the measured gas depletion times on cloud scales (see Renaud et al. 2019, in the context of interacting galaxies). Without making assertions based on the measured values, we compare the scatter in measured depletion times of gas clumps in ESO 184–G82 with other studies done on similar scales in other galaxies using a similar approach.
We find the molecular gas depletion times to show a variation of 1.9 dex (given a fixed value for the αCO, as is usually assumed for star-forming galaxies in the literature). This is significantly larger than the typical spread on τdep at similar spatial scales observed in normal star-forming galaxies in the nearby universe. Schruba et al. (2010) measured the τdep on 75 pc–1.2 kpc scales in M33 by centering on molecular gas peaks (similar to what we do here), and found it to vary by <0.3 dex at each resolution. Bolatto et al. (2011) found a characteristic molecular gas depletion time (of ∼1.6 Gyr) on scales of 200 pc in the Small Magellanic Cloud and found it to remain unchanged up to 1 kpc scales. The studies of samples of nearby spiral galaxies by Bigiel et al. (2011) and Leroy et al. (2013) showed typical spread of 0.5 dex at sub-kpc and kpc scales.The large spread of 1.9 dex in the measured τdep values of the molecular gas complexes in ESO 184–G82 is comparable with the large variations of τdep found in starburst galaxies, which show large spatial variations in the physical conditions that trigger star formation, and where normal modes of star formation co-exist with highly enhanced regimes (see for e.g., Pereira-Santaella et al. 2016; Tomičić et al. 2018; Renaud et al. 2019).
4. Discussion
While the global properties of ESO 184–G82 has no indication of a starburst (recall Section 1), the ∼100 pc scale studies of gas and star formation in the galaxy suggest otherwise. The large spread of 1.9 dex in the measured τdep values of the molecular gas complexes in ESO 184–G82 demonstrates the presence of local starburst modes of star formation in ESO 184–G82, which is the favorable condition for the formation of dense and massive star clusters. Indeed, the estimated molecular gas masses of ≥105 M⊙ for the identified clumps in ESO 184–G82 are sufficient for the formation of massive star clusters with masses larger than 104 M⊙ (considering typical efficiencies of 10% for conversion of molecular gas into stars in star-forming galaxies, Ochsendorf et al. 2017; Grisdale et al. 2019).
By assuming  , we estimate an upper limit of 0.37–1.25 Gyr for the molecular gas depletion time at the GRB position. The upper limit is based on the CO(2−1) emission having a significance of 3σ in each channel, and spread over at least two channels (same as the detection criteria described in Section 3), measured in a region with a projected size of ∼150 pc (equivalent to the spatial resolution of the MUSE observations) and centered at the GRB position. The estimated upper limit on τdep at the GRB position is the shortest depletion time after the WR region in ESO 184–G82. This, combined with the large scatter on τdep on cloud scales in the host galaxy (see Section 3), strongly suggest that the progenitor of GRB 980425 was formed in an extreme mode of star formation, like a local starburst. Note that there are several lines of evidence for a top heavy IMF in starburst regions (e.g., Schneider et al. 2018; Zhang et al. 2018), suggesting that such regions are ideal birth-places for GRB progenitors.
In Arabsalmani et al. (2019a) we performed ∼300 pc scales studies of molecular gas in the host galaxy of a superluminous supernova (SLSN). These are another class of extremely bright explosions of massive stars and are found in similar environments as GRBs. Our ALMA observations of the massive and metal-rich host galaxy of SLSN PTF10ptz showed that the SLSN progenitor was also formed in starburst mode of star formation triggered by the internal dynamics of the bar in the host galaxy. But unlike the case of SLSN PTF10ptz where we found the SN position to be located within high surface density molecular gas, we do not detect any molecular gas at the position of GRB 980425.
The location of GRB 980425 is offset by about 16 (∼280 pc) from the center of the closest clumps, C8–C9 (see the right panel of Figure 1). This offset is significantly larger than the reported systematic offset of ∼0
25 between the ALMA and HST positions (see e.g., Barro et al. 2016; Dunlop et al. 2017). It is plausible that the GRB progenitor was a runaway star, dynamically ejected from a cluster formed within this clump. Using N-body simulations Oh & Kroupa (2016) showed that young star clusters tend to eject their massive stars with velocities that can be larger than one hundred km s−1 and thus compatible with the observed offset. They found the efficiency of ejecting massive stars to be higher for clusters with higher densities, and to increase with an increase in the mass of the ejected star. This suggests that the massive progenitor stars of GRBs can be runaway stars, ejected from the most dense clusters. It is notable that a significant fraction of the ejected stars in the study of Oh & Kroupa (2016) are in multiple systems. This is compatible with the formation of GRBs through the interaction of massive stars in binary or multiple systems (Chrimes et al. 2020).
The progenitor of GRB 980425 has an estimated mass of 40 M⊙ derived from the observed properties of the associated SN (Mazzali et al. 2001). It therefore is expected to have formed a few Myr ago. The velocity required by a runaway star to travel the distance between C8 and C9 and the GRB position in 3 Myr is ∼90 km s−1, which is on the higher side of runaway velocities (see Figure 4 in Oh & Kroupa 2016). Hammer et al. (2006) suggested that the GRB progenitor is a runaway star that was ejected from the H ii region located about 800 pc to the northwest of the GRB position. This extremely bright H ii region has been shown to contain a large number of Wolf–Rayet (WR) stars with ages less than a few Myr (Hammer et al. 2006; Krühler et al. 2017) and is referred to as the WR region in ESO 184–G82. C5, the brightest clump in CO(2−1) emission, is clearly associated with this region. Our 2D-Gaussian fittings to the CO and  intensity maps as well as the HST image show that the peak of the CO emission in C5 is coincident with those of the stellar component and the
  emission in the WR region. This region not only has the brightest CO(2−1) emission, but also demonstrates the shortest depletion time. The presence of a large amount of molecular gas shows that the stellar feedback in the WR region has not yet dispersed the molecular gas. This, together with the short depletion time of molecular gas, points to the high densities of molecular gas, as well as the presence of a local starburst mode of star formation in the region. This is in agreement with the findings of Le Floc’h et al. (2012) where an extensive study of the WR region based on infrared observations reveals the starburst nature of the region. Hammer et al. (2006) argued that the progenitor of GRB 980425 was ejected from the WR region (C5), with a runaway velocity of ∼300 km s−1, as required for the progenitor to travel from the WR region to the GRB location in 3 Myr. Such a large runaway velocity, though possible, is very rare (see Figure 4 in Oh & Kroupa 2016). Therefore, in a runaway progenitor scenario, the ejection of the progenitor star(s) from a cluster formed within C8–C9 seems more likely than the progenitor being ejected from the WR region.
The position of the GRB coincides with a concentration of stellar emission, as seen on the HST image (Figure 1), and noted in previous studies. Krühler et al. (2017) estimated the age of young stars in this region to be ∼5 Myr based on the equivalent width of  emission line. This makes the coincidence of a runaway star with the stellar structure (of the same age) at GRB position very unlikely. It is therefore more likely that the progenitor of GRB 980425 was associated with this stellar structure and that it formed in situ (see also the discussion in Krühler et al. 2017). The non-detection of molecular gas in this region indicates that the native cloud of the GRB and the nearby stars has already been dispersed, most likely by stellar feedback. This is compatible with the age estimate of stars in this region of 5 Myr, i.e., longer than the onset of first SNe II that ionized the gas.
Using the multiwavelength observations and simulations, Arabsalmani et al. (2019b) demonstrated that a collision between the GRB host galaxy and its companion has led to the formation of a dense atomic gas ring in the galaxy (see also Roychowdhury et al. 2019, for the presence of a similar ring in the host galaxy of famous transient AT2018cow). Simulations show that such rings have radial expansion velocities of ∼100 km s−1 (Renaud et al. 2018), i.e., traveling a distance of 300 pc in about 3 Myr. It is thus plausible that the passage of the ring-shaped density wave triggered gas compression a few Myr ago at the position of the GRB. This then led to the in situ formation of the clusters and the GRB progenitor, and finally the feedback from massive stars in the clusters dispersed the remaining gas. Meanwhile the gas ring moved outward, leading to the formation of dense clouds outwards from the GRB position (C6, C7, C8 and C9). These clouds are still in the process of assembling, and have not yet formed a significant number of stars, as evident from the long τdep in this region. It is noteworthy that the  image of the galaxy does not show the presence of recent star formation outside the H i ring while
  emission is present only inwards of the gas ring in the galaxy (see the left panel of Figure 4), which supports this scenario.
The clumps with short depletion times are either in the nucleus of the galaxy (C1) or are in the upstream side of the gas ring (C4–C5). The 0.37–1.25 Gyr upper limit on the depletion time at the location of GRB is also consistent with its correspondence to the upstream side of the ring . However, the clumps on the downstream side (in this scenario, C6, C7, C8, C9, and C10) yield a significantly longer depletion times (note that C10 too is offset by about 06, or 100 pc, from the stellar component visible in the HST image). In other words, the variation of depletion times in the molecular gas clumps within the atomic gas ring demonstrates the different stages of enhancement in star formation triggered by the ring density wave induced by the collision between the GRB host galaxy and its companion. Note that a similar pattern is found in simulations of ring galaxies where the ring structure has starburst-like physical conditions (Renaud et al. 2018). Together with the galaxy-scale ring geometry seen in H i (see the left panels of Figures 1 and 4, and the detailed discussion in Arabsalmani et al. 2019b), this supports the idea of a ring-triggered compression of the molecular gas which leads to locally enhanced star formation, and of the GRB progenitor having formed in situ.
5. Summary
We present ALMA observations of molecular gas in the host galaxy of GRB 980425 (ESO 184–G82) at z = 0.0086 on ∼50 pc scales. ESO 184–G82, on galactic scales has properties similar to those of nearby dwarf galaxies and does not show any sign of having star formation in the starburst mode. We identify several molecular gas clumps within the galaxy. The clump closest to the location of the GRB is separated by approximately 280 pc from the GRB position. We argue that in the unlikely scenario where the GRB progenitor was a runaway star, it is more likely that it was ejected from a cluster formed in this gas clump than from the WR region as previously suggested. However, it seems most likely that the progenitor was formed in situ and that the native cloud of the progenitor was dispersed due to stellar feedback in the region.
We measure the molecular gas depletion time on cloud scales in ESO 184–G82 and found a spread of 1.9 dex in the measured τdep values. The large spread of 1.9 dex is comparable with the large variations of τdep found in starburst galaxies. This supports the idea of a local enhancement of star formation in the galaxy triggered by the passage of a ring-shaped density wave due to a collision between the galaxy and its companion discussed in (see Arabsalmani et al. 2019b). Our measurements for the τdep in ESO 184–G82 therefore indicate the presence of (local) starbursts mode of star formation in ESO 184–G82, which is the favorable condition for the formation of dense and massive star clusters. We estimate the molecular gas masses of the identified clumps and found them to be indeed sufficient for the formation of massive star clusters.
This study supports the idea in which massive progenitor stars of GRBs are formed in starburst conditions commonly triggered by interactions at lower redshifts (z ≲ 1.0). In rare cases local starburst conditions are caused due to the internal dynamics of the galaxies, as was shown to be the case in the host galaxy of SLSN PTF10tpz (see Arabsalmani et al. 2019a). Extending resolved studies of molecular gas to a larger number of host galaxies of massive star explosions at low redshifts is necessary to confirm the formation of progenitors under such extreme conditions.
We would like to thank the referee very much for extremely helpful comments and suggestions which improved the paper enormously. M.A. would like to thank Pavel Kroupa and Brent Groves for very helpful discussions. M.A. and S.R. acknowledge support from the Australian Research Council Centre of Excellence for All Sky Astrophysics in 3 Dimensions (ASTRO 3D) through project number CE170100013. F.R. acknowledges support from the Knut and Alice Wallenberg Foundation. This project has received funding from the European Research Council (ERC) under the European Union’s Horizon 2020 research and innovation program (grant agreement No. [725246]). ALMA is a partnership of ESO (representing its member states), NSF (USA) and NINS (Japan), together with NRC (Canada), NSC and ASIAA (Taiwan), and KASI (Republic of Korea), in cooperation with the Republic of Chile. The Joint ALMA Observatory is operated by ESO, AUI/NRAO and NAOJ. We acknowledge using data based on observations collected at the European Southern Observatory under ESO programs 064.H-0375(A), 066.D-0576(A), 165.H-0464(A), and 095.D-0172(A). This work is based in part on data made with the NASA/ESA Hubble Space Telescope, obtained from the data archive at the Space Telescope Science Institute.