Abstract
We present an analysis of physical properties of 34 [O iii] emission-line galaxies (ELGs) at z = 3.254 ± 0.029 in the Extended Chandra Deep Field South (ECDFS). These ELGs are selected from deep narrow H2S(1) and broad Ks imaging of 383 arcmin2 obtained with CFHT/WIRCam. We construct spectral energy distributions (SEDs) from U to Ks to derive the physical properties of ELGs. These [O iii] ELGs are identified as starburst galaxies with strong [O iii] lines of LOIII ∼ 1042.6–1044.2 erg s−1 and have stellar masses of M* ∼ 109.0–1010.6 M⊙ and star formation rates of ∼10–210 M⊙ yr−1. Our results show that 24% of our sample galaxies are dusty with AV > 1 mag and EW([O iii])rest ∼ 70–500 Å, which are often missed in optically selected [O iii] ELG samples. Their rest-frame UV and optical morphologies from HST/ACS and HST/WFC3 deep imaging reveal that these [O iii] ELGs are mostly multiple-component systems (likely mergers) or compact. And 20% of them are nearly invisible in the rest-frame UV owing to heavy dust attenuation. Interestingly, we find that our sample ELGs reside in an overdensity consisting of two components: one southeast (SE) with an overdensity factor of δgal ∼ 41 over a volume of 133 cMpc3, and the other northwest (NW) with δgal ∼ 38 over a volume of 103 cMpc3. The two overdense substructures are expected to be virialized at z = 0 with a total mass of ∼ 1.1 × 10¹⁵ M⊙ and ∼ 4.8 × 10¹⁴ M⊙ and probably merge into a Coma-like galaxy cluster.
Original content from this work may be used under the terms of the Creative Commons Attribution 4.0 licence. Any further distribution of this work must maintain attribution to the author(s) and the title of the work, journal citation and DOI.
1. Introduction
The past two decades have witnessed a wealth of progress in mapping galaxy formation and evolution. The current generation of multiwavelength deep surveys have revealed the detailed properties of galaxy populations out to z ∼ 2–3, where the cosmic star formation rate density (CSFRD) reaches its peak (Hopkins & Beacom 2006; Sobral et al. 2013; Madau & Dickinson 2014; Khostovan et al. 2015). At z > 2–3 about one-quarter of the present-day stars were formed in the progenitors of present-day massive galaxies (Madau & Dickinson 2014), preferentially in the overdense environments (Thomas et al. 2005; Chiang et al. 2017). Characterizing the properties of galaxies at z > 3 is thus essential to understanding the early formation of massive galaxies and large-scale structures, as well as how the star formation activities are activated to reach the peak of CSFRD (Suzuki et al. 2015; Onodera et al. 2016, 2020).
The emission lines in the rest-frame optical spectra of galaxies (e.g., [O ii] λ λ3727, 3729, Hβ, [O iii] λ λ4959, 5007, [N ii] λ λ6549, 6585, Hα and [S ii] λ λ6718, 6732) are mostly used for physical and chemical diagnostics (see Kewley et al. 2019, for a review). Moreover, studies of emission-line galaxies (ELGs) at z > 3 provide insights into understanding the cosmic reionization (de Barros et al. 2016). The universe is fully ionized by z ∼ 6 (e.g., Fan et al. 2006; de Barros et al. 2014). Star-forming galaxies (SFGs) at z > 6 are thought to be the main contributors to the ionizing field in the era of reionization (e.g., Nakajima & Ouchi 2014; Robertson et al. 2015). Owing to the opaque intergalactic medium (e.g., Worseck et al. 2014), the nature of ionizing sources in the reionization era is still not well understood.
These ionizing sources usually have prominent [O iii]+Hβ emission (De Barros et al. 2019; Endsley et al. 2021). The strong [O iii] emission lines may reveal the extreme conditions of the interstellar medium in a galaxy and likely are associated with low metallicity and high ionizing parameters (McLinden et al. 2011; Nakajima & Ouchi 2014; Onodera et al. 2020; Tang et al. 2021b). The extreme [O iii] ELGs are often seen as analogs of galaxies in the reionization era (Tang et al. 2019; Du et al. 2020; Tang et al. 2021a, 2022). And galaxies with large [O iii] equivalent widths (EWs; from 200 to 800 Å) are widely used to address the Lyα continuum escape fraction in the high-z universe (Fletcher et al. 2019; Barrow et al. 2020; Katz et al. 2020; Nakajima et al. 2020). Their analogs at low z refer to the so-called “Green Pea” galaxies (Cardamone et al. 2009), showing strong [O iii] emission with extremely high [O iii]/[O ii] ratio (Jaskot & Oey 2013; Yang et al. 2017; Yuma et al. 2019; Lumbreras-Calle et al. 2021; Liu et al. 2022). The [O iii] lines redshift into the near-infrared (NIR) and mid-infrared (MIR) bands for z > 3 objects. Deep IR photometric and spectroscopic observations are thus crucial to identifying and studying SFGs at z > 3 (e.g., Bunker et al. 1995; Geach et al. 2008; Nakajima et al. 2013; Sobral et al. 2013; Khostovan et al. 2016).
However, the NIR observations of high-z galaxies can be carried out only in the J, H, and K s bands on the ground owing to the atmospheric transmission. And the high sky background leads such observations to be very time-consuming and available only for a limited sky area. MOSFIRE on board the Keck telescope is an efficient instrument in taking NIR spectroscopy of high-z galaxies (McLean et al. 2012). The NIR spectroscopic surveys with MOSFIRE, e.g., the Keck Baryonic Structure Survey (KBSS-MOSFIRE; Steidel et al. 2014) and the MOSFIRE Deep Evolution Field survey (MOSDEF; Kriek et al. 2015; Shapley et al. 2015; Reddy et al. 2018), obtained rest-frame optical spectra of thousands of galaxies mostly at z ∼ 1.4–3 based on the H-band selection. In contrast, the NIR observations with space-borne facilities are free from the atmospheric emission but constrained by the thermal emission from the facilities. The IR grism surveys using WFC3 on board the Hubble Space Telescope (HST), e.g., the WFC3 Infrared Spectroscopic Parallel Survey (WISP; Atek et al. 2011), the MAMMOTH-Grism HST slitless spectroscopic survey (Wang et al. 2022), and the 3D-HST survey (Brammer et al. 2012; Momcheva et al. 2016), provided low-resolution rest-frame optical spectra for a large number of galaxies out to z ∼ 2.5. These NIR surveys have built a more comprehensive view of the physical properties of galaxies at 1 < z < 3. The James Webb Space Telescope (JWST) will offer unprecedented sensitivities in the NIR and MIR to conduct imaging and spectroscopy of high-z galaxies and revolutionize our understanding of galaxy formation and evolution since the era of reionization.
Deep imaging through narrow- and broadband K s enables us to detect the emission lines [O iii] λ λ4959, 5007 in galaxies over 3 < z < 3.7 and even determine the [O iii] luminosity functions (Reddy et al. 2008; Kashikawa et al. 2011; Khostovan et al. 2015; Sobral et al. 2015; Gong et al. 2017; Khostovan et al. 2020). Such observations are often used to identify Hα and other emission lines at lower redshifts (Khostovan et al. 2015, 2016). It has been verified that the approach with NIR narrowband imaging is effective in probing ELGs within a narrow redshift range of δ z/(1 + z) = 1%–2% over a large sky coverage (Sobral et al. 2013). On the other hand, the presence of strong [O iii] emission lines may cause an excess of the observed K s flux relative to the continuum flux derived from broadband spectral energy distributions (SEDs) and be used to identify [O iii] ELGs at 3 < z < 3.7 (Onodera et al. 2020). Pilot studies of [O iii] ELGs with spectroscopic observations have contributed to addressing the kinematic and structural evolution of [O iii] SFGs (Steidel et al. 2010; McLinden et al. 2013; Schenker et al. 2013; Gillman et al. 2019; Price et al. 2020; Tran et al. 2020; Yates et al. 2020), as well as metal enrichments (e.g., Kewley & Ellison 2008; Mannucci et al. 2010; Sommariva et al. 2012; Nakajima & Ouchi 2014; Troncoso et al. 2014; Nakajima et al. 2016).
In the Extended Chandra Deep Field South (ECDFS), a deep narrowband imaging survey has been carried out with CFHT/WIRCam, detecting a sample of 34 [O iii] ELGs at z ∼ 3.25 (An et al. 2014, hereafter A14). Here we conduct a detailed analysis of the physical properties of these [O iii] ELGs using the publicly available multiwavelength data. This paper is organized as follows: In Section 2, we briefly introduce our narrowband imaging observations and multiwavelength data used in our analysis. Section 3 displays the input parameters of SED fitting and gives the results. We present the physical properties of our [O iii] samples in Section 4, and the overdensity in ECDFS traced by [O iii] is shown in Section 5. We discuss our results in Section 6. In Section 7 we give a summary of this work. Throughout this paper we adopt cosmological parameters of ΩM = 0.3, ΩΛ = 0.7, and H0 = 70 km s−1 Mpc−1. Unless otherwise stated, all magnitudes are given in the AB magnitude system (Oke 1974), and a Chabrier initial mass function (IMF; Chabrier 2003) is assumed.
2. Sample and Data
A14 presented the observations and detections of 140 emission-line objects with the H2S(1) narrowband and K s broadband imaging of ECDFS. Of the 140 objects, 34 are recognized as [O iii] ELGs at z ∼ 3.25. Here we briefly describe the NIR observations, data, and selection for the sample of 34 [O iii] ELGs. More details can be found in A14.
2.1. Sample Selection
A deep imaging survey of ECDFS (centered at α = 03:28:45, δ = −27:48:00) was conducted through the narrowband filter H2S(1) (λ
c
= 2.130 μm, Δλ = 0.0293 μm) with the instrument WIRCam on board the Canada–France–Hawaii Telescope (CFHT; Puget et al. 2004). WIRCam consists of four 2048×2048 HAWAII2-RG detectors, providing a sky coverage of  with a pixel scale of 0
3 pixel−1. The deep K
s
-band (λ
c
= 2.146 μm, Δλ = 0.325 μm) imaging data were also obtained with CFHT/WIRCam and adopted in our analysis from Hsieh et al. (2012). The final science images reach a 5σ depth of H2S(1) = 22.8 mag and K
s
= 24.8 mag for point sources.
The H2S(1) and K s imaging data of ECDFS are used to identify ELGs with the K s − H2S(1) color excess (Bunker et al. 1995) following
where Σ is the significant factor and  and
and  are background noises in the two bands. The Σ is introduced to identify ELGs with the combined 1σ photometric error from both the narrow and broad bands. Here
  refers to H2S(1) flux as
  . The noises and fluxes are given in units of μJy. Using the color excess criteria, in total 8720 sources were detected with S/N > 5 in both H2S(1) and K
s
. Their fluxes were measured from the corresponding images using the software tool SExtractor (Bertin & Arnouts 1996). With the selection criteria of Σ = 3 and EW > 50 Å, in total 140 objects were securely selected as emission-line candidates.
. The noises and fluxes are given in units of μJy. Using the color excess criteria, in total 8720 sources were detected with S/N > 5 in both H2S(1) and K
s
. Their fluxes were measured from the corresponding images using the software tool SExtractor (Bertin & Arnouts 1996). With the selection criteria of Σ = 3 and EW > 50 Å, in total 140 objects were securely selected as emission-line candidates.
2.2. Public Data
We utilize optical U-, B-, V-, R-, and I-band photometric catalog and imaging data from the Multiwavelength Survey by Yale-Chile (MUSYC; Gawiser et al. 2006; Cardamone et al. 2010); HST/ACS F606W (V606) and F850LP (z850) imaging from the GEMS survey (Rix et al. 2004; Caldwell et al. 2008); HST/WFC3 F125W (J125) and F160W (H160) imaging from the Cosmic Assembly Near-infrared Deep Extragalactic Legacy Survey (CANDELS; Grogin et al. 2011; Koekemoer et al. 2011); and CFHT/WIRCam J and K s imaging data (Hsieh et al. 2012), in conjunction with our H2S(1) imaging data. Fluxes in these 12 bands are obtained for the sample of 140 emission-line candidates. Note that 16 targets are optically too faint to be included in the MUSYC public catalog, and 72 sources out of the 140 candidates have J125 and H160 data since the CANDELS survey only covers a part of ECDFS.
By fitting their SEDs composed of 12-band data points with the software tool EAZY (Easy and Accurate Redshifts from Yale; (Brammer et al. 2008), photometric redshifts (photo-z) were derived for the 140 emission-line candidates (the modeling will be introduced in Section 3). Of them, 34 ELGs with 2.8 < zphot < 3.3 are identified as [O iii] emitters at z ∼ 3.25. With the public catalogs available in the literature, we also identify that 8 of these 34 ELGs have spectroscopic redshifts (spec-z). Except for one source that has a spec-z at 3.083, the spec-z of the remaining seven sources is in the range of 3.208–3.248, confirming that these ELGs are located at z ∼ 3.25.
The redshift distribution of the 34 [O iii] ELGs and H2S(1) width are shown in Figure 1. Because the narrowband filter H2S(1) has a relatively small bandwidth Δλ, we attribute the emission line detected in this band to [O iii] λ5007 (this will be discussed later in Section 6.1). More details about emission-line source selection and the EAZY SED fittings can be found in An et al. (2013) and A14.
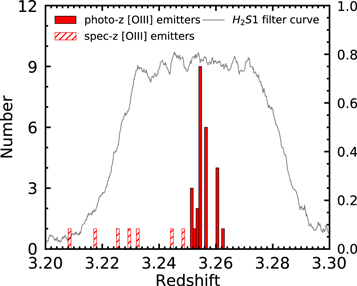
Figure 1. Redshift distribution of 34 [O iii] ELGs. A bin width of 0.001 is adopted. The filled histogram presents the distribution of [O iii] ELGs with photo-z, while the hatched histogram refers to spec-z. The gray curve is the width range of H2S(1) filter for the [O iii] λ5007 emission line at z ∼ 3.25.
Download figure:
Standard image High-resolution image3. SED Fitting
In order to maximize signal-to-noise ratio (S/N) for aperture-matched colors between the 12 bands mentioned above, A14 first determined colors for MUSYC, HST, and CFHT bands, respectively, and then matched three sets of colors to establish SED input fluxes from U to K s . Finally, the SED was scaled up to meet the total flux of K s derived from aperture photometry within a diameter of 2′ corrected for the missing flux out of the aperture (see A14 for more details). The photometric fluxes in the 12 bands from U to K s for our sample of 34 [O iii] ELGs are listed in Table 1.
Table 1. Multiband Photometry of 34 [O iii] Emitters of Our Samples
| ID | R.A.(J2000) | Decl.(J2000) | fU | fB | fV | fR | fI | fv606 | fz850 | f125 | f160 | fJ |

| K s |
|---|---|---|---|---|---|---|---|---|---|---|---|---|---|---|
| 1 | 53.176239 | −27.978130 | −0.15 ± 0.02 | 0.20 ± 0.01 | 0.38 ± 0.02 | 0.53 ± 0.11 | 0.54 ± 0.02 | 0.45 ± 0.01 | 0.70 ± 0.05 | ⋯ | ⋯ | 0.69 ± 0.07 | 2.60 ± 0.41 | 1.23 ± 0.11 |
| 2 | 53.159058 | −27.972429 | −0.13 ± 0.02 | 0.18 ± 0.01 | 0.32 ± 0.02 | 0.44 ± 0.10 | 0.49 ± 0.02 | 0.40 ± 0.01 | 0.62 ± 0.04 | ⋯ | ⋯ | 0.80 ± 0.06 | 4.14 ± 0.33 | 1.69 ± 0.09 |
| 3 | 53.178284 | −27.969770 | −0.17 ± 0.02 | 0.39 ± 0.02 | 0.65 ± 0.02 | 0.98 ± 0.12 | 0.84 ± 0.02 | 0.74 ± 0.02 | 0.93 ± 0.05 | ⋯ | ⋯ | 1.00 ± 0.10 | 6.93 ± 0.47 | 2.06 ± 0.14 |
| 4 | 53.239136 | −27.951475 | −0.20 ± 0.03 | 0.15 ± 0.02 | 0.30 ± 0.02 | 0.47 ± 0.14 | 0.46 ± 0.02 | 0.38 ± 0.02 | 0.46 ± 0.06 | ⋯ | ⋯ | 0.49 ± 0.08 | 3.09 ± 0.46 | 1.20 ± 0.12 |
| 5 | 53.158218 | −27.950077 | −0.10 ± 0.01 | 0.36 ± 0.01 | 0.65 ± 0.01 | 1.30 ± 0.08 | 0.99 ± 0.01 | ⋯ | 0.59 ± 0.03 | ⋯ | ⋯ | 1.39 ± 0.07 | 5.81 ± 0.28 | 2.97 ± 0.11 |
| 6 | 52.965435 | −27.948175 | −0.14 ± 0.02 | 0.17 ± 0.01 | 0.31 ± 0.02 | 0.54 ± 0.11 | 0.40 ± 0.02 | 0.36 ± 0.01 | 0.42 ± 0.04 | ⋯ | ⋯ | 0.61 ± 0.06 | 5.61 ± 0.27 | 1.32 ± 0.09 |
| 7 | 53.173649 | −27.943214 | −0.10 ± 0.01 | −0.06 ± 0.01 | 0.10 ± 0.01 | −0.41 ± 0.07 | 0.17 ± 0.01 | ⋯ | 0.29 ± 0.03 | ⋯ | ⋯ | 0.20 ± 0.05 | 2.65 ± 0.22 | 0.70 ± 0.07 |
| 8 | 53.162315 | −27.942719 | −0.10 ± 0.01 | 0.17 ± 0.01 | 0.32 ± 0.01 | 0.65 ± 0.08 | 0.45 ± 0.01 | ⋯ | 0.59 ± 0.03 | ⋯ | ⋯ | 1.12 ± 0.05 | 4.57 ± 0.24 | 1.79 ± 0.08 |
| 9 | 53.171169 | −27.932827 | −0.17 ± 0.03 | 0.11 ± 0.02 | 0.27 ± 0.02 | −0.72 ± 0.13 | 0.34 ± 0.02 | 0.30 ± 0.00 | 0.67 ± 0.01 | 0.48 ± 0.02 | 0.79 ± 0.02 | 0.38 ± 0.06 | 2.97 ± 0.37 | 0.97 ± 0.09 |
| 10 | 53.170116 | −27.929638 | ⋯ | ⋯ | ⋯ | ⋯ | ⋯ | 0.17 ± 0.01 | 0.36 ± 0.02 | 1.07 ± 0.02 | 2.24 ± 0.02 | 0.95 ± 0.05 | 26.41 ± 0.28 | 8.25 ± 0.08 |
| 11 | 53.161907 | −27.920698 | −0.12 ± 0.02 | 0.08 ± 0.01 | 0.13 ± 0.02 | −0.50 ± 0.09 | 0.18 ± 0.01 | 0.15 ± 0.01 | 0.19 ± 0.02 | 0.16 ± 0.01 | 0.20 ± 0.02 | 0.21 ± 0.05 | 2.19 ± 0.26 | 0.62 ± 0.07 |
| 12 | 53.167480 | −27.913368 | −0.12 ± 0.02 | −0.07 ± 0.01 | −0.09 ± 0.02 | −0.53 ± 0.10 | −0.08 ± 0.02 | 0.18 ± 0.01 | 0.23 ± 0.01 | 0.30 ± 0.01 | 0.44 ± 0.02 | 0.18 ± 0.05 | 3.14 ± 0.28 | 0.85 ± 0.07 |
| 13 | 53.054432 | −27.902388 | −0.09 ± 0.02 | 0.21 ± 0.01 | 0.53 ± 0.01 | −0.39 ± 0.08 | 0.35 ± 0.01 | 0.43 ± 0.01 | 0.31 ± 0.03 | ⋯ | ⋯ | 0.39 ± 0.05 | 9.06 ± 0.22 | 1.85 ± 0.07 |
| 14 | 53.148323 | −27.901218 | −0.18 ± 0.03 | 0.24 ± 0.02 | 0.39 ± 0.02 | 0.46 ± 0.14 | 0.47 ± 0.02 | 0.43 ± 0.01 | 0.56 ± 0.02 | 0.58 ± 0.02 | 0.76 ± 0.03 | 0.68 ± 0.08 | 3.51 ± 0.45 | 1.23 ± 0.13 |
| 15 | 53.161755 | −27.897072 | −0.26 ± 0.02 | 0.68 ± 0.04 | 1.13 ± 0.04 | 1.75 ± 0.16 | 1.23 ± 0.07 | 1.18 ± 0.02 | 1.61 ± 0.04 | 1.65 ± 0.03 | 1.97 ± 0.04 | 1.59 ± 0.15 | 7.15 ± 0.70 | 2.61 ± 0.23 |
| 16 | 53.204742 | −27.894541 | −0.16 ± 0.03 | −0.09 ± 0.02 | 0.16 ± 0.02 | −0.66 ± 0.12 | 0.24 ± 0.02 | 0.19 ± 0.01 | 0.31 ± 0.02 | 0.32 ± 0.02 | 0.46 ± 0.02 | 0.34 ± 0.06 | 2.46 ± 0.36 | 0.84 ± 0.10 |
| 17 | 53.109936 | −27.880537 | −0.15 ± 0.02 | 0.09 ± 0.02 | 0.16 ± 0.02 | −0.64 ± 0.12 | 0.34 ± 0.02 | 0.24 ± 0.01 | 0.39 ± 0.02 | ⋯ | ⋯ | 0.44 ± 0.07 | 2.86 ± 0.35 | 1.16 ± 0.10 |
| 18 | 53.171844 | −27.872406 | −0.17 ± 0.02 | 0.17 ± 0.02 | 0.35 ± 0.02 | −0.70 ± 0.13 | 0.40 ± 0.02 | 0.37 ± 0.01 | 0.45 ± 0.02 | 0.38 ± 0.02 | 0.45 ± 0.03 | 0.44 ± 0.08 | 3.67 ± 0.40 | 0.93 ± 0.11 |
| 19 | 53.157902 | −27.869659 | −0.28 ± 0.04 | 0.54 ± 0.03 | 0.77 ± 0.03 | 1.44 ± 0.20 | 1.03 ± 0.03 | 0.89 ± 0.02 | 0.70 ± 0.03 | 0.84 ± 0.04 | 1.47 ± 0.04 | 0.75 ± 0.13 | 4.27 ± 0.67 | 1.55 ± 0.21 |
| 20 | 53.048820 | −27.865334 | −0.27 ± 0.04 | −0.16 ± 0.03 | −0.19 ± 0.04 | −1.14 ± 0.21 | −0.17 ± 0.03 | 0.07 ± 0.02 | 0.26 ± 0.08 | 0.38 ± 0.05 | 0.80 ± 0.06 | 0.50 ± 0.12 | 3.30 ± 0.65 | 1.54 ± 0.17 |
| 21 | 53.019222 | −27.847075 | −0.10 ± 0.02 | −0.06 ± 0.01 | 0.09 ± 0.01 | −0.44 ± 0.08 | 0.18 ± 0.01 | 0.13 ± 0.01 | 0.24 ± 0.03 | ⋯ | ⋯ | 0.46 ± 0.04 | 3.31 ± 0.24 | 1.54 ± 0.07 |
| 22 | 53.061619 | −27.846251 | −0.20 ± 0.03 | 0.72 ± 0.02 | 1.24 ± 0.03 | 1.26 ± 0.15 | 1.30 ± 0.02 | 1.27 ± 0.01 | 1.39 ± 0.03 | 1.11 ± 0.02 | 1.29 ± 0.03 | 0.98 ± 0.15 | 4.36 ± 0.61 | 1.91 ± 0.18 |
| 23 | 53.124718 | −27.824574 | −0.15 ± 0.02 | 0.42 ± 0.01 | 0.77 ± 0.02 | 0.94 ± 0.11 | 0.93 ± 0.02 | 0.85 ± 0.01 | 1.17 ± 0.02 | 1.11 ± 0.01 | 1.39 ± 0.02 | 0.99 ± 0.06 | 6.25 ± 0.39 | 2.29 ± 0.09 |
| 24 | 53.080879 | −27.791168 | −0.14 ± 0.02 | 0.15 ± 0.02 | 0.36 ± 0.02 | 0.48 ± 0.12 | 0.46 ± 0.02 | 0.41 ± 0.01 | 0.62 ± 0.02 | 0.66 ± 0.01 | 0.88 ± 0.02 | 0.53 ± 0.05 | 5.22 ± 0.39 | 1.57 ± 0.09 |
| 25 | 53.106331 | −27.783159 | −0.15 ± 0.02 | 0.14 ± 0.02 | 0.18 ± 0.02 | −0.63 ± 0.12 | 0.22 ± 0.02 | 0.20 ± 0.01 | 0.29 ± 0.02 | 0.43 ± 0.01 | 0.62 ± 0.02 | 0.45 ± 0.05 | 2.83 ± 0.36 | 1.16 ± 0.09 |
| 26 | 53.263027 | −27.759014 | −0.16 ± 0.03 | 0.26 ± 0.02 | 0.43 ± 0.02 | 0.51 ± 0.13 | 0.60 ± 0.02 | 0.51 ± 0.01 | 0.56 ± 0.05 | ⋯ | ⋯ | 0.50 ± 0.10 | 4.09 ± 0.40 | 1.21 ± 0.13 |
| 27 | 53.008801 | −27.758272 | −0.16 ± 0.03 | 0.10 ± 0.02 | 0.19 ± 0.02 | −0.69 ± 0.13 | 0.29 ± 0.02 | 0.23 ± 0.01 | 0.31 ± 0.03 | ⋯ | ⋯ | 0.31 ± 0.07 | 3.93 ± 0.37 | 1.42 ± 0.11 |
| 28 | 53.013573 | −27.755177 | −0.14 ± 0.02 | 0.39 ± 0.02 | 0.89 ± 0.02 | 0.56 ± 0.12 | 0.66 ± 0.02 | 0.76 ± 0.01 | 0.65 ± 0.02 | 0.66 ± 0.01 | 0.84 ± 0.02 | 0.62 ± 0.05 | 10.49 ± 0.33 | 2.93 ± 0.08 |
| 29 | 53.110451 | −27.754616 | −0.12 ± 0.02 | −0.07 ± 0.01 | −0.09 ± 0.02 | −0.53 ± 0.10 | −0.08 ± 0.02 | 0.23 ± 0.01 | 0.41 ± 0.01 | 0.52 ± 0.01 | 0.81 ± 0.01 | 0.46 ± 0.05 | 2.91 ± 0.31 | 1.29 ± 0.08 |
| 30 | 53.140198 | −27.751116 | −0.18 ± 0.03 | 0.18 ± 0.02 | 0.28 ± 0.02 | −0.77 ± 0.14 | 0.32 ± 0.02 | 0.30 ± 0.01 | 0.39 ± 0.02 | 0.29 ± 0.02 | 0.38 ± 0.02 | 0.25 ± 0.08 | 2.57 ± 0.48 | 0.61 ± 0.13 |
| 31 | 53.131378 | −27.745434 | −0.19 ± 0.03 | 0.16 ± 0.02 | 0.33 ± 0.02 | −0.79 ± 0.14 | 0.41 ± 0.02 | 0.37 ± 0.01 | 0.54 ± 0.02 | 0.56 ± 0.02 | 0.68 ± 0.02 | 0.46 ± 0.08 | 3.65 ± 0.48 | 1.53 ± 0.12 |
| 32 | 53.124756 | −27.744980 | −0.15 ± 0.02 | 0.10 ± 0.02 | 0.18 ± 0.02 | −0.62 ± 0.12 | 0.26 ± 0.02 | 0.22 ± 0.01 | 0.32 ± 0.02 | 0.24 ± 0.01 | 0.38 ± 0.02 | 0.40 ± 0.07 | 4.13 ± 0.39 | 1.01 ± 0.11 |
| 33 | 53.214493 | −27.739864 | ⋯ | ⋯ | ⋯ | ⋯ | ⋯ | 0.09 ± 0.02 | 0.57 ± 0.06 | ⋯ | ⋯ | 0.62 ± 0.08 | 6.92 ± 0.36 | 3.65 ± 0.14 |
| 34 | 53.087608 | −27.726042 | −0.17 ± 0.05 | 0.38 ± 0.02 | 0.52 ± 0.02 | 0.72 ± 0.14 | 0.59 ± 0.02 | 0.55 ± 0.01 | 0.77 ± 0.02 | 0.85 ± 0.01 | 1.04 ± 0.01 | 0.69 ± 0.06 | 2.25 ± 0.04 | 1.08 ± 0.10 |
Note. Note that all fluxes are given in units of μJy.
Download table as: ASCIITypeset image
Photometric redshifts (photo-z) were derived from these SEDs using EAZY with relatively small errors partially because of the narrowband data points linked to given redshifts traced by emission lines. The galaxy SED templates were generated from a library of six independent templates in EAZY. This gives a fast determination on photo-z but sacrifices the accuracy in modeling the details of SEDs (e.g., line fluxes). Therefore, we utilize the Code Investigating GALaxy Emission (CIGALE; Boquien et al. 2019) to analyze the SEDs of our [O iii] ELGs with the improved galaxy templates. CIGALE produces millions of models to fit the observational data and estimates their physical properties such as stellar mass, star formation rate (SFR), and dust attenuation, while applying a Bayesian statistical analysis approach to estimate the results. The photo-z obtained with EAZY are used in the CIGALE fitting as the input redshift since CIGALE is not optimized to measure photometric redshift.
The Chabrier (2003) IMF and the stellar population synthesis model from Bruzual & Charlot (2003) are adopted for the fitting. We set three values of metallicity as 0.0004, 0.008, and 0.02 (for Z⊙ = 0.02) in stellar models. A delayed form of star formation history (SFH), SFR  , is adopted in our fitting too, where t is the time of the star formation onset and τmain is the e-folding time of the main stellar population. Such a functional form is more physical than a simple exponential SFH because it removes the discontinuity in SFR at t = 0 and is able to produce an increasing SFR when τ is large (Carnall et al. 2019). A starburst component fburst can be added at a given mass fraction as well. This SFH can fit the high-z SFGs well since they usually have a relatively strong star formation activity. It also avoids the systematic biases caused by the degeneracy between the slope of the dust attenuation curve, effective dust attenuation, and intrinsic UV slope of model templates (Yuan et al. 2019; Villa-Vélez et al. 2021; Qin et al. 2022). The degeneracy is indeed smaller for blue SFGs. However, high-z SFGs may have nonnegligible dust attenuation, and this could increase the degeneracy for these dusty objects.
For nebular emission, the initial parameters include the dimensionless ionization parameter  , the escape fraction of Lyman continuum photons fesc, and the fraction of Lyman continuum photons absorbed by dust fdust. The radiation strength U is set to be −2.0, while fesc and fdust have values of 0.0, 0.1, and 0.2.
We adopt the modified Calzetti law (Calzetti et al. 2000; Noll et al. 2009) to describe the dust attenuation in our fitting. The attenuation for nebular emission is higher than that for stellar emission. We set E(B−V)factor, a ratio of E(B−V)star to E(B−V)gas, to be 0.44 (Calzetti et al. 2000). Meanwhile, the color excess of the nebular lines E(B−V)gas and the slope of the power law modifying the attenuation curve δ are chosen to change freely, in the range of 0.05−0.8 and −1.0 to 0.2, respectively. We also take the amplitude of UV bump to be 0, 1, 2, 3, or 4, where 3 corresponds to the value of the Milky Way. And the ratio of total to selective extinction R v is fixed to a standard value of 3.1.
Due to the lack of detections in the far-IR, the SED of dust emission is not well constrained in our work. The dust emission is modeled with templates from Dale et al. (2014), which refines the PAH emission and also adds an optional active galactic nucleus (AGN) fraction in the modeling. The star-forming component is parameterized by a single parameter α defined as d M d (U) ∝ U−α d U, where M d is the dust mass and U is the radiation field intensity. We set the AGN fraction to be zero, and the slope is fixed at α = 2.
As pointed out by Lambrides et al. (2020), the X-ray selection might miss faint AGNs at z > 2 because their host galaxies usually have strong star formation activities. As a check, we add detailed AGN models from Fritz et al. (2006) in CIGALE to test our results. The ratio of the maximum to minimum radii of the dust torus is set to be 30 and 100, while the optical depth at 9.7 μm is 0.3 and 2. And the AGN fraction has a value of 0, 0.01, and 0.1. All the input parameters of CIGALE fitting are given in Table 2.
Table 2. Input Parameters for SED Fitting with CIGALE (Boquien et al. 2019)
| Parameter | Symbol | Value |
|---|---|---|
| Stellar Population | ||
| Bruzual & Charlot (2003) | ||
| Initial mass function | IMF | Chabrier (2003) |
| Metallicity | Z⋆ | 0.0004, 0.008, 0.02 |
| Delayed Star Formation History | ||
| e-folding time of main stellar population (Myr) | τmain | 50, 100, 200, 500, 4000, 10000 |
| Age of main stellar population (Myr) | agemain | 50, 500, 1000, 2000 |
| Age of the late burst (Myr) | ageburst | 20,50 |
| e-folding time of the late burst (Myr) | τburst | 10, 50, 100, 1000, 8000 |
| Mass fraction of the late burst population | fburst | 0.01, 0.1, 0.2 |
| Nebular Emission | ||
| Ionization parameter |

| −2.0 |
| LyC escape fraction | fesc | 0.0, 0.1, 0.2 |
| LyC absorbed by dust | fdust | 0.0, 0.1, 0.2 |
| Dust attenuation | ||
| Noll et al. (2009) | ||
| Color excess of the nebular lines (Mag) | E(B−V)lines | 0.05, 0.1, 0.15, 0.2, 0.25, 0.3, 0.4, 0.5, 0.6, 0.7, 0.8 |
| Nebular-to-continuum ratio | E(B−V)factor | 0.44 |
| Amplitude of the UV bump | Abump | 0, 1, 2, 3, 4 |
| Slope of the attenuation curve | δ | −1.0, −0.8, −0.6, −0.4, −0.2, 0.0, 0.2 |
| Line emission extinction | R v | 3.1 |
| Dust Emission | ||
| Dale et al. (2014) | ||
| Power-law slope dU/dM ∝ Uα | α | 2.0 |
| AGN Model | ||
| Fritz et al. (2006) | ||
| Ratio of the max to min radii of the dust torus | rratio | 30, 100 |
| Torus optical depth at 9.7 μm | τ9.7 | 0.3, 2.0 |
| Density function parameter beta | β | −0.5 |
| Density function parameter gamma | γ | 4.0 |
| Opening angle of the dust torus (deg) | θ | 100 |
| Viewing angle (deg) | ψ | 30.1, 60.1 |
| AGN fraction | ffrac | 0.0, 0.01, 0.1 |
Download table as: ASCIITypeset image
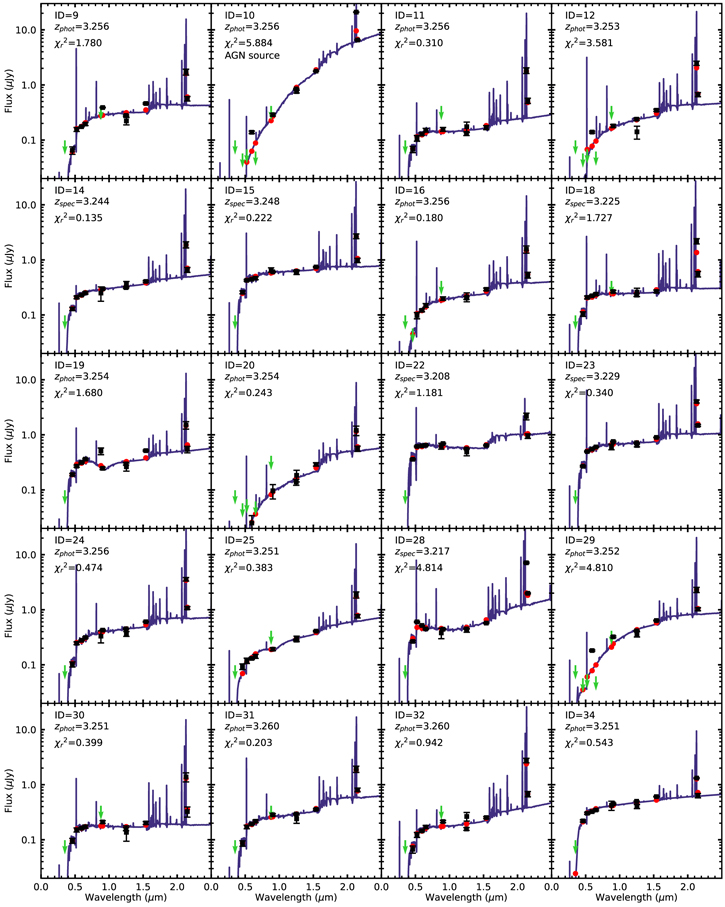
The best-fit model from CIGALE is chosen using the least-squares method, and the reduced χ2 ( ) is used as a global indicator to quantify the quality of the fitting. Figure 2 shows the results of CIGALE fitting of 34 [O iii] ELGs; their ID, photo-z (spec-z if available), and parameter
  of the fittings are shown in each panel. The first panel consists of 20 [O iii] ELGs with J125 and H160 imaging data, while the second panel consists of the remaining 14 [O iii] ELGs without these two bands. Only one object (ID = 10) shows a large
  owing to the detection upper limits in five MUSYC bands. About 65% of the objects have
  and 85% have
  , suggesting that most of our best-fit SEDs are obtained in good quality.
Download figure:
Standard image High-resolution image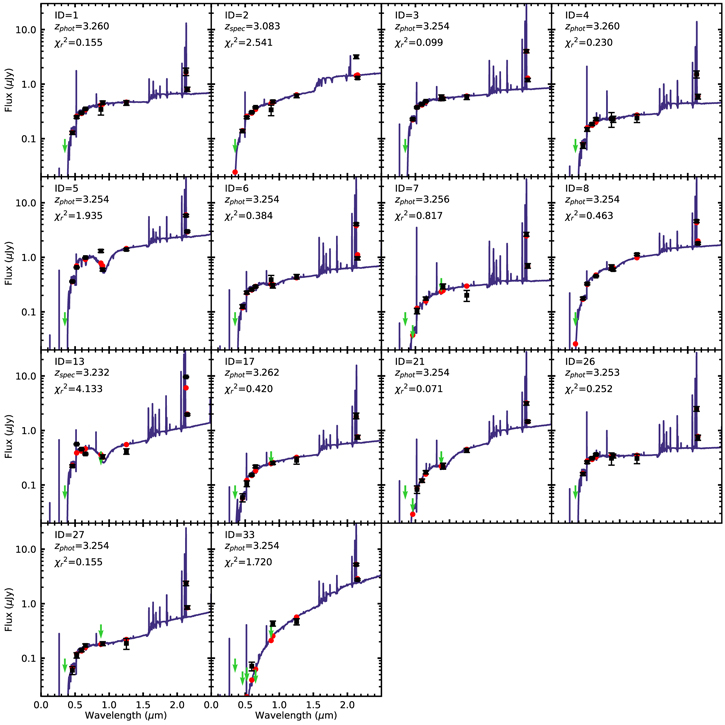
Figure 2. (a) Best-fit SEDs from CIGALE for our sample of 34 z ∼ 3.25 [O iii] ELGs. Black squares and error bars present the observed data points of multiband photometry. Green arrows mark the upper limits of given band detections. Blue lines are the best-fit model SEDs, and red circles refer to the model points in the same bands. The ID, photo-z (spec-z if available), and  are labeled in each panel. The object with ID = 10 hosts an AGN detected in the 7 Ms Chandra observations. These 20 [O iii] ELGs have HST/WFC3 J125 and H160 imaging data. (b) Continued for the best-fit SEDs from CIGALE fitting of the remaining 14 [O iii] ELGs, which are not covered by the HST/WFC3 J125 and H160 imaging.
Download figure:
Standard image High-resolution imageNote that the 2175 Å bump is present in the best-fit SEDs for some [O iii] ELGs in our sample (e.g., ID = 5, 13). We will further examine in Section 4.5 whether such a feature is caused by measurement uncertainties or a solid detection of the 2175 Å bump in z ∼ 3.25 [O iii] ELGs.
4. Properties of [O iii] Emission-line Galaxies
4.1. X-Ray Detection
AGN activities can also make a contribution to the [O iii] line. Thus, it is essential to verify whether the [O iii] emission lines in some of our sample galaxies are powered by AGNs. We first match the X-ray source catalog of 7 Ms Chandra observations in CDFS from Luo et al. (2017) with our sample of [O iii] ELGs to examine their X-ray properties. Of the 34 [O iii] ELGs, only one object is identified as an X-ray source (XID = 760) in the 7 Ms catalog. Its absorption-corrected intrinsic 0.5−7.0 keV luminosity is 1.12 × 1045 erg s−1. Moreover, this object has the highest [O iii] luminosity LO III = 1044.2 erg s−1, as well as highest stellar mass M* = 1011.4 M⊙ (see Table 3). No other X-ray counterparts are found in the 7 Ms catalog for the remaining [O iii] ELGs in our sample. The CIGALE results also show that the majority of our [O iii] ELGs contain no or a negligible AGN component. Including the X-ray source, six sample galaxies in our sample have an AGN fraction of 0.1, while about half have no AGN fraction in the fitting.
Table 3. Physical Properties of 34 Sample [O iii] Emitters
| ID | zphot | zspec | Ta | U − Vb | V − Jc | EW[O iii] rest |

|

| β | AFUV | AV |

|
|---|---|---|---|---|---|---|---|---|---|---|---|---|
| (mag) | (mag) | (Å) | (M⊙) | (M⊙ yr−1) | (mag) | (mag) | (erg s−1) | |||||
| 1 | 3.260 | ⋯ | 3 | 0.36 | 0.32 | 94.64 ± 36.60 | 9.43 ± 0.37 | 1.40 ± 0.32 | −0.48 ± 0.29 | 1.57 ± 0.35 | 0.49 ± 0.27 | 42.77 ± 0.13 |
| 2 | 3.256 | 3.083 | 3 | 0.70 | 0.54 | 133.52 ± 25.26 | 10.03 ± 0.28 | 1.52 ± 0.44 | −0.40 ± 0.31 | 2.22 ± 0.56 | 0.67 ± 0.43 | 43.09 ± 0.06 |
| 3 | 3.254 | ⋯ | 4 | 0.46 | 0.07 | 233.71 ± 41.70 | 9.48 ± 0,39 | 1.71 ± 0.27 | −0.24 ± 0.26 | 1.67 ± 0.47 | 0.74 ± 0.38 | 43.45 ± 0.04 |
| 4 | 3.260 | ⋯ | 5 | 0.51 | 0.21 | 141.08 ± 49.01 | 9.35 ± 0.40 | 1.29 ± 0.37 | −0.35 ± 0.29 | 1.67 ± 0.48 | 0.63 ± 0.38 | 42.98 ± 0.11 |
| 5 | 3.254 | ⋯ | 3 | 0.62 | 0.79 | 79.96 ± 10.98 | 10.28 ± 0.37 | 2.34 ± 0.27 | 0.05 ± 0.11 | 2.66 ± 0.44 | 1.30 ± 0.35 | 43.55 ± 0.05 |
| 6 | 3.254 | ⋯ | 3 | 0.57 | 0.20 | 362.89 ± 58.42 | 9.42 ± 0.42 | 1.80 ± 0.28 | −0.20 ± 0.27 | 2.27 ± 0.59 | 1.08 ± 0.48 | 43.60 ± 0.03 |
| 7 | 3.256 | ⋯ | 2 | 0.50 | −0.01 | 291.15 ± 71.03 | 9.17 ± 0.44 | 1.44 ± 0.26 | ⋯ | ⋯ | 0.68 ± 0.35 | 43.10 ± 0.05 |
| 8 | 3.254 | ⋯ | 3 | 0.53 | 0.34 | 138.95 ± 18.62 | 9.77 ± 0.34 | 2.03 ± 0.22 | −0.36 ± 0.20 | 2.65 ± 0.44 | 0.95 ± 0.34 | 43.39 ± 0.04 |
| 9 | 3.256 | ⋯ | 3 | 0.42 | 0.03 | 196.07 ± 56.84 | 9.22 ± 0.35 | 1.26 ± 0.30 | −0.67 ± 0.26 | 1.61 ± 0.32 | 0.45 ± 0.25 | 42.93 ± 0.08 |
| 10 d | 3.256 | ⋯ | 2 | 1.61 | 0.93 | 213.02 ± 5.69 | 11.36 ± 0.16 | 2.01 ± 0.18 | ⋯ | ⋯ | 0.79 ± 0.16 | 44.24 ± 0.01 |
| 11 | 3.256 | ⋯ | 3 | 0.65 | 0.36 | 255.78 ± 78.04 | 9.29 ± 0.57 | 1.46 ± 0.23 | 0.08 ± 0.20 | 2.23 ± 0.56 | 1.30 ± 0.45 | 43.22 ± 0.07 |
| 12 | 3.253 | ⋯ | 2 | 0.66 | 0.19 | 278.28 ± 63.18 | 9.41 ± 0.52 | 1.48 ± 0.25 | ⋯ | ⋯ | 0.89 ± 0.38 | 43.32 ± 0.05 |
| 13 | 3.254 | 3.232 | 2 | 0.85 | 0.71 | 483.14 ± 44.47 | 10.15 ± 0.54 | 2.32 ± 0.15 | 0.19 ± 0.06 | 3.12 ± 0.42 | 1.87 ± 0.35 | 44.17 ± 0.01 |
| 14 | 3.253 | 3.244 | 5 | 0.49 | 0.23 | 172.30 ± 53.99 | 9.40 ± 0.40 | 1.42 ± 0.34 | −0.23 ± 0.28 | 1.71 ± 0.54 | 0.74 ± 0.43 | 43.10 ± 0.09 |
| 15 | 3.253 | 3.248 | 4 | 0.33 | 0.26 | 159.33 ± 39.93 | 9.37 ± 0.42 | 1.51 ± 0.30 | −0.30 ± 0.26 | 1.42 ± 0.36 | 0.57 ± 0.28 | 43.31 ± 0.07 |
| 16 | 3.256 | ⋯ | 3 | 0.55 | 0.14 | 180.40 ± 63.89 | 9.30 ± 0.44 | 1.25 ± 0.33 | ⋯ | ⋯ | 0.64 ± 0.39 | 42.96 ± 0.10 |
| 17 | 3.262 | ⋯ | 3 | 0.59 | 0.28 | 129.54 ± 38.17 | 9.50 ± 0.37 | 1.47 ± 0.31 | −0.44 ± 0.29 | 2.23 ± 0.50 | 0.76 ± 0.39 | 43.08 ± 0.09 |
| 18 | 3.254 | 3.225 | 4 | 0.48 | −0.01 | 317.15 ± 96.49 | 9.16 ± 0.49 | 1.29 ± 0.28 | −0.23 ± 0.28 | 1.42 ± 0.45 | 0.66 ± 0.36 | 43.09 ± 0.07 |
| 19 | 3.254 | ⋯ | 2 | 0.44 | 0.25 | 160.80 ± 63.35 | 9.37 ± 0.31 | 1.23 ± 0.24 | 0.08 ± 0.18 | 1.15 ± 0.28 | 0.60 ± 0.22 | 43.06 ± 0.11 |
| 20 | 3.254 | ⋯ | 1 | 0.89 | 0.47 | 97.56 ± 46.58 | 9.63 ± 0.36 | 1.33 ± 0.23 | ⋯ | ⋯ | 0.87 ± 0.27 | 43.30 ± 0.16 |
| 21 | 3.254 | ⋯ | 2 | 0.82 | 0.50 | 98.19 ± 17.73 | 9.98 ± 0.37 | 1.83 ± 0.22 | ⋯ | ⋯ | 1.04 ± 0.34 | 43.37 ± 0.06 |
| 22 | 3.243 | 3.208 | 3 | 0.38 | 0.04 | 112.46 ± 38.68 | 9.57 ± 0.31 | 1.26 ± 0.27 | −0.30 ± 0.41 | 0.54 ± 0.30 | 0.23 ± 0.23 | 42.85 ± 0.11 |
| 23 | 3.254 | 3.229 | 5 | 0.46 | 0.04 | 158.91 ± 22.32 | 9.59 ± 0.36 | 1.72 ± 0.28 | −0.31 ± 0.24 | 1.52 ± 0.42 | 0.62 ± 0.33 | 43.28 ± 0.04 |
| 24 | 3.256 | ⋯ | 2 | 0.50 | 0.00 | 228.56 ± 40.00 | 9.43 ± 0.41 | 1.54 ± 0.30 | −0.57 ± 0.27 | 1.75 ± 0.40 | 0.59 ± 0.32 | 43.28 ± 0.05 |
| 25 | 3.251 | ⋯ | 3 | 0.76 | 0.56 | 127.21 ± 37.46 | 9.84 ± 0.39 | 1.54 ± 0.30 | −0.25 ± 0.29 | 2.87 ± 0.56 | 1.10 ± 0.46 | 43.24 ± 0.10 |
| 26 | 3.253 | ⋯ | 2 | 0.46 | 0.06 | 235.85 ± 63.68 | 9.30 ± 0.39 | 1.45 ± 0.25 | −0.15 ± 0.23 | 1.47 ± 0.40 | 0.70 ± 0.32 | 43.17 ± 0.06 |
| 27 | 3.254 | ⋯ | 2 | 0.83 | 0.62 | 162.22 ± 37.54 | 9.92 ± 0.47 | 1.72 ± 0.24 | −0.07 ± 0.25 | 2.80 ± 0.66 | 1.37 ± 0.54 | 43.54 ± 0.07 |
| 28 | 3.250 | 3.217 | 2 | 1.00 | 0.51 | 264.72 ± 20.56 | 10.51 ± 0.14 | 1.21 ± 0.32 | −0.24 ± 0.38 | 0.55 ± 0.36 | 0.24 ± 0.27 | 43.34 ± 0.02 |
| 29 | 3.252 | ⋯ | 2 | 0.64 | 0.28 | 108.63 ± 27.47 | 9.59 ± 0.30 | 1.67 ± 0.20 | ⋯ | ⋯ | 0.78 ± 0.23 | 43.17 ± 0.08 |
| 30 | 3.251 | ⋯ | 3 | 0.43 | 0.00 | 357.10 ± 194.67 | 8.96 ± 0.42 | 1.05 ± 0.22 | −0.10 ± 0.27 | 1.18 ± 0.34 | 0.59 ± 0.27 | 42.89 ± 0.11 |
| 31 | 3.260 | ⋯ | 3 | 0.62 | 0.29 | 121.42 ± 37.10 | 9.63 ± 0.44 | 1.45 ± 0.41 | −0.27 ± 0.31 | 1.86 ± 0.62 | 0.78 ± 0.50 | 43.11 ± 0.10 |
| 32 | 3.260 | ⋯ | 2 | 0.78 | 0.65 | 336.53 ± 92.54 | 9.56 ± 0.45 | 1.83 ± 0.17 | 0.14 ± 0.17 | 3.02 ± 0.53 | 1.79 ± 0.43 | 43.79 ± 0.06 |
| 33 | 3.254 | ⋯ | 1 | 1.09 | 0.56 | 74.43 ± 11.17 | 10.56 ± 0.38 | 1.93 ± 0.20 | ⋯ | ⋯ | 0.83 ± 0.22 | 43.58 ± 0.05 |
| 34 | 3.251 | ⋯ | 5 | 0.31 | 0.47 | 91.94 ± 18.67 | 9.16 ± 0.42 | 1.25 ± 0.15 | −0.03 ± 0.23 | 1.93 ± 0.58 | 0.96 ± 0.47 | 42.67 ± 0.04 |
Notes.
a Morphology Type: 1—UV faint; 2—compact; 3—diffuse/clumpy/tidal; 4—merger; 5—multiple components. b A typical error of U − V is 0.12. c A typical error of V − J is 0.24. d X-ray source (with XID = 760 in the Chandra 7 Ms catalog).Download table as: ASCIITypeset image
4.2. Morphologies
We use HST/ACS V606 and z850 imaging data from the GOODS and GEMS surveys to investigate the morphologies of our sample galaxies. For z ∼ 3.25, these two bands correspond to the rest-frame far-UV (FUV; 1402 Å) and near-UV (NUV; 2130 Å). Note that three [O iii] ELGs do not have V606 imaging data owing to the incomplete coverage of the GEMS observations. We adopt the HST/ACS F814W (I814) imaging data to replace V606 for making color images of these three objects.
Figure 3 shows the color images made with V606 and z850 for our [O iii] ELGs. A variety of morphologies can be seen. Here we define five morphological types in terms of the compactness and numbers of components of a galaxy. We assign the types of UV faint, compact, diffuse (including clumpy and tidal ones), merging, and multiple component with type ID 1–5, respectively. The morphological types of these 34 [O iii] ELGs are visually classified by three of us (R.W., J.R., and S.L.). The median of three classifications is adopted for each galaxy, and the results are presented in Table 3.
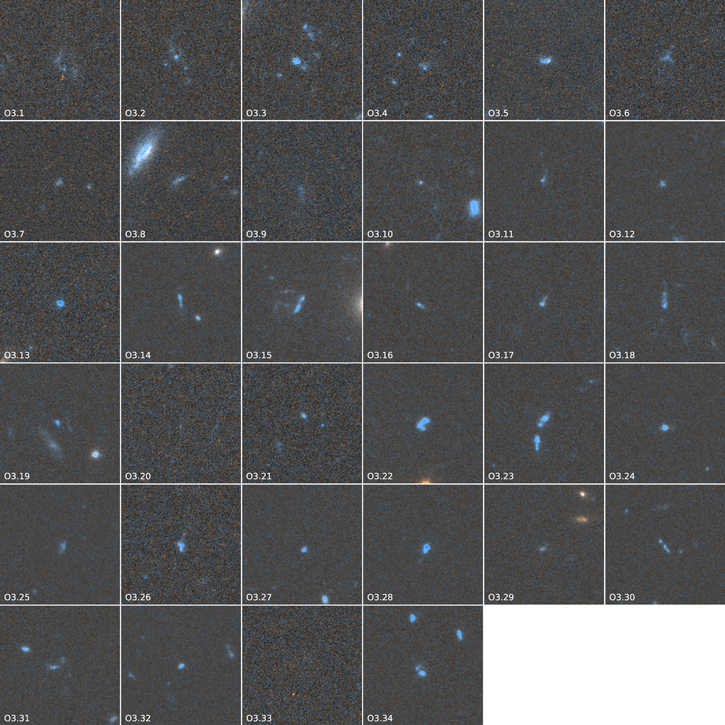
Figure 3. HST/ACS stamp images for our sample of 34 [O iii] ELGs. Each stamp is given in a size of 6″ × 6″, corresponding to 45 kpc × 45 kpc at z ∼ 3.25. These color images are made with HST/ACS V606 and z850 images from the GEMS and CANDELS surveys. Note that three images (ID = 6, 7, 8) are made with I814 and z850 images owing to the lack of V606 observations.
Download figure:
Standard image High-resolution imageOur results of morphological classifications show that about 6% (2/34) are too faint to be securely resolved in both V606 and z850; 35% (12/34) appear to be compact with R
e
< 03, and the majority of these compact ones are relatively bright; 38% (13/34) of our sample [O iii] ELGs have diffuse emission out to R = 1″ − 2″ (7–15 kpc) or have apparent tidal/clumpy features within 1″; 9% (3/34) look like mergers, with two obvious galactic nuclei connected by tidal bridges; and 12% (4/34) are pairs of two or three components with comparable colors and sizes and are separated by < 2″ without clear tidal bridges between them.
There are 20 sample ELGs having the HST/WFC3 J125 and H160 images from CANDELS. For z ∼ 3.25, these two bands correspond to the rest-frame NUV (2939 Å) and U (3624 Å). Figure 4 presents their color images made with the two-band data. We carry out morphological classification with the J125 and H160 images. The results are very similar to those based on the V606 + z850 images. Note that one object (ID = 20) is invisible in V606 and z850 and appears as a compact galaxy in J125 and H160. We take the morphological classifications based on V606 and z850 as our main morphology properties for these 34 [O iii] ELGs.
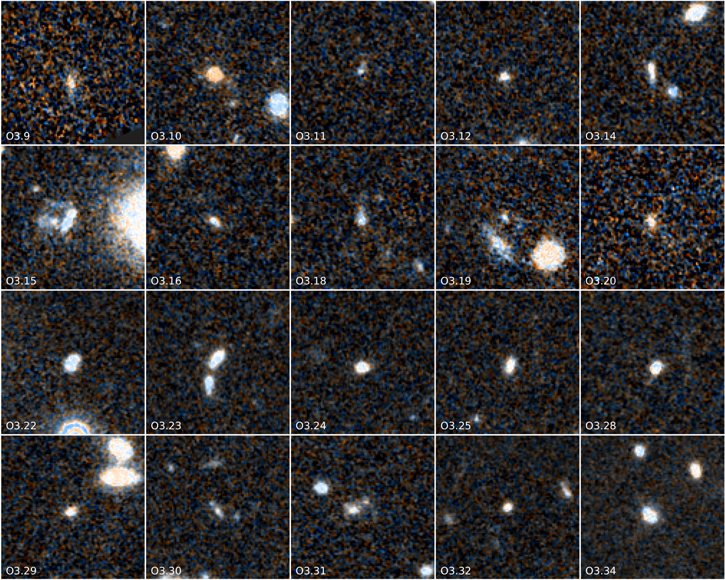
Figure 4. HST/WFC3 stamp images of 20 [O iii] ELGs in our sample. The color images are made with HST/WFC3 J125 and H160 images from CANDELS (the same size as given in Figure 3).
Download figure:
Standard image High-resolution imageWe point out that there are two UV-faint [O iii] ELGs (ID = 20, 33) being heavily attenuated by dust in rest-frame UV. As shown in Figure 2, these two objects’ SEDs show clear dust reddening, while several other objects (e.g., ID = 10, 12, 29) also exhibit reddening from their SEDs. We find that these galaxies are all compact, indicating that the compactness helps to maintain a dustier star-forming environment, although the rest-UV morphologies are very sensitive to young stellar populations with large uncertainties due to dust attenuation. We stress that our sample selection based on the H2S(1) and K s observations is able to pick these dusty [O iii] ELGs, which were missed by the previous studies based on the optical sample selections.
4.3. Colors and [O iii] EWs
The UVJ diagram is widely used to separate SFGs and quiescent galaxies (Williams et al. 2009; Brammer et al. 2011; Whitaker et al. 2011). Similarly, the U and V filters given in Maíz Apellániz (2006) and the J filter from the Two Micron All Sky Survey (2MASS) are adopted to derive the rest-frame U − V and V − J colors from the best-fit model SEDs of our [O iii] ELGs. The calculation is done with CIGALE (Boquien et al. 2019). Figure 5 shows the distribution of our [O iii] ELGs in the rest-frame U − V and V − J diagrams. The stellar masses derived from CIGALE are used to color-code the data points. The selection criteria to distinguish star-forming and quiescent galaxies are adopted from Williams et al. (2009). For a comparison, we also show a sample of galaxies with  M⊙) < 11 at 2.8 < z < 3.7 from the 3D-HST GOODS-South catalog (Skelton et al. 2014).
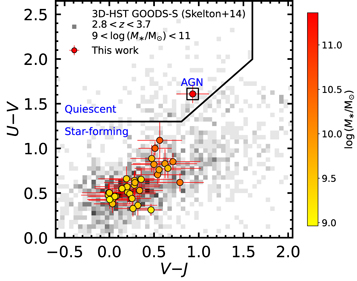
Figure 5. Rest-frame UVJ color diagram of 34 [O iii] ELGs color-coded with stellar mass. The gray density map shows the distribution of galaxies selected with  M⊙) < 11 at 2.8 < z < 3.7 from the 3D-HST GOODS-South catalog. The selection box to separate star-forming and quiescent galaxies is from Williams et al. (2009). The AGN source in the regime of quiescent galaxies is marked with a black square. Our sample [O iii] ELGs are mostly located at the blue end of the star-forming regime.
Download figure:
Standard image High-resolution imageIt is clear from Figure 5 that all of our sample [O iii] ELGs are located in the star-forming regime, except for the AGN host with U − V = 1.6 owing to strong dust attenuation. This confirms that the vast majority of our [O iii] sample galaxies are SFGs. About 56% (19/34) of the [O iii] ELGs with V − J < 0.3 are very blue, likely being little affected by dust attenuation or boosted in V by strong [O iii] emission. Meanwhile, the [O iii] ELGs of lower stellar masses tend to have bluer colors in both U − V and V − J, consistent with the results for the overall galaxy population (Skelton et al. 2014; Straatman et al. 2016).
As described in Section 2.1 (see also A14), the rest-frame EWs of our [O iii] samples are estimated using the formula from Geach et al. (2008) as
where  and
and  are the widths of the narrow- and broadband filters and
  and
and  are the flux densities in these two bands. The estimated EWs are listed in Table 3.
The [O iii] EWs of our sample ELGs vary over a wide range from 70 to 500 Å, with a median value of ∼200 Å, and 15% of them are larger than 300 Å. The relation between A V derived from CIGALE fitting and EW is shown in Figure 6. There are eight sample galaxies having A V > 1 mag, showing a relatively high fraction of dusty [O iii] ELGs. The majority of the [O iii] ELGs with A V < 1 mag have [O iii] EWs over 70−400 Å. Further discussion about the rest-frame EWs of our [O iii] ELGs will be presented in Section 6.2.
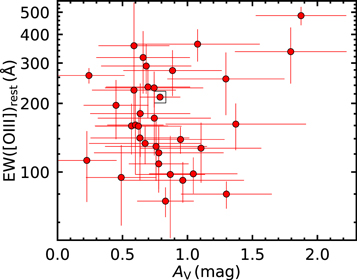
Figure 6. A V vs. rest-frame [O iii] EW for our sample of [O iii] ELGs. The majority of our sample galaxies have rest-frame [O iii] EWs in 100–300 Å with a median EW of 194 Å, suggestive of the presence of strong [O iii] emission line. For those with A V < 1 mag, the [O iii] EW varies from 70 to 400 Å.
Download figure:
Standard image High-resolution image4.4. Stellar Mass and SFR
Galaxy properties estimated through SED fitting with CIGALE are listed in Table 3. The stellar mass versus SFR relation of our [O iii] ELG sample is shown in Figure 7. For a comparison, we also include other samples of [O iii] ELGs at similar redshifts from the literature, including [O iii] emitters at z ∼ 3.2 from Suzuki et al. (2015) and at z ∼ 3.3 from Onodera et al. (2016, 2020).
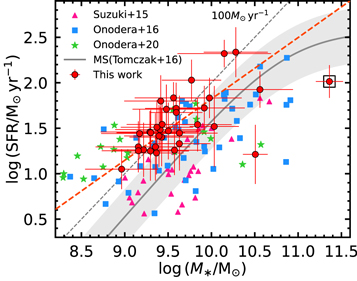
Figure 7. Relationship between stellar mass and SFR for our 34 [O iii] ELGs at z ∼ 3.25 (red circles), in comparison with [O iii] ELGs at z ∼ 3.2 from Suzuki et al. (2015; pink triangles), at z ∼ 3.3 from Onodera et al. (2016; blue squares), and at z ∼ 3.3 from Onodera et al. (2020; green stars). The red dashed line is the best fit to our 33 [O iii] ELGs (excluding the X-ray source), giving a best-fit slope of 0.69. The gray solid curve represents the best fit for the SFMS of SFGs at z ∼ 3.25 given in Tomczak et al. (2016), with the shaded area showing a 0.3 dex dispersion. The gray dashed line shows the timescale of 100 Myr for a galaxy doubling stellar mass. Most of our sample [O iii] ELGs lie above the SFMS with higher SFRs.
Download figure:
Standard image High-resolution imageWe perform an orthogonal distance regression (ODR) fit to the data points of our sample and estimate the dispersion. For our 33 [O iii] SFGs, the ODR fit gives a best-fit slope of 0.67 and a median dispersion of 0.15 dex, while the other three works hold a dispersion of 0.16, 0.23, and 0.16 dex for Suzuki et al. (2015), Onodera et al. (2016), and Onodera et al. (2020), respectively. The solid gray curve shows the best-fit relation for the star-forming main sequence (SFMS) of SFGs at z ∼ 3.25 given in Tomczak et al. (2016), and the shaded area represents a dispersion of 0.3 dex. The gray dashed line denotes the timescale of 100 Myr for a galaxy doubling stellar mass, and the majority of our [O iii] sample SFGs are located around this line and mostly above the MS. It is clear that the majority of our [O iii] ELGs have relatively higher SFRs than typical SFGs of the same masses at similar redshifts. The dispersion of our sample galaxies is comparable to that of other [O iii] ELG samples.
In addition, compact SFGs tend to be found at the upper envelope of the SFMS (e.g., Barro et al. 2017; Gómez-Guijarro et al. 2019). Our [O iii] ELGs are mainly young and blue SFGs with strong star formation activities, and more than one-third of our sample galaxies are classified as compact ones in terms of their morphologies in the rest-frame UV. We thus argue that the compact [O iii] ELGs in our sample resemble compact SFGs at z ∼ 3.25 as young starburst galaxies with high SFRs.
4.5. Dust Attenuation
The empirical dust attenuation curve of Calzetti et al. (2000) is widely used for starburst galaxies. Noll et al. (2009) modified the Calzetti law by multiplying a power-law function with a slope of δ and adding a 2175 Å bump that is described by a Lorentzian-like Drude profile. We take the modified Calzetti law as the dust attenuation curve in our analysis and derive dust attenuation AV from the SED fitting with CIGALE. In practice, the stellar color excess E(B−V)star and attenuation curve slope δ are set as free parameters in the fitting.
From the best-fit results with CIGALE, we obtain E(B−V)star, δ, and the strength of the 2175 Å bump for each sample galaxy. We are able to estimate the attenuation at a given band using the global attenuation formula from Boquien et al. (2019) as

where Dλ is the Drude profile that describes the 2175 Å bump, and the last term renormalizes the curve so that E(B−V) remains equal to the input E(B−V) when δ ≠ 0. We then estimate the attenuation to the [O iii] λ5007 line AOIII with this equation, and the results are shown in Table 3.
It can be clearly seen from Figure 2 that the 2175 Å bump is present in the best-fit SEDs of seven sample galaxies (e.g., ID = 5 and 13). The 2175 Å bump is redshifted to around 9250 Å at z ∼ 3.25, corresponding to I and z850. These seven galaxies have relatively high SFRs and AOIII . Moreover, half of them are compact, and the other half are extended in morphology. We do not see a connection between the presence of the 2175 Å bump and galaxy morphology among these z ∼ 3.25 [O iii] ELGs.
Previous studies reported that the 2175 Å bump is commonly seen in SFGs up to z ∼ 2.6 (Buat et al. 2011; Wild et al. 2011; Shivaei et al. 2020; Kashino et al. 2021). Noll et al. (2009) pointed out that at least 30% of SFGs at 1 < z < 2.5 exhibit a significant 2175 Å bump. In our SED fitting, the 2175 Å bump is introduced when the z850 flux is lower than the I flux in an SED. We caution that either an overestimate of the I flux or an underestimate of the z850 flux might demand a stronger 2175 Å bump in the models for a better fit. We examine the 2175 Å bump of those best-fit SEDs, finding that most of the seven sample galaxies have a higher I flux than the z850. Due to the lack of spectroscopic and more photometric data, it is difficult to securely confirm the 2175 Å bump. More efforts are necessary to investigate the origin of the 2175 Å bump in z ∼ 3.25 [O iii] ELGs.
We estimate AFUV at 1500 Å with Equation (3) and show the correlation between AFUV and UV slope β in Figure 8. There are eight sample galaxies that are compact (R < 01), faint, or nearly invisible in the rest-frame UV (see Figure 3), indicating a highly obscured environment around these galaxies. In addition, these sources also show upper limits in both U and B in their SEDs (see Figure 2); therefore, the UV slope β becomes meaningless for such a case. Thus, these eight sources are not included in Figure 8. The UV slope β is often used as a measure of dust obscuration in the sense that a redder UV slope (a higher β) is linked to a higher dust attenuation (Meurer et al. 1999). From Figure 8, however, we show that our sample galaxies do not exhibit a clear correlation between β and AFUV. As can be seen, some of our sample galaxies are barely visible in the rest-frame FUV owing to the heavy dust attenuation, and the estimates of β and AFUV could be significantly biased by the leaking UV radiation.
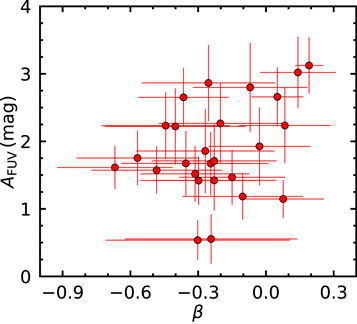
Figure 8. UV slope β vs. dust attenuation in the FUV AFUV for our sample of 26 [O iii] ELGs. Eight faint sources with upper limits in both U and B are ignored since the measurements of their AFUV and β are largely uncertain. The scatter is large owing to the lack of UV photometric data.
Download figure:
Standard image High-resolution image4.6. [O iii] Luminosity
Following Ly et al. (2011), we estimate the line flux of [O iii] λ5007 from the narrowband excess using

where F[OIII] is the integrated line flux of [O iii] given in units of erg s−1 cm−2, and fNB and  refer to fluxes in H2S(1) and K
s
, respectively, given in the units of erg s−1 cm−2 Å−1. The bandwidths are ΔNB = 293 Å and ΔK
s
= 3250 Å. We note that our sample was selected with EW > 50 Å and the 5σ detection limits are H2S(1) = 22.8 mag and K
s
= 24.8 mag. The detection limit for the [O iii] emission line is then estimated to be > 2.5 × 10⁻¹⁷ erg s−1 cm−2. These luminosities are corrected for dust attenuation with AOIII
. We calculate the [O iii] line luminosity for our sample galaxies and present them in Table 3.
refer to fluxes in H2S(1) and K
s
, respectively, given in the units of erg s−1 cm−2 Å−1. The bandwidths are ΔNB = 293 Å and ΔK
s
= 3250 Å. We note that our sample was selected with EW > 50 Å and the 5σ detection limits are H2S(1) = 22.8 mag and K
s
= 24.8 mag. The detection limit for the [O iii] emission line is then estimated to be > 2.5 × 10⁻¹⁷ erg s−1 cm−2. These luminosities are corrected for dust attenuation with AOIII
. We calculate the [O iii] line luminosity for our sample galaxies and present them in Table 3.
Figure 9 shows the relation between SFR and [O iii] luminosity. A strong correlation is seen. Such a correlation has been reported before (e.g., Straughn et al. 2009; Villa-Vélez et al. 2021). It is also clear that most of our [O iii] ELGs have dust-corrected luminosities in the range of 1042.6−1043.6. In order to show the representativeness of luminosity for our [O iii] ELGs, the luminosity functions of [O iii] ELGs at z ∼ 3.24 from Khostovan et al. (2015) are adopted for comparison. Note that the luminosity function parameter results in their work are uncorrected for dust and AGN contribution owing to the undeveloped roles of dust on emission lines at the high-z universe. The characteristic luminosity of [O iii] ELGs at z ∼ 3.24 in Khostovan et al. (2015) is  erg s−1, while the median value of the uncorrected luminosity of our [O iii] sample is 1042.73 erg s−1, showing a variance of 0.1 dex. The similarity in uncorrected [O iii] luminosity indicates that our [O iii] sample shows a typical property of luminosity at this redshift.
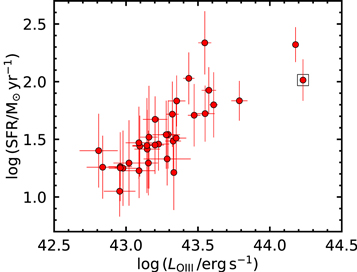
Figure 9. Relationship between [O iii] luminosity and SFR. The [O iii] luminosities are corrected for dust attenuation obtained from CIGALE. It is clear that SFR increases with [O iii] luminosity in a statistic manner.
Download figure:
Standard image High-resolution image5. An Overdensity Traced by [O iii] ELGs
Figure 10 shows the spatial distribution of our sample of 34 [O iii] ELGs. It is obvious that they are strongly clustered and form an overdensity. We estimate its overdensity factor as δgal = Ngroup/Nfield − 1. The effective detection area of our sample is 383 arcmin2. The narrowband filter H2S(1) (λ c = 2.130 μm, Δλ = 0.0293 μm) covers a redshift span of z = 3.254 ± 0.029 for [O iii] λ5007, corresponding to a radial scale of 50.9 comoving Mpc (cMpc). The total comoving volume of ECDFS is then estimated to be 41.53 cMpc3.
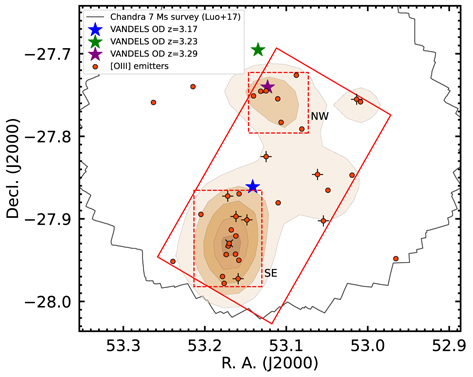
Figure 10. Spatial distribution of 34 [O iii] ELGs at z ∼ 3.25 in ECDFS. Red circles represent our [O iii] ELGs, and plus signs denote the spectroscopically confirmed ones. The cross marks the AGN source. The contour levels of the density map refer to [4, 8, 12, 16, 20] × the [O iii] emitter surface number density of general fields (2.7 × 10⁻² arcmin−2). The red solid rectangle covers 31 sources with an area of  . The southeast (SE) component (
 ) and the northwest (NW) component (
 ) cover 15 and 7 sources, respectively. The stars mark the locations of identified overdensities traced by Lyα emitters at similar redshifts in CDFS from the VANDELS survey (Guaita et al. 2020). Black solid lines show the coverage of Chandra 7 Ms X-ray observations.
Download figure:
Standard image High-resolution image5.1. General Field Number Density
In order to estimate the overdensity factor of [O iii] ELGs in ECDFS, we first estimate the number density in general fields. The High-redshift(Z) Emission Line Survey (HiZELS) provides a large sample of ELGs identified by narrowband excesses in COSMOS and UDS (Sobral et al. 2013). The NBK filter (λ c = 2.1210 μm, Δλ = 0.0210 μm) probes [O iii] ELGs at z ∼ 3.24, which is similar to our sample galaxies. Given that the improved photometric catalog is available in COSMOS, we cross the NBK -excess object catalog from Sobral et al. (2013) with the COSMOS2020 catalog (Weaver et al. 2022) to identify the [O iii] ELGs in COSMOS. Following the selection criteria used in Khostovan et al. (2015), we pick in total 159 NBK -excess objects with 2.8 ≤ zphot ≤ 4 to be [O iii] ELGs. We use this sample to estimate the number density of [O iii] ELGs at z ∼ 3.24 in general fields.
The selection criterion for ELGs (EW > 25 Å) from Sobral et al. (2013) differs from ours (EW > 50 Å). And the detection limits on narrow- and broadband depths also affect the selection for [O iii] emitters. We apply our [O iii] ELG selection criteria (EW > 50 Å, H2S(1) < 22.8 mag, and K s < 24.8 mag) to the selected 159 [O iii] emitters in COSMOS, given that 157 of the 159 [O iii] emitters meet our selection criteria. [O iii] ELGs at this redshift usually have a high EW; therefore, the difference between two EW cuts has a negligible impact on the selection. The effective sky coverage for these [O iii] ELGs is ∼ 1.6 deg2, while the NBK filter covers a comoving distance in the line of sight with 37.1 cMpc. So the total volume of these 157 [O iii] emitters is about 7.8 × 10⁵ cMpc3. We estimate the number density per volume of [O iii] ELGs in COSMOS to be 2.0 × 10⁻⁴ cMpc−3. Khostovan et al. (2015) showed an Hβ+ [O iii] number density of 2.3 × 10⁻⁴ cMpc−3 at 2.8 ≤ zphot ≤ 4 in COSMOS and UDS, while Forrest et al. (2017) presented the strong [O iii] ELG number density of 2.3 × 10⁻⁴ cMpc−3 at 2.5 ≤ zphot ≤ 4 in CDFS. This indicates that our number densities are comparable to other studies. So we take this to be the number density of z = 3.25 [O iii] ELGs in general fields.
5.2. Density Map and δgal
Our sample includes 34 [O iii] ELGs detected over 383 arcmin2 in ECDFS and a redshift span of z = 3.254 ± 0.029, giving a number density of [O iii] ELGs (4.8 ± 0.8) × 10−4 cMpc−3. We note that our sample [O iii] ELGs are located in a smaller area than the detection area. We construct a density map for our z ∼ 3.25 [O iii] ELGs and estimate the coverage area of the overdensity in ECDFS. Following Zheng et al. (2021), the detection area is divided into a grid of  cells, and the number of ELGs is counted in each cell to obtain the number density. A Gaussian kernel of
  (i.e., 1.9 cMpc at z ∼ 3.25) is used to convolve the grid and yield the density map as shown in Figure 10. The contour levels are drawn at 4, 8, 12, 16, and 20× the surface [O iii] emitter number density of general fields.
Clearly, the majority of our sample galaxies are located in the central region of ECDFS. The red solid rectangle in Figure 10 encloses 31 [O iii] ELGs over an area of 170.7 arcmin2 ( ). The density map of [O iii] ELGs consists of two components: one southeast (SE) composed of 15 [O iii] ELGs over 35.0 arcmin2 (
 ), and the other northwest (NW) with seven sample galaxies over 19.4 arcmin2 (
 ). Four spectroscopically identified [O iii] ELGs are also located in the SE component, confirming that this overdensity region is located at z ∼ 3.25.
We then estimate the volume number density of [O iii] ELGs in these components. We note that the redshift span of z = 3.254 ± 0.029 used to calculate the radial scale may be too large for calculating the comoving volumes because our sample [O iii] ELGs unlikely fulfill the bandwidth of H2S(1) and the actual radial size of the [O iii] overdensity is smaller than 50.9 cMpc. Given that the available spec-z of our sample [O iii] ELGs are all at z < 3.255, the half of the redshift span covered by the H2S(1) filter (see Figure 1), we thus take half of the radial comoving distance (25.5 cMpc) to be the upper limit for the radial size of the [O iii] overdensity. On the other hand, the radial size of the overdensity is unlikely smaller than the minor axis of each component area, giving a lower limit of the radial comoving distance. Therefore, we take the lower and upper limits of the radial size to estimate the comoving volume for these three components.
The red solid rectangle area covers a comoving volume from 253 to 233 cMpc3. We then estimate the [O iii] overdensity to have a volume number density from (1.9 ± 0.4) × 10−3 cMpc−3 to (2.7 ± 0.5) × 10−3 cMpc−3, giving δgal in the range of [8.7 ± 2.0, 12.3 ± 2.8]. The SE component contains 15 objects in a comoving volume from 153 to 113 cMpc3, giving a volume number density from (4.6 ± 1.2) × 10−3 cMpc−3 to (12.1 ± 3.2) × 10−3 cMpc−3 and δgal in the range of [21.8 ± 5.7, 59.5 ± 16.9]. The NW component contains seven objects in the volume from 123 to 83 cMpc3, yielding a number density of (3.9 ± 1.7) × 10−3 cMpc−3 to (11.7 ± 5.0) × 10−3 cMpc−3. And the δgal of NW varies in the range of [18.2 ± 8.4, 57.1 ± 25.4]. The uncertainties are simply estimated by shot noise. These estimated overdensity factors confirm that our sample [O iii] ELGs in ECDFS reside in an overdensity.
5.3. Present-day Mass
The typical size of a protocluster at z = 3 is about 20 cMpc (Chiang et al. 2013). We estimate the expected total mass at z ∼ 0 for the overdensity components at z = 3.25 in ECDFS using

from Steidel et al. (1998). Here  is the mean comoving matter density of the universe, which equals
  ; δ
m
is the matter overdensity; and Vtrue = Vobs/C. From Steidel et al. (1998), Vobs is the observed comoving volume and C is a correction factor estimated using
; δ
m
is the matter overdensity; and Vtrue = Vobs/C. From Steidel et al. (1998), Vobs is the observed comoving volume and C is a correction factor estimated using  , where f = Ωm
z4/7 and f = 0.98 at z = 3.25. And δ
m
is linked to the galaxy overdensity by 1 + b
δ
m
= C(1 + δgal), where b is the [O iii] emitter bias factor. We adopt the linear bias b = 3.43 for [O iii] ELGs in the redshift range of 2–3 from Zhai et al. (2021) as the bias for [O iii] ELGs at z = 3.25.
, where f = Ωm
z4/7 and f = 0.98 at z = 3.25. And δ
m
is linked to the galaxy overdensity by 1 + b
δ
m
= C(1 + δgal), where b is the [O iii] emitter bias factor. We adopt the linear bias b = 3.43 for [O iii] ELGs in the redshift range of 2–3 from Zhai et al. (2021) as the bias for [O iii] ELGs at z = 3.25.
We calculate the correction factor C and matter overdensity δ m for two overdensity components. For the SE substructure, we obtain δ m = 4.33 and C = 0.27 for the lower limits and δ m = 2.67 and C = 0.47 for the upper limits. For the NW substructure, we obtain δ m = 4.26 and C = 0.27 for the lower limits and δ m = 2.39 and C = 0.51 for the upper limits. And for the entire structure, we get δ m = 1.83, 1.40 and C = 0.59, 0.67 for the lower and upper limits, respectively. So the present-day mass is then estimated to be ∼ 1.1 × 10¹⁵ M⊙ for the SE substructure and ∼ 4.8 × 10¹⁴ M⊙ for the NW substructure. And the present-day mass of the entire structure is ∼ 2.3 × 10¹⁵ M⊙.
Based on these estimates, we conclude that the overdensity traced by our [O iii] ELGs is indeed a massive protocluster of galaxies at z ∼ 3.25 in ECDFS. These two substructures are expected to become virialized at z = 0, with the SE substructure probably being a high-mass “Coma-type” cluster of ∼1015 M⊙ and the NW substructure forming an intermediate-mass “Virgo-type” cluster of (3–9) × 1014 M⊙. Moreover, the two substructures are separated by 21.8 cMpc, which is the characteristic size of a massive protocluster at z ∼ 3, and they probably merge into a more massive Coma-like galaxy cluster in the present day.
6. Discussion
6.1. Contribution of Hβ and [O iii] λ4959 Emission Lines
We take [O iii] λ5007 at z ∼ 3.25 as the emission line detected by the flux excess in the narrowband H2S(1). Given that Hβ and [O iii] λ4959 are close to [O iii] λ5007, it is possible that Hβ and [O iii] λ4959 might contaminate our sample selection.
We notice that the bandwidth of H2S(1) is too narrow to cover both Hβ and [O iii] lines simultaneously. Khostovan et al. (2015) pointed out that the [O iii] line dominates the population in Hβ +[O iii] luminosity function, with the fraction of Hβ emitters decreasing at the increasing Hβ +[O iii] line luminosity. Similarly, Suzuki et al. (2016) examined the contamination to [O iii] λ5007 at z = 2.23 and found that the contribution of Hβ is only ∼ 3%, while [O iii] λ4959's contribution is up to 25%. Our sample [O iii] ELGs have bright line luminosities at ∼3.25. We argue that the Hβ contribution is negligible in our sample.
The doublet [O iii] λ λ4959, 5007 are separated by Δλ = 204 Å when they shift to z ∼ 3.25, and enter the central wavelength of H2S(1). The two lines can both be covered by the H2S(1) filter (Δλ = 293 Å) for [O iii] emitters at 3.266 < z < 3.283, compared to the redshift span of 3.225 < z < 3.283 for [O iii] λ5007 alone. Therefore, our measurements of the line fluxes of [O iii] λ5007 could be overestimated by 25% owing to the contribution of [O iii] λ4959 if our [O iii] ELGs are in the redshift range of 3.266 < z < 3.283. Here a flux ratio of 3 is adopted between [O iii] λ5007 and [O iii] λ4959 (Suzuki et al. 2016). We note that seven targets in our sample have spectroscopic redshifts in the range of 3.20 < z < 3.25 and are spatially mixed with other sample galaxies, implying that our sample galaxies are most likely distributed at 3.225 < z < 3.25 and the contribution by [O iii] λ4959 should be ignorable. We thus argue that the [O iii] λ5007 emission line dominates our sample galaxies.
6.2. Evolution of Extreme [O iii] ELGs over z ∼ 3 − 4
The vast majority of z > 3 galaxies are star-forming, and those with strong emission lines are very common at high redshifts. Our sample [O iii] ELGs at z ∼ 3.25 are about 1–2 Gyr before the cosmic star formation peak and are expected to provide clues for understanding how galaxies grow and enhance star formation. The strong [O iii] emission lines can be generated from the ionized regions around the hot young massive stars in a galaxy. Galaxies with extremely strong [O iii] emission lines at this epoch are found to have preferentially lower metallicity and higher ionization parameters powered by intense star formation activities (Nakajima & Ouchi 2014). The most intense [O iii] ELGs are defined as extreme ELGs (EELGs) with a composite rest-frame EW([O iii]) of 803 ± 228 Å, while the less intense but still significant [O iii] ELGs are named strong ELGs (SELGs) with a composite EW([O iii]) of 230 ± 90 Å (Forrest et al. 2017).
The [O iii] EELGs at z ∼ 3–4, i.e., those with EW([O iii])rest > 500 Å, are widely studied in the literature (Forrest et al. 2017; Cohn et al. 2018; Forrest et al. 2018; Onodera et al. 2020; Tran et al. 2020; Tang et al. 2021a, 2021b). They are typically small with M* ∼ 108−109 M⊙ and SFR ∼20–50 M⊙ yr−1 (Maseda et al. 2014; Tran et al. 2020). At increasing stellar mass, EELGs tend to have higher metallicity and stronger continuum emission from evolved stellar populations. Tran et al. (2020) demonstrated that for EELGs with higher stellar masses, their [O iii] λ5007 EWs tend to decrease with relatively higher stellar continua at given star formation activities.
Our sample [O iii] ELGs are SELGs with a median EW ∼200 Å in the range of 70 Å < EW([O iii])rest < 500 Å. Our results support the scenario that strong [O iii] λ5007 emission reveals the early episode of intense star formation. Our sample galaxies have stellar masses larger than  M⊙) ∼ 9 and larger SFRs of 10–100 M⊙ yr−1, denoting that our [O iii] ELGs are more representative of the main population of SFGs than the [O iii] EELGs with EW([O iii])rest > 500 Å.
6.3. The [O iii] Overdensity in ECDFS
Protoclusters are considered as ideal laboratories to study galaxy properties in the dense environments, as well as the environmental effects on galaxy formation and evolution. Previous studies on z > 3 protoclusters mainly identify them with Lyα emitters (LAEs), Lyman break galaxies (LBGs), and submillimeter galaxies (SMGs). Up to date, there are more than 30 protoclusters reported at z > 3 with spectroscopically confirmed galaxies (see Harikane et al. 2019, for a review). These protoclusters are likely to form “Virgo-type” galaxy clusters at z = 0 with a total mass of (3–9) × 1014 M⊙.
Only a few overdensity structures have been reported at z > 3 traced with [O iii] emitters (Maschietto et al. 2008; Forrest et al. 2017). We show that our sample [O iii] ELGs reside in a massive overdense structure in ECDFS. The SE substructure spreads over an area of  , while the NW substructure covers an area of
  . This overdensity of [O iii] ELGs at z ∼ 3.25 is a new structure discovered in ECDFS. The SE and NW components have an overdensity factor of about 20–60 over different comoving volumes owing to the limits of radial comoving distance. These two substructures are expected to be virialized at z = 0 and probably form a massive cluster with ∼ 1.1 × 10¹⁵
M⊙ for SE and ∼ 4.8 × 10¹⁴
M⊙ for NW. And the two substructures probably merge into a more massive single Coma-like galaxy cluster with ∼ 2.3 × 10¹⁵
M⊙.
. This overdensity of [O iii] ELGs at z ∼ 3.25 is a new structure discovered in ECDFS. The SE and NW components have an overdensity factor of about 20–60 over different comoving volumes owing to the limits of radial comoving distance. These two substructures are expected to be virialized at z = 0 and probably form a massive cluster with ∼ 1.1 × 10¹⁵
M⊙ for SE and ∼ 4.8 × 10¹⁴
M⊙ for NW. And the two substructures probably merge into a more massive single Coma-like galaxy cluster with ∼ 2.3 × 10¹⁵
M⊙.
In ECDFS, there is one overdensity traced by extreme Hβ + [O iii] emitters at z ∼ 3.5 discovered by the ZFOURGE and GOODS-ALMA surveys (Forrest et al. 2017; Zhou et al. 2020). Forrest et al. (2017) found a redshift peak at z = 3.5 with EELGs and SELGs in the ZFOURGE catalog. The seventh nearest-neighbor measure is used to build the overdensities projected on the sky, revealing the densest region of extreme [O iii] emitters in ECDFS, with 53 member galaxies over a scale of 8.1 cMpc.
Maschietto et al. (2008) reported 13 [O iii] emitters around the radio galaxy MRC 0316−257 at z = 3.13. This radio-selected protocluster consists of 32 LAEs over a  region (Venemans et al. 2005). These 13 [O iii] emitters form an overdensity with δgal ∼ 2.5. Kuiper et al. (2012) found that MRC 0316−257 has a foreground structure at z = 3.10 traced by three spectroscopically confirmed [O iii] emitters. They pointed out that the two structures are unlikely part of a larger protocluster based on a two-dimensional Kolmogorov–Smirnov test. We identify two substructures in our z = 3.25 overdense structure traced by 34 [O iii] ELGs in ECDFS. We lack spectroscopic redshifts to see whether the NW substructure is located at the same redshift as the SE substructure. From the spatial distribution of our 34 [O iii] ELGs, the two substructures likely belong to the same large-scale structure.
A recent work from the VANDELS survey presented several overdensities traced by Lyα emitters at 2 < z < 4 in CDFS and UDS (Guaita et al. 2020). We take their overdensities near z = 3.25 for a comparison. As shown in Figure 10, the central locations of three overdensities at z = 3.17, 3.23, and 3.29 are overplotted in ECDFS. However, the spatial locations of the VANDELS Lyα overdensities are not exactly coincident with our SE and NW components. The spatial offsets between them could be explained by the systematic offsets between different populations from the density tracers, say, the [O iii] and Lyα emitters. [O iii] emitters are more massive and metal-rich, while the Lyα emitters are mostly low-mass and metal-poor. The typical present-day mass of the VANDELS overdensities is about 0.3 × 10¹³ M⊙, which is about a factor of two and three lower than our NW and SE components, respectively.
In addition, some of our sample [O iii] ELGs exhibit significant dust attenuation and high SFR, compared to normal SFGs at the same redshifts. This hints that star formation and metal enrichment in this overdensity are enhanced. No detection of extreme [O iii] ELGs (EW([O iii])rest > 500 Å) in this overdensity also supported the acceleration of galaxy evolution in the overdense environment, in which low-mass and low-metallicity starburst galaxies are deficient. However, protoclusters at similar redshifts have been found to have quiescent galaxies largely concentrated in the overdense region, probably due to the environmental quenching (Shi et al. 2021; McConachie et al. 2022). These hint that the evolutionary states of protoclusters largely decide the environmental impacts on the member galaxies at z > 3.
7. Summary and Conclusions
Using the deep narrowband H2S(1) and broadband K s imaging of ECDFS, we identify a sample of 34 [O iii] ELGs at z ∼ 3.25 and carry out an analysis of their physical properties. Using preexisting multiwavelength data, we construct SEDs from U to K s and perform SED fitting with CIGALE to obtain rest-frame UVJ colors, stellar mass, SFR, dust attenuation, [O iii] EW, and [O iii] luminosities. The sample [O iii] ELGs map an overdense structure that may be the progenitor of a Coma-like massive galaxy cluster at z ∼ 0. Our main results are summarized as follows:
- 1.The vast majority of our sample are SFGs with strong [O iii] emission lines. Compared with the extreme [O iii] ELGs of EW([O iii])rest > 500 Å, our sample galaxies have EW([O iii])rest ∼ 70–500 Å, are more massive with M* ∼ 109.0−1010.6 M⊙, and have higher SFRs of ∼ 10–210 M⊙ yr−1 compared to typical SFGs at the same masses. Only one target is identified as an AGN detected in the Chandra 7 Ms X-ray observations. According to the UVJ color–color diagram, the majority of our [O iii] ELGs are located at the blue end of the star-forming regime. Our sample [O iii] ELGs exhibit significant dust attenuation and high SFR compared to normal SFGs. Our results show that the NIR selection is able to pick a significant fraction of [O iii] ELGs with high dust attenuation (AV > 1 mag), and our sample is more representative of the main population of SFGs at z ∼ 3–4 in comparison with the extreme [O iii] ELGs with EW([O iii])rest > 500 Å.
- 2.With HST/ACS and WFC3 observations we show that z = 3.25 [O iii] ELGs have a variety of morphologies in the rest-frame UV and optical. We find that 38% (13/34) of our [O iii] ELGs appear to have a diffuse/clumpy/tidal shape and about 35% (12/34) are very compact with Re < 0
3. Three [O iii] ELGs are identified as mergers, and four are considered to be galaxy pairs with two galactic nuclei with similar color and size within a separation distance of 2″. Two [O iii] ELGs are too faint in the rest-frame UV to be recognized in morphology, likely due to heavy dust attenuation. And the large fraction of compact sources in our sample also tend to be located above the star formation main sequence of z ∼ 3 SFGs.
- 3.We find that our [O iii] ELGs trace an overdense structure at z = 3.25. This structure is composed of two substructures of scales of
 and 4
and 44 × 4
- 4.We stress that none of our sample [O iii] ELGs exhibit EW([O iii])rest > 500 Å. We argue that the lack of [O iii] EELGs is largely due to our sample of [O iii] ELGs residing in the overdense environment, in which star formation and chemical enrichment in galaxies are enhanced and low-mass and low-metallicity starburst galaxies are deficient.

This work is supported the National Science Foundation of China (12073078 and 12173088); the Major Science and Technology Project of Qinghai Province (2019-ZJ-A10); the science research grants from the China Manned Space Project with Nos. CMS-CSST-2021-A02, CMS-CSST-2021-A04, and CMS-CSST-2021-A07; and the Chinese Academy of Sciences (CAS) through a China-Chile Joint Research Fund (CCJRF No. 1809) administered by the CAS South America Centre for Astronomy (CASSACA). This research adopts data obtained through the Telescope Access Program (TAP), which is funded by the National Astronomical Observatories and the Special Fund for Astronomy from the Ministry of Finance.