Abstract
Using the photometric data from the Next Generation Fornax Survey, we find a significant radial alignment signal among the Fornax dwarf galaxies. For the first time, we report that the radial alignment signal of nucleated dwarfs is stronger than that of non-nucleated ones at the 2.4σ confidence level, and the dwarfs located in the outer region (R > Rvir/3; Rvir is the Fornax virial radius) show a slightly stronger radial alignment signal than those in the inner region (R < Rvir/3) at the 1.5σ level. We also find that the significance of the radial alignment signal is independent of the luminosities or sizes of the dwarfs.
1. Introduction
The major axes of massive galaxies usually align with the gravitational potential of their host large-scale structure, e.g., galaxy clusters/groups, filaments, sheets, etc., and thus provide clues to the coevolution of the galaxies and their parent large-scale structures. For the member massive galaxies in clusters/groups, galaxy alignments have two primary subclassifications, i.e., the radial alignment, and primordial alignment (also called direct alignment). The radial alignment, as the production of the tidal force of the parent cluster (e.g., Ciotti & Dutta 1994; Usami & Fujimoto 1997; Pereira et al. 2008; Rong et al. 2015a), means that the major axes of galaxies tend to point to the cluster center (i.e., the radial angles ϕ between the major axes of galaxies and radial directions tend to be zero; see also Figure 1 in Rong et al. 2015b), and therefore is tightly related to the locations of the member galaxies in the cluster and cluster dark matter profile such as the concentration and scale radius (e.g., Rong et al. 2015a). The primordial alignment is referred to as the alignment between the major axes of galaxies and the elongations of the host clusters. Since the axis of the central brightest cluster galaxy (BCG) or cD galaxy in a cluster of galaxies strongly coincides with the elongation of the parent cluster (e.g., Struble 1990; West 1994; Fuller et al. 1999), the primordial alignment of the cluster member galaxies is also referred to as the alignment between the major axes of these galaxies and BCG (i.e., the angles θ between the major axes of member galaxies and BCG tend to be zero; see also Figure 1 in Rong et al. 2015b). Primordial alignment has been used as a probe of the dynamical state of clusters (e.g., Plionis et al. 2003; Rong et al. 2015b) and surrounding large-scale filaments (Rong et al. 2016), and possibly can be used to constrain galaxy formation models and their interaction with large-scale structure (Hung et al. 2010). Galaxy alignments are also important contaminations in weak lensing measurements (Hirata & Seljak 2004). The ellipticity of a galaxy can be subject to physical effects that stretch it and orient it in preferential directions with respect to large-scale structure (Troxel & Ishak 2015), which can mimic the coherent galaxy alignments of gravitational lensing.
However, we still lack the alignment information of dwarf galaxies in clusters/groups due to the their extremely small sizes and dim surface brightness, and thus their discoveries are a challenge to many photometry surveys. The deep, multiwavelength Next Generation Fornax Survey (NGFS; Muñoz et al. 2015), covering the entire Fornax galaxy cluster out to its virial radius (Rvir ≃ 1.4 Mpc; Drinkwater et al. 2001), provides the u′, g′, and i′-band photometries (reaching point-source detections with S/N ∼ 5 at 26.5, 26.1, and 25.3 mag, respectively) obtained with the Dark Energy Camera (Flaugher et al. 2015) mounted on the 4 m Blanco telescope at Cerro Tololo Interamerican Observatory and J- and Ks-band photometry from VIRCam mounted on the 3.7 m VISTA at ESO’s Paranal Observatory (Sutherland et al. 2015). NGFS encompasses the unprecedented accuracy to study the properties of the extremely faint and low-mass objects (∼106M⊙) in the nearby cluster, including the stellar masses and ages of the nuclear star clusters (NSCs) in the nucleated dwarf galaxies (Ordenes-Briceño et al. 2018b), color distributions of NSCs and dwarf spheroids (Eigenthaler et al. 2018), dwarf clustering (Ordenes-Briceño et al. 2018a), and in particular morphologies of dwarfs. Further, since the morphologies of dwarfs are relevant to their properties and environments, e.g., the presence of NSCs, galactic luminosities/stellar masses, and their locations in galaxy clusters/groups (e.g., Roychowdhury et al. 2013; Sánchez-Janssen et al. 2019, 2010), it is reasonable to compare the alignment signals of the NGFS dwarfs with the different properties.
2. Alignments of the Fornax Dwarfs
2.1. Photometry
In our previous NGFS papers (Muñoz et al. 2015; Eigenthaler et al. 2018; Ordenes-Briceño et al. 2018a), we reported the detection of the extended sources in the Fornax cluster from the RGB full-color image; in total, there are 643 dwarf galaxies that are very likely to be the members of the Fornax cluster (according to their locations in the color–magnitude diagrams, morphologies, and sizes; see Eigenthaler et al. 2018 for details), including the known 299 ones from previous works (Ferguson 1989; Mieske et al. 2007). Among the 643 dwarfs, seven galaxies are ultradiffuse galaxies (UDGs; van Dokkum et al. 2015; Rong et al. 2017a). The sample includes 181 nucleated and 462 non-nucleated dwarfs ranging in the absolute i′-band magnitudes of ∼−17.5 ≲ Mi′ ≲ −8.5 mag.
The two-dimensional surface brightness profile for each dwarf is studied with GALFIT (v3.0.5 Peng et al. 2002), implementing a Sérsic profile by taking advantage of the iterative fitting method described in Eigenthaler et al. (2018); the best-fitting parameters, e.g., the magnitude, effective radius re, position angle (PA) and its error PA_error, etc., are obtained. PAs in the g′ and i′ bands coincide with each other very well, yet the u′-band PAs of several dwarfs significantly deviate from their g′- and i′-band PAs. Since the g′ and i′ bands are more likely to indicate the stellar mass distribution while the u′ band is probably affected by the gas and current star formation, we prefer to use the i′-band PAs to test the alignments. The radial angles ϕ and PAs θ of the dwarfs, used to quantitatively test the radial and primordial alignments, are then calculated from the i′-band PAs and locations of the dwarfs, as well as the PA of the BCG of Fornax, NGC 1399 (with an axis ratio of b/a ≃ 0.85 and PA ≃ 110°; Schuberth et al. 2010).
2.2. Radial Alignment Test
We investigate the possible radial alignment signal for the Fornax dwarfs, abandoning the 94 with b/a ≥ 0.9 or large PA_error > 10°. The distribution of the radial angles ϕ (RAD) of the dwarfs is shown as the dashed–dotted histogram in panel (A) of Figure 1. We use the p values returned from the Kolmogorov–Smirnov test (denoted as p (K-S)) and the Kuiper test (denoted as p (K)) to detect the deviation of RAD from a uniform distribution; analogous to the work of Niederste-Ostholt et al. (2010), we also utilize the ratio α14 between the numbers of galaxies with ϕ < 30° and ϕ > 30° to quantitatively assess the significance of the alignment signal (a uniform distribution corresponding to α ≃ 0.5, while the radial alignment corresponds to α ≫ 0.5). We find that, for the entire Fornax dwarf sample, p (K-S) ∼ 10−5, p (K) ∼ 10−6, and α ≃ 0.71 ± 0.06, suggesting a radial alignment of the Fornax dwarfs. We also test the alignment of the seven Fornax UDGs; the ratio α ∼ 0.75 ± 0.57 indicates no significant radial alignment among the Fornax UDGs due to the large uncertainty. This result is inconsistent with the findings of Venhola et al. (2017), but different from that of UDGs in the Coma cluster (Yagi et al. 2016), where the member UDGs are found to be tidally stretched toward the BCG.
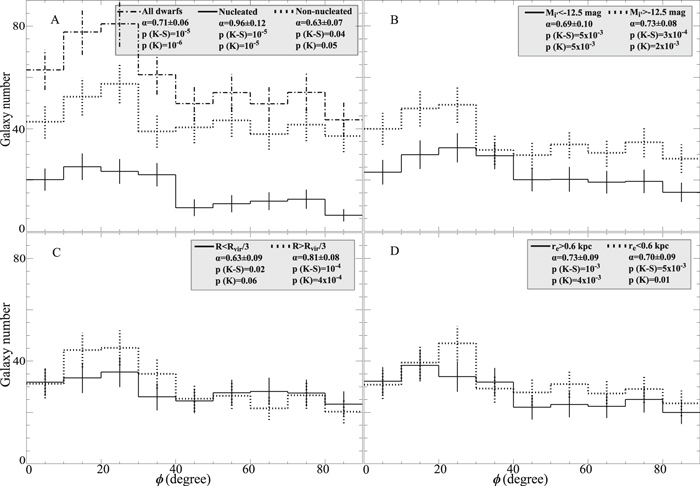
Figure 1. Panel (A): RADs for all of the dwarfs (dashed–dotted), nucleated (solid) and non-nucleated (dotted) dwarfs in the Fornax cluster. Panel (B): RADs for the bright (Mi′ < −12.5 mag; solid) and faint (Mi′ < −12.5 mag; dotted) dwarfs. Panel (C): RADs for the inner-region (R < Rvir/3; solid) and outer-region (R > Rvir/3; dotted) dwarf samples. Panel (D): RADs for the large (re > 0.6 kpc; solid) and small (re < 0.6 kpc; dotted) dwarfs. Hereafter, the error bars in the angle bins of each distribution are always estimated with the bootstrap methodology. p(K-S) and p(K) show the p values from the K-S test and Kuiper test, respectively.
Download figure:
Standard image High-resolution imageSánchez-Janssen et al. (2019) found that the morphologies of dwarf galaxies depend on the presence of NSCs and galaxy luminosities. Therefore, we divide the NGFS dwarfs into the nucleated and non-nucleated samples, and compare their RADs in panel (A) of Figure 1. The α and p values for the different dwarf samples are also listed in Table 1 for comparison. The radial alignment signal of the nucleated dwarfs (α ≃ 0.96 ± 0.12, p (K-S) ∼ 10−5, and p (K) ∼ 10−5) has higher significance than that of the non-nucleated dwarfs (α ≃ 0.63 ± 0.07, p (K-S) ∼ 4 × 10⁻², and p (K) ∼ 5 × 10⁻²) at ∼2.4σ level. The direct Kuiper test between the nucleated and non-nucleated samples also show a small p (K) ∼ 0.04, excluding the radial angles of the two samples to follow the same distribution.
Table 1. The α and p Values Returned from the K-S Test (p(K-S)) and Kuiper Test (p(K)) for the Distributions of ϕ and θ of the Different Dwarf Samples
| Dwarf Sample | Distribution of ϕ | Distribution of θ | ||||
|---|---|---|---|---|---|---|
| α | p(K-S) | p(K) | α | p(K-S) | p(K) | |
| All | 0.71 ± 0.06 | 10−5 | 10−6 | 0.52 ± 0.05 | 0.82 | 0.52 |
| Nucleated | 0.96 ± 0.12 | 10−5 | 10−5 | 0.56 ± 0.10 | 0.72 | 0.81 |
| Non-nucleated | 0.63 ± 0.07 | 4 × 10⁻² | 5 × 10⁻² | 0.50 ± 0.05 | 0.41 | 0.34 |
| Mi′ < −12.5 mag | 0.69 ± 0.10 | 5 × 10⁻³ | 5 × 10⁻³ | 0.59 ± 0.09 | 0.67 | 0.30 |
| Mi′ > −12.5 mag | 0.73 ± 0.08 | 3 × 10⁻⁴ | 2 × 10⁻³ | 0.47 ± 0.06 | 0.80 | 0.62 |
| R < Rvir/3 | 0.63 ± 0.09 | 2 × 10⁻² | 6 × 10⁻² | 0.53 ± 0.07 | 0.69 | 0.28 |
| R > Rvir/3 | 0.81 ± 0.08 | 10−4 | 4 × 10⁻⁴ | 0.52 ± 0.07 | 0.83 | 0.88 |
| re > 0.6 kpc | 0.73 ± 0.09 | 10−3 | 4 × 10⁻³ | 0.61 ± 0.08 | 0.41 | 0.19 |
| re < 0.6 kpc | 0.70 ± 0.09 | 5 × 10⁻³ | 10−2 | 0.45 ± 0.06 | 0.51 | 0.72 |
Download table as: ASCIITypeset image
The radial alignment signals of the bright (Mi′ < −12.5 mag) and faint (Mi′ > −12.5 mag) dwarf samples are also compared, as shown in panel (B) of Figure 1. We obtain α ≃ 0.69 ± 0.10, p (K-S) ∼ 5 × 10⁻³, and p (K) ∼ 5 × 10⁻³ for the bright ones and α ≃ 0.73 ± 0.08, p (K-S) ∼ 3 × 10⁻⁴, and p (K) ∼ 2 × 10⁻³ for the faint ones. Their α values that denote the significances of the radial alignment signals of the two samples differ at only the 0.3σ level; further, the direct Kuiper test between the bright and faint samples gives p (K) ∼ 0.43, suggesting that the significance of the radial alignment signal is independent of the dwarf luminosities.
The dwarfs are also split into the inner-region sample with the projected distances to the cluster center of R < Rvir/3 and the outer-region sample with R > Rvir/3, as well as the samples with large sizes and small sizes (with a threshold of the i′-band median re ∼ 0.6 kpc); their RADs are shown in panels (C) and (D) of Figure 1, respectively. Panel (C) reveals α ≃ 0.63 ± 0.09, p (K-S) ∼ 2 × 10⁻², and p (K) ∼ 6 × 10⁻² for the inner-region sample, and α ≃ 0.81 ± 0.08, p (K-S) ∼ 10−4, and p (K) ∼ 4 × 10⁻⁴ for the outer-region sample, respectively, suggesting a slightly stronger radial alignment signal in the outer region at about the 1.5σ level; the direct Kuiper test between the two samples also gives a relatively low p (K) ∼ 0.14. In panel (D), the larger dwarfs exhibit α ≃ 0.73 ± 0.09, p (K-S) ∼ 10−3, and p (K) ∼ 4 × 10⁻³, while the smaller dwarfs show α ≃ 0.70 ± 0.09, p (K-S) ∼ 5 × 10⁻³, and p (K) ∼ 10−2, suggesting that the signals differ at only the 0.2σ level; the direct Kuiper test between the large-size and small-size dwarf samples also reveal a high p (K) ∼ 0.68. It indicates that the significance of the radial alignment signal is also independent of the dwarf sizes.
3. Discussion
As clarified in Rong et al. (2015b), a fake radial alignment signal can be produced if the member galaxies exhibit primordial alignment (θ → 0), and simultaneously are distributed along the major axis of BCG; this fake signal may confuse us from identifying the real radial alignment of the Fornax dwarfs. Therefore, for the dwarf samples shown in the four panels of Figure 1, we also plot their distributions of θ in the corresponding panels of Figure 2. These dwarf samples show α ∼ 0.5, p(K-S) ≫ 0, and p(K) ≫ 0, suggesting no primordial alignment signal, regardless of the presence of NSCs, galactic locations, luminosities, or sizes; therefore, all of the detected radial alignment signals shown in Figure 1 are real.
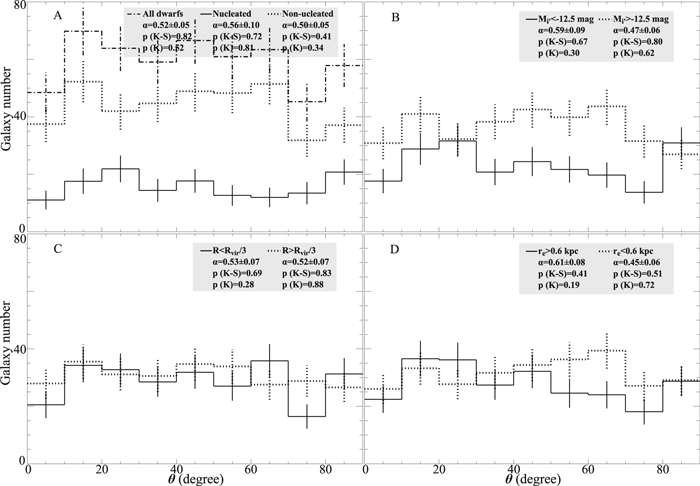
Figure 2. Panel (A): the distributions of θ (PADs) for all of the Fornax dwarfs (dashed–dotted), nucleated (solid) and non-nucleated (dotted) samples. Panel (B): PADs for the bright (solid) and faint (dotted) dwarfs. Panel (C): PADs for the inner-region (solid) and outer-region (dotted) dwarf samples. Panel (D): PADs for the large (solid) and small (dotted) dwarfs.
Download figure:
Standard image High-resolution imageThe relatively remarkable radial alignment signals of the Fornax dwarfs conflict with the previous results of Barkhouse et al. (2016), in which the authors found no statistically significant radial alignment among the red-sequence cluster dwarfs over a redshift range of 0 < z < 0.35. Barkhouse et al. (2016) also found no primordial alignment for their low-redshift, red-sequence cluster dwarfs, which is, however, consistent with our results. We also find that changing the different b/a cuts of dwarf samples from 0.9 to 0.85, 0.8, 0.75, and 0.7 does not change our conclusion.
The radial alignment signal is predominantly from the nucleated dwarfs, which may be due to the older stellar ages of the nucleated dwarfs as well as their earlier infall into the cluster, and thus longer time of stretching by the tidal force of Fornax (e.g., Rakos & Schombert 2004).
Generally, the radial alignment signal of the inner-region galaxies should be stronger than that of the outer-region galaxies, since the tidal force in the inner region is stronger (e.g., Rong et al. 2015a). However, in this work, the Fornax dwarfs located in R > Rvir/3 show a slightly stronger radial alignment signal than those located in R < Rvir/3. It is not caused by the dominance of nucleated dwarfs in either sample, since they occupy similar fractions of 29% and 31% in the inner- and outer-region samples, respectively; the nucleated and non-nucleated dwarfs also follow the similar projected distributions, as explored in panel (A) of Figure 3. As shown in the panels (B) and (C) of Figure 3, both of the outer-region nucleated and non-nucleated samples exhibit stronger alignment signals, compared with the corresponding inner-region samples (at ∼1σ levels). Indeed, the mechanism leading to the weaker alignment signal of the inner-region dwarfs is still unclear. One plausible explanation is that the inner-region dwarfs move too fast at the pericenters and their deformation timescales are longer than or comparable to the Keplerian timescales, so that the inner-region dwarfs may not have enough time to align their major axes. As indicated by Rong et al. (2015a), the deformation timescale of a galaxy is  , where G and ρG are the gravitational constant and mean galaxy density, respectively; whereas the Keplerian timescale characterizing the rate of change of the tidal force is
  , where L and M(L) are the three-dimensional (3D) distance from the galaxy to the cluster center and enclosed cluster mass within L, respectively. In order to estimate τdef/τK, we assume a Navarro–Frenk–White profile
 ![$M(L)=4\pi {\rho }_{0}{r}_{{\rm{s}}}^{3}[\mathrm{ln}(1+L/{r}_{{\rm{s}}})-\tfrac{L/{r}_{{\rm{s}}}}{1+L/{r}_{{\rm{s}}}}]$](https://content.cld.iop.org/journals/0004-637X/883/1/56/revision1/apjab3725ieqn3.gif) for the Fornax cluster with the scale radius rs ≃ 150 kpc, concentration c ≃ 9, and virial mass of ∼1014M⊙, as well as ρG ∼ 107M⊙/kpc3 (Drinkwater et al. 2001; Dugger et al. 2010; Oh et al. 2015; Rong et al. 2018a); therefore, for an innermost dwarf with L ∼ 100 kpc, τdef/τK ∼ 1 suggests that the rate of deforming the dwarf galaxy is comparable to the rate of change of the tidal force.
for the Fornax cluster with the scale radius rs ≃ 150 kpc, concentration c ≃ 9, and virial mass of ∼1014M⊙, as well as ρG ∼ 107M⊙/kpc3 (Drinkwater et al. 2001; Dugger et al. 2010; Oh et al. 2015; Rong et al. 2018a); therefore, for an innermost dwarf with L ∼ 100 kpc, τdef/τK ∼ 1 suggests that the rate of deforming the dwarf galaxy is comparable to the rate of change of the tidal force.
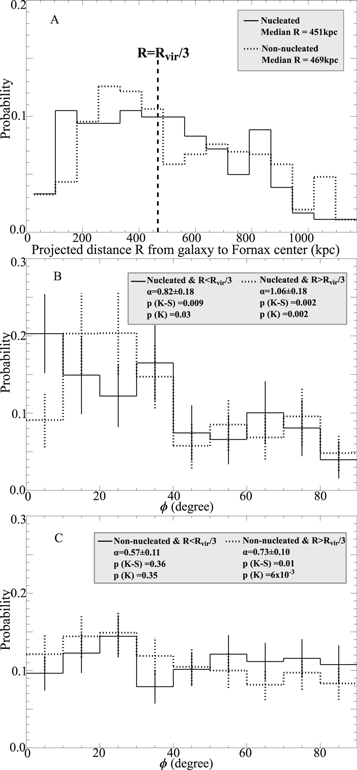
Figure 3. Panel (A): solid and dotted histograms denote the distributions of R of the nucleated and non-nucleated Fornax dwarfs, respectively; the dashed line highlights the threshold of R = Rvir/3; the median R of the two samples are also listed in the panel. Panel (B): RADs of the nucleated dwarfs located at R < Rvir/3 (solid) and R > Rvir/3 (dotted). Panel (C): RADs of the non-nucleated dwarfs located at R < Rvir/3 (solid) and R > Rvir/3 (dotted).
Download figure:
Standard image High-resolution imageThe weaker radial alignment of the inner-region dwarfs may also be attributed to projection effects, i.e., the so-called “inner-region” (R < Rvir/3) dwarf sample is more likely to be dominated by the projected galaxies that are actually distributed in front and behind the BCG with large 3D cluster-centric distances, compared with the outer-region sample. If we assume that all dwarfs are elongated toward BCG, the elongations of the front and back galaxies would lie roughly parallel to the line of sight; therefore, these projected dwarfs in the inner-region sample should tend to be round and show no significant radial alignment. As shown in Figure 4, we compare the apparent axis ratio b/a distributions of the inner-region and outer-region samples, and indeed find the marginally larger b/a values for the inner-region sample. However, it is also worth to note that the rounder shapes of the inner-region dwarfs may also be produced by tidal interactions rather than projection effects (e.g., Moore et al. 1996; Mayer et al. 2001, 2007; Errani et al. 2015; Rong et al. 2019); the stronger tidal interactions in the inner regions of clusters (i.e., the denser environments) can efficiently puff up dwarf galaxies and also lead to the larger apparent axis ratios. Unfortunately, with the photometry data alone, we actually cannot distinguish the two possible rounding mechanisms.
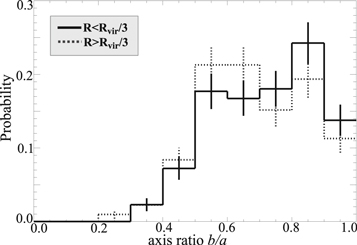
Figure 4. Axis ratio (b/a) distributions for the dwarfs in the projected cluster-centric distance regions of R < Rvir/3 (solid) and R > Rvir/3 (dotted), respectively.
Download figure:
Standard image High-resolution imageIn summary, we reported a significant radial alignment signal among the Fornax dwarfs with the NGFS data. For the first time, we found that the radial alignment signal depends on the presence of NSCs and locations of dwarfs in the cluster, but is independent of galaxy luminosities and sizes. The radial alignment signal of the nucleated dwarfs is stronger than that of non-nucleated ones at the 2.4σ level, and the dwarfs located in the outer region (R > Rvir/3) show a slightly stronger radial alignment signal than those in the inner region (R < Rvir/3) at the 1.5σ level. Further alignment studies for the faint dwarfs in other massive clusters are required to test our findings.
Y.R. acknowledges supports through FONDECYT Postdoctoral Fellowship Project No. 3190354, NSFC grant No. 11703037, and CAS-CONICYT Postdoctoral Fellowship Project CAS 16004. T.H.P. acknowledges support through FONDECYT Regular project 1161817 and CONICYT project Basal AFB-170002. M.A.T. is supported by the Gemini Observatory, which is operated by the Association of Universities for Research in Astronomy, Inc., on behalf of the international Gemini partnership of Argentina, Brazil, Canada, Chile, the Republic of Korea, and the United States of America. This work is also supported by CAS South America Center for Astronomy (CASSACA), Chinese Academy of Sciences (CAS).
This research has made use of the NASA Astrophysics Data System Bibliographic Services, the NASA Extragalactic Database, the SIMBAD database, operated at CDS, Strasbourg, France (Wenger et al. 2000). This research has made use of “Aladin Sky Atlas” (Bonnarel et al. 2000; Boch & Fernique 2014), developed at CDS, Strasbourg Observatory, France. Software used in the analysis includes, the Python/NumPy v.1.11.2 and Python/Scipy v0.17.1 (Jones et al. 2001; VanderPlas et al. 2012, http://scipy.org/), Python/astropy (v1.2.1; Astropy Collaboration et al. 2013, http://astropy.org/), Python/matplotlib (v2.0.0; Hunter 2007, http://matplotlib.org/), Python/scikit-learn (v0.17.1; Pedregosa et al. 2012, http://scikit-learn.org/stable/) packages. This research made use of ds9, a tool for data visualization supported by the Chandra X-ray Science Center (CXC) and the High Energy Astrophysics Science Archive Center (HEASARC) with support from the JWST Mission office at the Space Telescope Science Institute for 3D visualization. We also acknowledge the related literatures of Press et al. (1992), Paltani (2004), Rong et al. (2017b, 2018b), and Johnston et al. (2019).
Footnotes
- 14
The uncertainties of α are estimated with the bootstrap methodology. For the galaxy population in each distribution, we resample the galaxies 10,000 times, and obtain 10,000 α values; the mean value and standard deviation of the 10,000 values are treated as α and its uncertainty, respectively.