Abstract
Reionization is an inhomogeneous process, thought to begin in small ionized bubbles of the intergalactic medium (IGM) around overdense regions of galaxies. Recent Lyα studies during the epoch of reionization show evidence that ionized bubbles formed earlier around brighter galaxies, suggesting higher IGM transmission of Lyα from these galaxies. We investigate this problem using IR slitless spectroscopy from the Hubble Space Telescope (HST) Wide-Field Camera 3 (WFC3) G102 grism observations of 148 galaxies selected via photometric redshifts at 6.0 < z < 8.2. These galaxies have spectra extracted from the CANDELS Lyα Emission at Reionization (CLEAR) survey. We combine the CLEAR data for 275 galaxies with the Keck Deep Imaging Multi-Object Spectrograph and MOSFIRE data set from the Texas Spectroscopic Search for Lyα Emission at the End of Reionization Survey. We constrain the Lyα equivalent width (EW) distribution at 6.0 < z < 8.2, which is described by an exponential form,  , with the characteristic e-folding scale width (W0). We confirm a significant drop in the Lyα strength (i.e., W0) at z > 6. Furthermore, we compare the redshift evolution of W0 between galaxies at different UV luminosities. UV-bright (MUV < −21 [i.e., LUV > L*]) galaxies show weaker evolution with a decrease of 0.4 ( ± 0.2) dex in W0 at z > 6, while UV-faint (MUV > −21 [LUV < L*]) galaxies exhibit a significant drop of 0.7–0.8 (±0.2) dex in W0 from z < 6 to z > 6. If the change in W0 is proportional to the change in the IGM transmission for Lyα photons, then this is evidence that the transmission is “boosted” around UV-brighter galaxies, suggesting that reionization proceeds faster in regions around such galaxies.
Original content from this work may be used under the terms of the Creative Commons Attribution 4.0 licence. Any further distribution of this work must maintain attribution to the author(s) and the title of the work, journal citation and DOI.
1. Introduction
Reionization marks the last major phase transition of the universe, when the first stars and galaxies ionized the intergalactic medium (IGM) neutral hydrogen (H i) gas. Galaxies in the early universe are inherently coupled with the process of reionization, as the galaxies were likely the primary sources of ionizing photons (e.g., Robertson et al. 2015; McQuinn 2016; Finkelstein et al. 2019a; Dayal & Ferrara 2018) while the contribution from active galactic nuclei (AGN) activity could also play an important (though subdominant) role at z ≳ 6 (e.g., Matsuoka et al. 2018; Kulkarni et al. 2019; Dayal et al. 2020; Robertson 2021). Thus, observations of this epoch also provide key information for studying the dominant source of the ionizing photons: galaxies in the early universe. However, constraining the ionizing photon budget during the epoch of reionization (EoR) is still extremely difficult due to current observational limits as well as a poorly constrained ionizing photon escape fraction, which depends on the galaxy physical conditions (e.g., Finkelstein et al. 2012a, 2015, 2019b; Robertson et al. 2013, 2015; Bouwens et al. 2015, 2016; Kimm et al. 2019; Yoo et al. 2020; Ocvirk et al. 2021). Understanding the temporal and spatial evolution of reionization by tracing the IGM H i fraction provides a key constraint on the ionizing emissivity required from galaxies as a function of the redshift.
As Lyα photons are resonantly scattered by H i in the IGM, an analysis of Lyα can be used to trace the existence of H i gas in the IGM at different points in the history of the universe (e.g., Miralda-Escudé & Rees 1998; Rhoads & Malhotra 2001; Malhotra & Rhoads 2004; Dijkstra et al. 2014). This technique uses follow-up spectroscopic observations, targeting high-z candidate galaxies, to measure the strength of Lyα emission from galaxies in the reionization era. Initial studies using Lyα spectroscopy have found an apparent deficit of Lyα emission at z > 6.5 (e.g., Fontana et al. 2010; Pentericci et al. 2011; Finkelstein et al. 2013; Pentericci et al. 2014; Caruana et al. 2012, 2014; Curtis-Lake et al. 2012; Mallery et al. 2012; Ono et al. 2012; Schenker et al. 2012, 2014; Treu et al. 2012, 2013; Tilvi et al. 2014; Vanzella et al. 2014; Schmidt et al. 2016; De Barros et al. 2017; Fuller et al. 2020), implying an increasing H i fraction in the IGM from z ∼ 6 → 7, although other Lyα systematics with galaxy evolutionary features are a factor in these measurements (e.g., Finkelstein et al. 2012b; Yang et al. 2017; Tang et al. 2019; Trainor et al. 2019; Du et al. 2020; Hassan & Gronke 2021; Weiss et al. 2021).
Recent Lyα studies suggest a more complicated picture of reionization. For instance, Pentericci et al. (2018) provide Lyα fraction (fLyα
) measurements at z ∼ 6 and z ∼ 7 (fLyα
= NLAE/NLBG, where NLAE is the number of spectroscopically confirmed Lyα-emitting galaxies, and NLBG is the number of high-z candidate galaxies that were targeted in spectroscopic observations). Their results show a possible flattening or a steady increase in the redshift evolution the Lyα fraction from z ∼ 5 → 6 and a relatively smoother evolution from z ∼ 6 → 7, compared to previous studies (e.g., Stark et al. 2011; Tilvi et al. 2014), implying a more extended ending to reionization (this finding is also supported by Kulkarni et al. (2019)). Furthermore, while Zheng et al. (2017), Castellano et al. (2018), and Tilvi et al. (2020) report observations of an ionized bubble via Lyα observations at z ≳ 7, non/rare detections of Lyα in Hoag et al. (2019) and Mason et al. (2019) suggest a significantly neutral fraction in the IGM at z ∼ 7.5. Specifically, Hoag et al. (2019) report a high neutral fraction of  % at z ∼ 7.6. More recently, Jung et al. (2020) analyzed deep NIR observations in Great Observatories Origins Deep (GOODS)-N, suggesting a modestly ionized universe with the inferred IGM neutral fraction of
  % at z ∼ 7.6, lower than other Lyα studies at the same redshifts. Additionally, Hu et al. (2021) disclose a protocluster structure at z ∼ 6.9 that consists of 16 spectroscopically confirmed Lyα emitting galaxies. One way to reconcile these apparently contrasting recent findings is if reionization is complex and inhomogeneous, and/or if there are large spatial and temporal variations in the history of reionization.
Taken together, the evidence from recent studies suggests that Lyα visibility during the EoR may evolve differently in UV-bright and UV-faint galaxies (e.g., Matthee et al. 2015; Oesch et al. 2015; Zitrin et al. 2015; Roberts-Borsani et al. 2016; Stark et al. 2017; Zheng et al. 2017; Mason et al. 2018b). This is explained as UV-bright galaxies are likely located in highly ionized bubbles, which were created by a wealth of ionizing photons produced by those galaxies as well as a potentially larger number of nearby fainter galaxies (Finkelstein et al. 2019b; Larson et al. 2022). Endsley et al. (2021a) provide additional evidence for accelerated reionization around massive galaxies. Particularly, they find a higher Lyα detection rate at z ≃ 7 from massive galaxies with strong [O iii]+Hβ emission, which reflects enhanced ionizing photoproduction rates (e.g., Roberts-Borsani et al. 2016; Tang et al. 2019, 2021a; Endsley et al. 2021b), arguing for higher Lyα equivalent widths (EWs) from the strong [O iii]+Hβ emitting population as similar as shown at lower redshifts of z ≃ 2–3 (Tang et al. 2021b). This may be related to the galaxies’ specific star formation rates (sSFRs) and ionization (Backhaus et al. 2022; Papovich et al. 2022), although this remains tenuous as there is not yet any conclusive evidence for a significant enhancement of Lyman continuum escape fraction found for galaxies with higher [O iii]+Hβ galaxies at z ∼ 3 (Saxena et al. 2022). Therefore, it is prudent to look for indications that evolution of Lyα emission in galaxies depends on UV luminosity in the epoch of reionization.
In this study, we present an analysis of the CANDELS Lyα Emission At Reionization (CLEAR) observations in the CANDELS GOODS fields (Grogin et al. 2011; Koekemoer et al. 2011). As discussed below, CLEAR uses slitless IR spectroscopy from the HST WFC3. Therefore, the CLEAR data provide (unbiased) constraints on Lyα emission in galaxies at 6.0 < z < 8.2. This allows us to constrain the evolution of the Lyα EW in these galaxies. We use these data to study the evolution as a function of both the redshift and galaxy UV absolute magnitude. Section 2 describes the CLEAR high-z galaxy data set (data reduction, sample selection, and emission-line and continuum-detection search) and the additional Keck Deep Imaging Multi-Object Spectrograph (DEIMOS) and MOSFIRE observations from the Texas Spectroscopic Search for Lyα Emission at the End of Reionization Survey (Jung et al. 2018, 2020), finalizing the 6.0 < z < 8.2 galaxy data set for the Lyα analysis. In Section 3, we present our results, which include the measurements of the Lyα EW distribution and the IGM transmission to Lyα. We summarize and discuss our findings in Section 4. In this work, we assume the Planck cosmology (Planck Collaboration et al. 2016) with H0 = 67.8 km s−1 Mpc−1, ΩM = 0.308, and ΩΛ = 0.692. The Hubble Space Telescope (HST) F435W, F606W, F775W, F814W, F850LP, F105W, F125W, F140W, and F160W bands are referred to as B435, V606, i775, I814, z850, Y105, J125, JH140, and H160, respectively. All magnitudes are given in the AB system (Oke & Gunn 1983), and all errors presented in this paper represent 1σ uncertainties (or central 68% confidence ranges), unless stated otherwise. All EWs discussed in this paper represent rest-frame values, unless defined otherwise.
2. Data: 6.0 < z < 8.2 Galaxies
2.1. CLEAR HST/grism Survey
The CLEAR Experiment is a cycle 23 HST observing program (Program GO-14227, PI: C. Papovich), which observed 12 fields in the CANDELS GOODS fields to 10 to 12 orbit depth with the G102 grism in the HST/WFC3 camera. Each field was observed at three position angles (separated by >10 degrees) to properly correct galaxy spectra from contamination. The goal of the CLEAR survey is to measure the distribution of Lyα emission in galaxies during the epoch of reionization at 6.0 < z < 8.2. The feasibility of detecting Lyα emission from HST/WFC3 grism observations has been proved in previous studies, such as Schmidt et al. (2016) from the Grism Lens-Amplified Survey from Space (Treu et al. 2015), and Tilvi et al. (2016) and Larson et al. (2018) from the Faint Infrared Grism Survey (Pirzkal et al. 2017). The data set also provides constraints on the stellar populations of 1 < z < 2 galaxies. Previous work on the metallicities, ages, and formation histories of massive galaxies at 1 < z < 2 has been published in Estrada-Carpenter et al. (2019, 2020), and the gas-phase metallicity gradients of star-forming galaxies are investigated in Simons et al. (2021). Also, Cleri et al. (2020) studied Paschen-β as a star-formation-rate indicator in low-redshift galaxies, using the CLEAR data set.
The data set has been extended to include all publicly available HST/WFC3 G102 and G141 grism observations in the CLEAR fields. For processing the grism observations, the grism redshift and line analysis software Grizli (Brammer 2019) have been utilized; the software retrieves the raw observations and performs astrometric alignment, contamination modeling, extracting spectra, and fitting continuum and emission-line models. The full details of the grism data reduction and spectral extractions are described in Estrada-Carpenter et al. (2019, 2020) as well as Simons et al. (2021).
While the primary CLEAR spectral extractions were made for galaxies based on the 3D-HST GOODS catalog (Skelton et al. 2014), we extracted the CLEAR spectra of high-z galaxies based on the updated HST CANDELS photometry and its segmentation maps from Finkelstein et al. (2022). The photometric selection of high-z candidate galaxies was done following the criteria described in Section 3.2 in Finkelstein et al. (2015). In brief, the selection is based on the full photometric redshift probability distribution functions of P(z) calculated by EAZY (Brammer et al. 2008) rather than simply using the best-fit redshifts. This includes, for example, the integral of P(z) under the primary redshift peak must be >70% of the total P(z) (for the full details, refer to Finkelstein et al. 2015). Additionally, visual inspection was performed for removing any artifacts (e.g., diffraction spikes, nearby bright sources) and checking the quality of photometry. This resulted in 180, 6.0 < zphot < 8.2 galaxies in the CLEAR fields. However, checking the quality of the extracted spectra, in total 148 CLEAR spectra were collected after removing 32 spectra due to technical issues in treating the removal and corrections from contaminating spectrum from nearby galaxies using Grizli (e.g., we removed objects where residuals from contaminating spectra from nearby bright galaxies were too severe compared to the expected continuum or line flux for our objects).
2.2. Emission-line and Continuum Detection in CLEAR
In order to search Lyα emission lines or continuum objects detected from these high-z targets, we utilized the grism spectroscopy from the full sample of the CLEAR spectra of 148, 6.0 < zphot < 8.2 galaxies. In this subsection, we describe the process we used to to determine if any emission lines or continuum spectra are present in the spectra of each galaxy.
2.2.1. Emission-line Search
We first found 24 galaxies from the Grizli run with candidate emission lines detected at significance >3σ from their co-added one-dimensional (1D) spectra. For these galaxies, we inspected their two-dimensional (2D) spectra and those of nearby objects to see if the emission lines are a result of contamination. Additionally, we attempted to secure detections from multiple position angles (PAs), requiring >2σ detections in the data taken at different orientations. This assists in our effort to rule out artifacts in the data including contamination from nearby objects (as these will be different in each PA).
Our emission-line search identified only one tentative Lyα detection at high confidence. This object (GN4_5461276) shows an emission line that would correspond to zgrism = 6.513 ± 0.005 with a detection significance of ≃ 4σ. All other candidates showing potential Lyα emission either correspond to residuals of nearby contaminating sources (16 candidates) or possible spurious sources that show the emission in only a single PA (7 candidates). In the case of the emission line detected in GN4_5461276, the HST ACS z850-band data challenges this measurement: if the emission line (interpreted as Lyα) is real, then it should contribute 37 ± 8 nJy to the z850-band flux. However, the measured z850-band flux of this galaxy in the HST/CANDELS observations is only fν (z850) = 6.3 ± 8.3 nJy. Thus, it may require further observational evidence for validating this tentative detection as Lyα, and we do not include it in the remainder of our analysis for the Lyα EW distribution and the IGM transmission. Instead, we discuss the details of this tentative detection in the Appendix. Additionally, we suggest that it would be crucial to include an automated and improved removal process of contaminating emission-line sources in slitless spectroscopic surveys. This will be very important in the study of emission lines in data from next-generation space telescopes such as the James Webb Space Telescope (JWST), Euclid, or the Nancy Grace Roman Space Telescope (NGRST).
2.2.2. Continuum-detection Search
We also inspected 42 sources with potential continuum detections identified from our visual inspection of the co-added 1D and 2D grism spectra. We vetted these further to determine if they are bona fide continuum sources. First, we estimated Y105, J125, or H160 magnitudes from the CLEAR spectra of the 42 candidates by applying the HST filter transmission curves to the reduced co-added 1D CLEAR spectra and compared them to the known HST magnitudes of the sources from the HST/CANDELS photometry from Finkelstein et al. (2015). We required agreement within the 2σ uncertainties in this comparison. The continuum flux is estimated by summing all fluxes after the continuum break, and the continuum break is located where the estimated signal-to-noise (S/N) value of the continuum flux is maximized. Thus, we required a secure (i.e., >3σ) continuum detection redward the Lyα continuum break measured from the Grizli-extracted 1D spectrum.
From the selection above, we obtained 15 candidates that satisfy the continuum selection criteria. On this subset, we then performed additional visual inspections of the galaxies’ 2D and 1D spectra taken at the different PAs to check for possible contamination from nearby sources. From these inspections, we identified contaminating sources in 6 of these 15 candidates, and no other candidates display clear continuum detection in multiple PAs due to the limited observing depth (as the depth in each individual PA is ∼1/3 the exposure time of the total). In general, therefore, the depth of the data is insufficient for reliable detection of the continuum in our target galaxies of J125 ≳ 26 at individual PA depths (∼3 orbits). However, we identify possible continuum in one source (GN2_23734), which we discuss in the Appendix. This galaxy shows possibly faint continua in both G102 and G141 spectra. However, confirmation of this source would require deeper observations to locate the continuum break confidently.
While the current analysis of the slitless grism observations has achieved great success in removing contamination from moderate-brightness objects, this remains a factor when studying emission in faint galaxies. For example, even 1% residuals from the spectra of contaminating sources leave a signal as bright as that from objects of interest for magnitude differences of Δm = 5 mag (as will be the case for galaxies with magnitude of 27 near galaxies brighter than a magnitude of 22). Mitigating the effects of contamination will be important as detecting galaxy continuum breaks provides a means to confirm high-z galaxies without Lyα: this will be particularly useful into the epoch of reionization where observable Lyα emission may be less frequent (e.g., Rhoads et al. 2013; Watson et al. 2015; Oesch et al. 2016).
In summary, we do not identify any convincing Lyα emission or continuum-detected galaxies from the CLEAR spectra. However, this in itself is an important finding as the CLEAR data for 148 6.0 < zphot < 8.2 candidate galaxies still provide constraints on the evolution of the Lyα EW distribution. This is because some bright Lyα emission lines could (even should) have been detected with the CLEAR observing depth if the Lyα EW distribution does not evolve from z ≲ 6 to z ≳ 6. The nondetections in CLEAR rule out the existence of large EW Lyα sources in the CLEAR sample. We utilize the CLEAR spectra of these 148 6.0 < zphot < 8.2 candidate galaxies for the remainder of this study to set constraints on the Lyα EW distribution.
2.3. Supplemental Data from Keck DEIMOS and MOSFIRE Observations
The Texas Spectroscopic Search for Lyα Emission at the End of Reionization Survey (Jung et al. 2018, 2019, 2020) obtained deep spectroscopic data of over 120 z > 6 galaxies in the GOODS-N fields (65 galaxies from DEIMOS and 62 galaxies from MOSFIRE observations). These data provided the largest number of confirmed Lyα emitters at z > 7 with which to constrain the IGM H i fraction at z ∼ 7.6 (Jung et al. 2020). Using these data, Jung et al. (2020) noted tentative evidence that the Lyα EW distribution at z > 7 depends on the galaxies’ UV luminosities. Here we use the CLEAR sample to explore this finding, as the CLEAR data provides constraints on Lyα emission for a larger sample of faint galaxies.
CLEAR aims to measure the Lyα EW distribution during the reionization era at z > 6. Also, CLEAR is a blind survey with slitless spectroscopy, providing galaxy spectra for a wide dynamic range of UV magnitudes. Even nondetections in CLEAR are still highly constraining, placing upper limits on the Lyα visibility (Treu et al. 2012; Jung et al. 2018; Mason et al. 2019). The combination of the CLEAR data and Keck data then provided important, complimentary data. This allows us to explore the evolution of the Lyα EW distribution and its dependence on the UV absolute magnitude (MUV) at higher significance than possible with either data set separately.
2.4. Physical Properties of Combined Sample
We derived the properties of our 148 sources in CLEAR by performing spectral energy distribution (SED) fittings with the Bruzual & Charlot (2003) stellar population model, following Jung et al. (2019, 2020). We utilized the HST ACS and WFC3 broadband photometry (B435, V606, i775, I814, z850, Y105, J125, JH140, and H160) in addition to Spitzer Infrared Array Camera (IRAC) 3.6 μm and 4.5 μm band fluxes. Here, we use photometric redshift measurements that have been updated in Finkelstein et al. (2022) based on updated CANDELS photometry, including deeper I814 and Spitzer/IRAC data (where those authors utilized a deblending technique to measure IRAC photometry more accurately using the HST images as priors). A Salpeter (1955) initial mass function was assumed with a stellar mass range of 0.1–100 M⊙, and we allowed a metallicity range of 0.005–1.0 Z⊙. We explored a range of exponential models of star formation histories with exponentially varying timescales (τ = 10 Myr, 100 Myr, 1 Gyr, 10 Gyr, 100 Gyr, −300 Myr, −1 Gyr. −10 Gyr). We use the Calzetti (2001) dust attenuation curve with E(B − V) values ranging from 0 to 0.8 for modeling galaxy spectra and add nebular emission lines, adopting the Inoue (2011) emission-line ratio, as done in Salmon et al. (2015). The IGM attenuation was applied to the SED models based on Madau (1995).
Physical properties were obtained from the best-fit models, minimizing χ2. The uncertainties of physical parameters were estimated from SED fitting with 1000 Monte Carlo (MC) realizations of the perturbed photometric fluxes, according to their photometric errors for individual galaxies. UV magnitudes (MUV) of galaxies were calculated from the averaged fluxes over a 100 Å-bandpass (at 1450–1550 Å) from the best-fit models, which were not dust-corrected. In our SED fitting, we fixed redshifts with the best-fit photometric redshifts calculated by EAZY.
In the left panel of Figure 1 we present the MUV distribution of our CLEAR targets as a function of the redshift with the existing Keck DEIMOS and MOSFIRE targets from Jung et al. (2018, 2020). The black open circles show the CLEAR sample, and the blue and red filled circles denote targets from DEIMOS and MOSFIRE observations, respectively. The CLEAR galaxy sample does not show any noticeable bias, randomly distributed over a range of − 18 ≳ MUV ≳ − 22, giving more UV-faint (MUV > − 19) targets than the Keck observations. However, the Keck observations are much deeper than CLEAR in general, providing significantly lower EW limits for those targeted galaxies. Figure 1 also shows the stellar mass (Mstar)–MUV distribution of our CLEAR galaxies in the right panel, compared to the fiducial relation derived at z ∼ 7 by Song et al. (2016b). Similar to the Keck sample, most of the CLEAR targets are placed on the fiducial Mstar–MUV relation at z ∼ 7 of Song et al. (2016b) with no significant selection bias from the typical high-z galaxy population, although there are a few UV-faint and massive galaxies located above the fiducial relation.
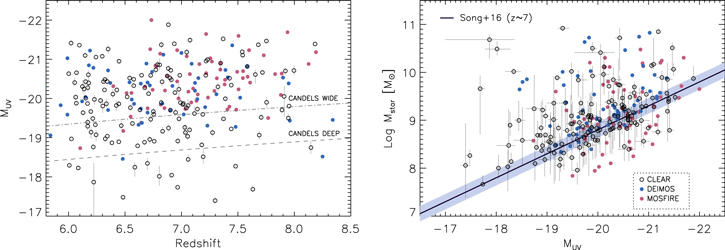
Figure 1. The left panel shows the MUV distribution of target galaxies in the CLEAR data set as a function of the redshift, and the Mstar–MUV relation in the right panel. All 148 galaxies in the CLEAR sample are shown as open circles while the targets from the Keck observations are denoted as filled blue (DEIMOS: 65 galaxies) and red (MOSFIRE: 62 galaxies) circles. A wide dynamic range of UV magnitudes in the CLEAR sample apparently show an unbiased nature of the blind survey, compared to the targeted Keck observations. The blue solid line in the right panel shows the fiducial z ∼ 7 relation of Song et al. (2016a) with the shaded area of its uncertainty.
Download figure:
Standard image High-resolution image3. Lyα EW Distribution and IGM Transmission
3.1. Measuring the Lyα EW Distribution at 6.0 < z < 8.2
The Lyα EW distribution is commonly described by a declining exponential form,

where EW is the Lyα rest-frame EW, and W0 is a e-folding scale width (e.g., Cowie et al. 2010). Jung et al. (2018) introduced an improved methodology of measuring the Lyα EW distribution, motivated by earlier studies (e.g., Treu et al. 2012, 2013), which utilizes galaxies without detected emission lines as well as Lyα detected objects. Following Jung et al., we constructed a template of an expected number of Lyα emitters as a function of the detection significance, by accounting for all types of data incompleteness including instrumental wavelength coverage, the wavelength-dependent Lyα detection limit, the UV-continuum flux, and the photometric redshift probability distribution function, P(z), based on the combined data set of the CLEAR spectra. We then applied this to the CLEAR data set and combined these results with those from our previous work using the Keck/DEIMOS+MOSFIRE observations in Jung et al. (2018, 2019, 2020) to measure the Lyα EW distribution.
To calculate the expected number of Lyα emitters for a given model we did the following. We first estimated the detection sensitivity for an unresolved emission line in the grism spectrum for each object. The detection limit was inferred through MC simulations with the 1D spectra by assigning a mock Lyα emission line to the reduced 1D spectra for all objects. We recovered the line flux of this mock emission line with its error from the Gaussian line fitting with the IDL MPFIT package (Markwardt 2009). This mock emission line was created to have an intrinsic line profile equal to the best-fit line profile from one of the highest-S/N Lyα emission detected in z7_GND_42912 from the MOSFIRE observations of Jung et al. (2019, 2020), and we smoothed the line profile to match the G102 resolution (∼45 Å). We note that the choice of the emission-line profile has a negligible effect given the relatively low resolution of the G102 grism data (R ∼ 200). We consider our targets to be point-like sources in our 1D mock emission simulation. This assumption is appropriate as our target galaxies at this redshift are small, with a typical effective radius (Reff) of Reff < 1 kpc in general (or ≲3 pixels at the resolution of HST/WFC3) and there is evidence that these kinds of galaxies are even smaller at higher redshifts (Shibuya et al. 2019). Additionally, in Grizli, our 1D spectra are extracted using the source segmentation maps from the photometric catalog, thus the extracted 1D spectra include the contribution estimated from the (rest-frame UV) morphology as measured by the Y105 band. We may not capture the contribution of Lyα from extended halos in 1D spectra (e.g., Leclercq et al. 2017; Wisotzki et al. 2018). However, an appropriate modeling of the extended component of Lyα at this redshift is beyond the scope of this study. In future, for example, JWST NIRSpec integral field unit observations will resolve the extended component of Lyα.
From these simulation emission lines we can derive emission-line flux limits for the CLEAR G102 data. The top panel of Figure 2 shows the 3σ detection limits over the wavelength range of the G102 grism, which corresponds to a redshift range of for Lyα emission at 6.0 ≲ z ≲ 8.2. In the figure, the colored dots show the detection limits for all the 148 individual galaxies in our sample; the red curve shows the median detection limit for all spectra. The bottom panel of Figure 2 shows the corresponding (median) 3σ rest-frame EW limits for galaxies as a function of the apparent UV magnitude. The EW limits were estimated by dividing the median 3σ emission-line flux limits (f3σ−limit) by the continuum level (fcont) and (1 + zLyα ) at each corresponding wavelength as below.

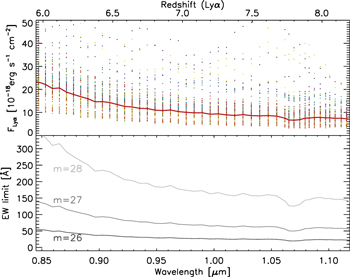
Figure 2. (Top) 3σ emission-line detection limits across the wavelengths corresponding to the WFC3 G102 redshift coverage of Lyα at 6.0 < z < 8.2. The red curve represents the median detection limit, and the detection limits of the 148 individual galaxies analyzed here are shown colored dots. The 3σ detection limit reaches down to below ∼1 × 10⁻¹⁷ erg s−1 cm2 around 1.0–1.1 μm where the G102 grism transmission is high. (Bottom) The median 3σ rest-frame EW limits as a function of the wavelength for varying apparent UV magnitudes (as labeled).
Download figure:
Standard image High-resolution imageAfter the detection limits were estimated, we constructed a template of an expected number of detected Lyα emission lines as a function of the detection significance. The template construction was done in a MC fashion, by simulating mock Lyα emission lines for entire target galaxies, following Jung et al. (2018, 2020). The MC simulation of individual mock emission lines has three main steps: (i) we allocate the wavelength of the simulated Lyα emission, randomly taken based on an object’s P(z); (ii) at each redshift, we simulate a Lyα line flux given the galaxy’s magnitude and EW, where the latter is drawn from the distribution in Equation (1) over a range for the assumed Lyα EW scale width, W0 = 5–200 Å; (iii) finally, we measure the detection significance for this simulated emission line based on the precomputed emission-line detection limits taken from above. For each choice of W0, we carried out 1000 sets of MC simulations of the mock emission lines of all individual target galaxies, producing a distribution of the expected number of Lyα detections as a function of the detection significance.
Lastly, we fit the data for each galaxy to the suite of simulated templates over the range of redshift and emission-line EW. We then combined these results to construct a probability distribution function (PDF) for the e-folding scale width (W0) of the Lyα EW distribution. We utilized a Markov Chain Monte Carlo (MCMC) algorithm for this fitting. As counting the number of Lyα emission-line detections is a general Poisson problem, we used a Poisson likelihood. We used the Cash (1979) statistic to describe the Poisson likelihood. We then used a Metropolis–Hastings MCMC sampler (Metropolis et al. 1953; Hastings 1970) to construct the PDF of W0, generating 105 MCMC chains. For more information on this methodology, see Jung et al. (2019, 2020).
3.2. The Evolution of Lyα EW at z > 6
Jung et al. (2018) constrained the characteristic e-folding scale width W0 of the Lyα EW distribution at 6 < z < 7 using data from Keck/DEIMOS for a sample of galaxies. They measured the 1σ and 2σ upper limits of W0 < 36 Å and <125 Å, respectively. Similarly, Jung et al. (2020) measured  Å for galaxies at 7.0 < z < 8.2 using data from Keck/MOSFIRE observations. These values are shown in Figure 3.
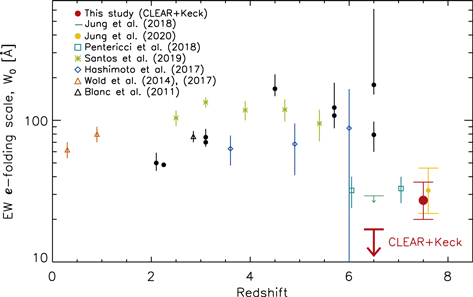
Figure 3. Similar to Figure 11 in Jung et al. (2020): the redshift dependence of the Lyα EW e-folding scale width (W0) up to z ∼ 8. The figure includes a compilation of the previous W0 measurements (Gronwall et al. 2007; Ouchi et al. 2008; Nilsson et al. 2009; Guaita et al. 2010; Hu et al. 2010; Kashikawa et al. 2011; Ciardullo et al. 2012; Zheng et al. 2014; Wold et al. 2014, 2017; Hashimoto et al. 2017; Jung et al. 2018; Pentericci et al. 2018; Santos et al. 2020; Jung et al. 2020). Our updated W0 measurements with CLEAR are denoted by red, large symbols: horizontal bars at z ∼ 6.5 and a filled circle at z ∼ 7.6. The z ∼ 7.6 measurement is displayed at z = 7.5 to avoid an overlap with the Jung et al. (2020) data point. Our study confirms a decreased W0 at z > 6, whereas there is little/no redshift evolution of W0 reported in the literature at z < 6.
Download figure:
Standard image High-resolution imageHere, we report new measurements on the evolution of the Lyα EW from the combined analysis of the CLEAR and Keck data sets. The CLEAR data provide important constraints on the evolution of Lyα as the lack of detections implies strong evolution in the number of sources with high Lyα EWs at these redshifts. The updated constraints improve the constraint on the EW e-folding scale width, W0, to be <17 Å (1σ) and <28 Å (2σ) at 6.0 < z < 7.0 and  Å at 7.0 < z < 8.2 (these are shown as red, large symbols in Figure 3). These measurements confirm the decline in W0 already seen at 6.0 < z < 7.0 compared to z < 6.
3.3. The Dependence of the Lyα EW on UV Magnitude
Observations at lower redshifts (2 ≲ z ≲ 6) show the Lyα EW e-folding scale width (W0) decreases with increasing UV luminosity (e.g., Ando et al. 2006; Stark et al. 2010; Schaerer et al. 2011; Cassata et al. 2015; Furusawa et al. 2016; Wold et al. 2017; Hashimoto et al. 2017; Oyarzún et al. 2017; Santos et al. 2020). In contrast, Jung et al. (2020) reported tentative evidence that W0 increases with increasing UV luminosity at z > 6 from the brightest galaxies (MUV < −21). Although the initial evidence was weak due to the large measurement errors, this finding is consistent with a picture of reionization where the IGM around brighter galaxies becomes ionized earlier than that of fainter objects, allowing for more efficient Lyα-photon escape (e.g., Zheng et al. 2017; Mason et al. 2018a; Endsley et al. 2021a).
CLEAR provides a means of improving the constraint on the evolution of W0 as a function of the absolute UV magnitude as the CLEAR data cover many more lower-luminosity objects. We therefore recalculated W0 from the combined data set of CLEAR and Keck/DEIMOS+MOSFIRE observations in different bins of the UV absolutemagnitude (MUV). These W0 measurements are listed in the third column in Table 1 and shown in the left panel of Figure 4 as filled red dots. From this analysis, the CLEAR data improve the evidence that the e-folding scale width (W0) of the Lyα EW distribution at 6.0 < z < 8.2 shows a possible upturn of W0 in the brightest UV magnitude bin, −22 < MUV < −21, although it is consistent with no upturn at the 1σ level. The PDF of W0 is constructed from 105 MCMC chains as described in Section 3.1. We then inspect what fraction of the MCMC chains have an upturn of W0 in the brightest UV magnitude bin. We find that 76% of the MCMC chains show such an upturn (or a greater W0). In addition, we find that 91% of the chains show an increasing trend between the Lyα IGM transmission and the (increasing) UV luminosity as shown in Figure 4. We discuss this further in the next subsection. This is in strong contrast with the measurements at 2 < z < 6 that show W0 decreases with increasing UV luminosity (Santos et al. 2020, shown as black open circles), indicating that at z > 6 the Lyα emission for UV-brighter galaxies is less affected by the IGM compared to UV-fainter galaxies.
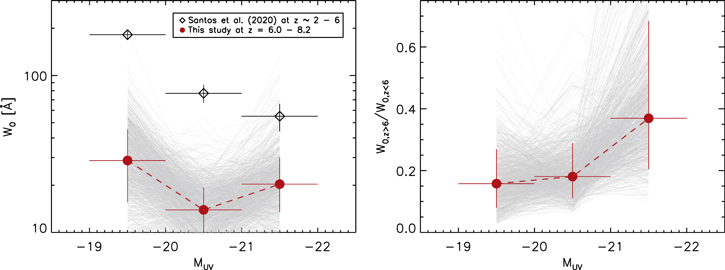
Figure 4. (Left) Measurements of the e-folding scale width (W0) of the Lyα EW distribution at different MUV. Our W0 measurements from this study (combining the CLEAR and Keck samples) at three MUV bins are shown as red filled circles, compared with those from lower-z observations in Santos et al. (2020). Our W0 measurement from the brightest UV magnitude galaxies show weaker evolution from z < 6 to z > 6, while those from fainter UV magnitude galaxies present a significant drop from z < 6 to z > 6. (Right) The ratio of observed-to-expected (intrinsic) EWs at z > 6 at different MUV. Our result indicates that the IGM transmission to Lyα during the reionization epoch is high from UV-bright galaxies, compared to those from UV-faint ones. The gray lines in the backgrounds in both panels represent 1000 random draws from the 105 MCMC chains that were generated for constructing the PDF of W0. We find that 76% of the MCMC chains show an upturn in W0 (or a greater W0) in the UV-brightest bin as shown in the left panel. In addition, we find that 91% of the chains suggest an increasing trend between the Lyα IGM transmission and the (increasing) UV luminosity in the right panel.
Download figure:
Standard image High-resolution imageTable 1. Lyα EW e-folding Scale Width (W0) and the Ratio of Observed-to-Expected (intrinsic) EWs at z > 6 at Different MUV
| W0 | W0,z>6 / W0,z<6 | |||
|---|---|---|---|---|
| MUV (LUV/L* a ) | Ngalaxy | z ∼ 2−6 | 6.0 < z < 8.2 | 6.0 < z < 8.2 |
| Santos et al. (2020) | This study | |||
| −20 < MUV < −19 (0.15 < LUV/L* < 0.4) b | 77 |
 Å Å |
 Å Å |

|
| − 21 < MUV < − 20 (0.4 < LUV/L* < 1.0) | 92 |
 Å Å |
 Å Å |

|
| − 22 < MUV < − 21 (1.0 < LUV/L* < 2.5) | 30 |
 Å Å |
 Å Å |

|
Notes.
a , where
  is the characteristic magnitude of a typical galaxy with an approximate value of
  at z ∼ 7 (Finkelstein et al. 2015).
b
Our sample in this faintest UV magnitude group could be incomplete in the CANDELS GOODS Wide fields due to the ∼1 magnitude shallower detection limits in the Wide fields than those in the CANDELS GOODS Deep fields, as shown in Figure 1 (left). Thus, we also calculated W0 in −20 < MUV < −19 excluding objects in the Wide fields, which provides
at z ∼ 7 (Finkelstein et al. 2015).
b
Our sample in this faintest UV magnitude group could be incomplete in the CANDELS GOODS Wide fields due to the ∼1 magnitude shallower detection limits in the Wide fields than those in the CANDELS GOODS Deep fields, as shown in Figure 1 (left). Thus, we also calculated W0 in −20 < MUV < −19 excluding objects in the Wide fields, which provides  Å. Although it is slightly increased from our fiducial value listed in the table, the change is insignificant and does not alter our conclusion.
Download table as: ASCIITypeset image
We note that we cannot completely rule out the possibility of the redshift evolution of galaxy physical properties (e.g., interstellar medium condition), which alters the Lyα properties significantly even without the IGM effect (Dayal et al. 2011; Hassan & Gronke 2021). However, such decreasing trend of W0 has been reported from most lower redshifts studies at z < 6 (see references earlier in this section), and evolutionary features of Lyα-emitting galaxies are not expected to be extreme, particularly between z < 6 and z > 6.
3.4. Lyα Transmission in the IGM
Our W0 measurements indicate different evolution of the Lyα EW distribution between bright and faint galaxies into the epoch of reionization, z ≳ 6. As shown in Figure 4, the W0 values obtained for the UV-fainter objects (MUV > −21) at z > 6 are substantially lower than those at lower redshift (2 < z < 6), whereas there is milder evolution in W0 for the UV-brighter objects (MUV < −21) from z < 6 to z > 6.
We use the change in the rest-frame Lyα EW as an estimate for the evolution of the Lyα transmission in the IGM transmission. We calculate the ratio of the observed-to-expected (intrinsic EW) at z > 6,  EWobs/EWint);
12
therefore,
EWobs/EWint);
12
therefore,
where we take W0,z<6 as the intrinsic EW after the IGM became completely ionized. For our analysis, we adopted W0,z<6, the measurements of the EW distribution at 2 < z < 6 from Santos et al. (2020) as the intrinsic values, and our W0 measurements as the observed values at z > 6.
The EW ratio,  , has been used heavily in the literature to interpret the evolution in Lyα emission lines in the context of the changing IGM into the EoR (e.g., Konno et al. 2018; Weinberger et al. 2018; Jung et al. 2020; Goto et al. 2021). In practice, this ratio approximates the global average IGM transmission at z > 6 compared to z < 6. As such, it assumes that the Lyα photon production and escape from galaxies do not evolve between the two redshift ranges. It also does not take into account the detailed transmission of the IGM to Lyα photons along sight lines to individual galaxies (and the latter requires sophisticated simulations that include the radiative effects of Lyα in cosmological simulations of reionization, and utilizing such simulations is beyond the scope of this work). The details of Lyα transmission are very model dependent, with large systematics between studies (see discussion below). Therefore, we interpret the ratio in Equation (3) as an estimate for the Lyα IGM transmission because it allows us to contextualize our measurements and compare to previous observation studies (but we use a larger spectroscopic sample). However, below we do provide comparison to some theoretical models, particularly ones that predict an increasing Lyα transmission with bright UV magnitude (as we observe that here). This provides some physical interpretation for our results and provides guidance for future theoretical studies.
The estimated EW ratios using Equation (3) are listed in the last column in Table 1 and shown in the right panel in Figure 4. Under the assumptions that go into Equation (3) (see above), the fact that the IGM transmission for Lyα photons appears to be higher for the UV-brightest galaxies can be interpreted as evidence that the IGM is highly ionized and more transparent around the brightest galaxies at z > 6. This result will require further confirmation with larger and more sensitive data sets from future telescopes, such as JWST and NGRST. Under the same assumptions, the decrease in IGM transmission for fainter galaxies (MUV > −21) can be interpreted as evidence that the IGM is more neutral where Lyα photons suffer significantly more attenuation. This adds to the growing observational evidence and findings of simulations that reionization is a spatially inhomogeneous process, where large ionized bubbles were often created by bright galaxies (e.g., Zheng et al. 2017; Castellano et al. 2018; Jung et al. 2019, 2020; Hu et al. 2021; Endsley et al. 2021b; Park et al. 2021; Qin et al. 2022). We expand on this interpretation in the next section.
While the interpretation of the EW ratio in Equation (3) can be used as an estimate of the Lyα IGM transmission, it is simplistic as it does not include variations in the Lyα IGM transmission depending on the local reionization history with no assumptions on the (either smooth or patchy) IGM evolution (e.g., the sizes and kinematics of individual ionized regions) nor the detailed Lyα emission properties of individual galaxies. However, the line-of-sight variations in the Lyα IGM transmission have been examined in previous studies, and a large number of these predict that the Lyα IGM transmission should increase with increasing galaxy UV luminosity (e.g., Mason & Gronke 2020; Gronke et al. 2021; Park et al. 2021; Smith et al. 2022; Qin et al. 2022), which corresponds to what our results support. Regarding possible effects of the interstellar medium (ISM), our measurements assume that we do not expect strong ISM evolution in galaxies between the two redshift ranges: similar ISM conditions in galaxies with similar UV brightness. The MUV–ΔvLyα (Lyα velocity offset) relation may evolve with the redshift, but the MUV dependency of ΔvLyα becomes even smaller at higher redshifts (e.g., Equation (3) in Mason et al. 2018a), and relatively small velocity offsets in higher-z UV-bright galaxies were reported (e.g., Matthee et al. 2020). Thus, if this evolutionary effect is considered, the additional boost on the Lyα IGM transmission from UV-brighter galaxies due to their relatively larger ΔvLyα becomes even weaker. Thus, this means that the ISM effects are unlikely to be a factor nullifying our results and conclusions in this study. Although other important physical conditions in the ISM, such as dust geometry, nebular metallicity, galaxy morphology, and line-of-sight variation in the ISM level, need to be considered as well, our current knowledge on these factors is largely limited and left for future study.
To make more quantitative interpretation of the evolution of the IGM requires more sophisticated simulations that include both the detailed production and escape of Lyα from individual galaxies, in addition to the radiative transfer of those photons through an expanding, inhomogeneously ionized IGM. This has been the focus of multiple studies (e.g., Hutter et al. 2014; Mesinger et al. 2015; Mason et al. 2018a; Weinberger et al. 2018). While these simulations are enlightening, they also depend on other assumptions (e.g., the reionization history, the evolution of ionized bubble sizes, and MUV—halo mass relation). Here, our intent is to provide results from the latest sets of Lyα observations combined with our empirical approach. In future work, it will be very useful to extend these investigations to study how the Lyα IGM transmission varies depending on the reionization history and the characteristic ionized bubble sizes around galaxies (e.g., Garel et al. 2021; Park et al. 2021; Smith et al. 2022) as well as the intrinsic Lyα emission properties of galaxies during the epoch of reionization such as Lyα velocity offset (e.g., Stark et al. 2017; Hashimoto et al. 2018; Hutchison et al. 2019; Matthee et al. 2020).
4. Conclusions and Discussion
We extracted HST slitless grism spectra of 148 high-z galaxies in the GOODS fields from the CLEAR survey. Combining our high-z data set from CLEAR to the existing Keck Lyα observations from the Texas Spectroscopic Search for Lyα Emission at the End of Reionization Survey (Jung et al. 2020), we provide an improved measurement of the e-folding scale width (W0) of the Lyα EW distribution at z > 6 and examine the dependence of W0 on the UV luminosity (MUV). Our findings are summarized as follows.
- 1.We inspected the reduced CLEAR spectra of high-z candidate galaxies in order to search for Lyα-emission-line or continuum-break detections. The search finds only a tentative ( ∼ 4σ) Lyα detection from a zgrism = 6.513 ±0.005 galaxy and a continuum detection from a
 galaxy. We discuss these more in the Appendix, although we cannot confirm their nature as high-z sources from the current data due to the incomplete contamination removal and the shallow observing depth.
 - 2.With the combined data set of CLEAR and the Keck observations, we compute the 1σ (2σ) upper limit of W0 at <17 Å (<28 Å) at 6.0 < z < 7.0 andÅ at 7.0 <z < 8.2. This is illustrated in Figure 3. This confirms a significant drop in W0 previously suggested at 6.0 < z < 7.0. The CLEAR data improved these constraints on the evolution of W0 compared to the previous analysis using only the Keck data. This is primarily a consequence of the spectral measurements for an increased number of galaxies, pushing to lower UV luminosities (LUV ≈ 0.025 L*) in the CLEAR sample.
- 3.We constrained the W0 values and calculated the ratio of the observed-to-expected (intrinsic) EWs at z > 6 as an estimate for the IGM transmission of Lyα at z > 6 as a function of the UV absolute magnitude. This is shown in Figure 4. The Lyα EW distribution at 6.0 < z < 8.2 shows a possible upturn of W0 in the UV-brightest galaxies ( −22 < MUV < −21) at a 76% confidence level, in contrast with the strong decline in W0 with increasing UV brightness for galaxies at z < 6. Consequently, the IGM transmission to Lyα at z > 6 appears to be higher for the UV-brightest galaxies with 91% confidence.
- 4.If we interpret the evolution in W0 as a change in the transmission of Lyα photons in the IGM, then we conclude that this transmission depends on the UV luminosity at z ≳ 6 such that the transmission around UV-bright galaxies is higher than around UV-faint galaxies. This is consistent with a picture where the IGM around the brightest galaxies ( −22 < MUV < −21) is largely ionized, allowing high Lyα transmission. In this picture, the IGM is spatially inhomogeneous where large ionized bubbles are created by UV-bright galaxies, while the IGM around fainter galaxies is more neutral, leading to strong attenuation of Lyα photons and lower transmission.


This picture builds on other recent observations that support an inhomogeneous nature of the IGM during reionization. We illustrate this picture in Figure 5. Studies of the IGM neutral fraction from Lyα emission show disparity in their measurements at z ∼ 7–8 (Mason et al. 2018a, 2019; Hoag et al. 2019; Jung et al. 2020). Particularly, a higher Lyα detection rate reported in Jung et al. (2020) suggests an overdense and highly ionized region in the GOODS-N field. Recent studies of the Lyα damping wing in QSO spectra also provide a large scatter of the IGM neutral fraction at the same redshift (McGreer et al. 2015; Davies et al. 2018; Wang et al. 2020; Yang et al. 2020). One explanation for such disagreement between the IGM neutral fraction measurements is that reionization did not occur spatially uniformly, but in an inhomogeneous way (e.g., Finlator et al. 2009; Pentericci et al. 2014; Katz et al. 2019).
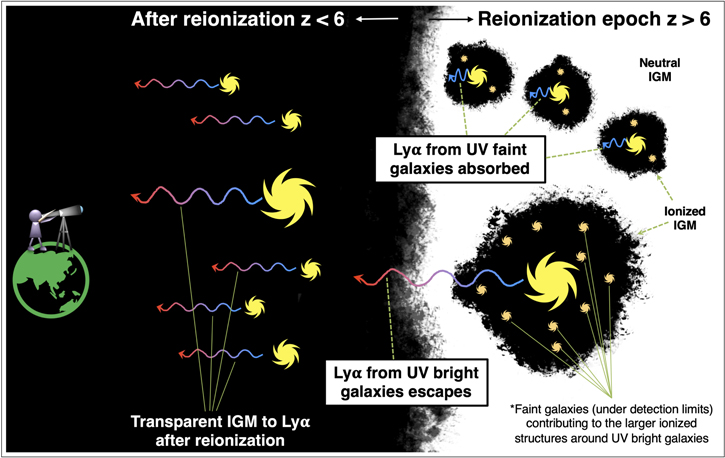
Figure 5. Cartoon summarizing the inhomogeneous process of reionization at the z > 6 universe consistent with the data and interpretation here. Galaxies with higher UV luminosities have larger ionized bubbles around them. This allows a higher Lyα transmission to the IGM. These UV-bright galaxies are likely to be centered in overdense regions where they cluster with fainter galaxies (and these may be beyond current detection limits). The combination of ionizing photons from the galaxies in the overdense regions may provide a significant ionizing photon budget around UV-bright galaxies (Finkelstein et al. 2019b; Endsley et al. 2021a; Larson et al. 2022). In contrast, UV-faint galaxies have more neutral gas around them (i.e., they sit in smaller ionized bubbles); thus the Lyα transmission to the IGM is suppressed. At lower redshifts, where the IGM is completely ionized, the Lyα emission has an overall high transmission for all galaxies. In the figure, the darker (black) color shows a more ionized medium, while a neutral gas is represented as bright (white) color. UV-bright galaxies are shown with larger symbols.
Download figure:
Standard image High-resolution imageIn the same context, recent findings of clustered Lyα emitters (LAEs) from bright galaxies in the middle phase of reionization (Zheng et al. 2017; Castellano et al. 2018; Tilvi et al. 2020; Jung et al. 2020; Hu et al. 2021; Endsley et al. 2021b) suggest high Lyα visibility from these bright galaxies, implying inhomogeneous reionization caused by individual/groups of bright galaxies. This picture is further supported by Lyα detections from two of the brightest z > 8.5 galaxies (Zitrin et al. 2015; Naidu et al. 2020; Larson et al. 2022), which implies that reionization proceeds more rapidly and/or earlier around brighter galaxies.
Our analysis of the Lyα transmission at z > 6 as a function of the UV magnitude shows a high Lyα transmission of the IGM in UV-bright galaxies (MUV < −21), while Lyα visibility from fainter galaxies (−21 < MUV < −19) is rapidly suppressed at z > 6. This is in general consistent with a picture of the spatially inhomogeneous process of reionization where bright galaxies often created large ionized bubbles, which allow enhanced Lyα transmission to the IGM nearby these bright sources, which is illustrated in Figure 5.
This picture is consistent with theoretical predictions from reionization simulations where reionization begins in overdense regions and progresses into low-density regions (e.g., Finlator et al. 2009; Katz et al. 2019). In particular, Park et al. (2021) calculate Lyα transmissivity of the IGM from the Cosmic Dawn II simulation (Ocvirk et al. 2020), showing that UV-bright galaxies tend to reside in “bubbles” as they ionize large volumes and are located in overdense regions where nearby fainter galaxies also can contribute to the ionizing emissivity (Finkelstein et al. 2019b; Endsley et al. 2021a; Larson et al. 2022). These fainter galaxies sit in large ionized bubbles and are expected to have higher Lyα transmission than isolated faint objects (Qin et al. 2022). Most of these faint objects are likely under the current detection limit but could be probed in larger samples (which will be available from the NGRST) or tested in future observations sensitive to fainter emission from the JWST and the next generation of 20–30 m class telescopes. This model also naturally predicts that Lyα emission shows a larger velocity offset from systemic for brighter galaxies, which further facilitates the escape of Lyα photons through the IGM (Mason et al. 2018b; Garel et al. 2021). The existing data from Lyα support this picture.
Our results suggest significantly different evolution of the Lyα transmission in the IGM in the middle phase of reionization in varying-UV-magnitude galaxies. As the Lyα transmission to the IGM is the key quantity in constraining the neutral fraction of the IGM with Lyα observations (Mason et al. 2018a; Hoag et al. 2019; Jung et al. 2020; Morales et al. 2021; Wold et al. 2022), it is critical to understand the dependence of the IGM transmission of Lyα on the galaxy UV luminosity in the future. This requires deeper spectroscopic observations and larger sample sizes, both of which will need to cover a wide dynamic range in the galaxy UV luminosity. This will be possible by grism observations with the NGRST, which will be ideal for such studies of Lyα emission from galaxies during the epoch of reionization. Furthermore, the pending launch of the JWST will provide data we can use to study Lyα systematics (e.g., velocity offset) with other emission-line observations for galaxies in the reionization era.
We thank our colleagues on the CLEAR team for their valuable conversations and contributions. This work is based on data obtained from the Hubble Space Telescope through program number GO-14227. Support for Program number GO-14227 was provided by NASA through a grant from the Space Telescope Science Institute, which is operated by the Association of Universities for Research in Astronomy, Incorporated, under NASA contract NAS5-26555. I.J. acknowledges support from NASA under award number 80GSFC21M0002. S.L.F. acknowledges support from NASA through ADAP award 80NSSC18K0954. V.E.C. acknowledges support from the NASA Headquarters under the Future Investigators in NASA Earth and Space Science and Technology (FINESST) award 19-ASTRO19-0122, as well as support from the Hagler Institute for Advanced Study at Texas A&M University. This work benefited from generous support from the George P. and Cynthia Woods Mitchell Institute for Fundamental Physics and Astronomy at Texas A&M University. This work was supported in part by NASA contract NNG16PJ33C, the Studying Cosmic Dawn with WFIRST Science Investigation Team.
Appendix A: Lyα-Emitter Candidate at z = 6.513
We performed emission-line search as described in Section 2.2.1, which results in no convincing Lyα detections from the entire sample except for one tentative detection from a zgrism = 6.513 ± 0.005 galaxy (GN4_5461276). Although the detection of Lyα emission is possibly spurious from the galaxy with given data, it is worth presenting the promising features of the detected emission line here as the physical properties of the emission line would be rather extreme if confirmed. Further observations are required for validating the nature of the detected emission line.
We display the individual 2D spectra obtained from four PAs with the HST H-band stamp of GN4_5461276 in Figure 6, where we detect significant emission-line features from two (PA = 93 and PA = 173) of the four PAs. The all-PA-combined 1D and 2D spectra are shown in Figure 7, which shows a formal >4σ detection of the emission line.
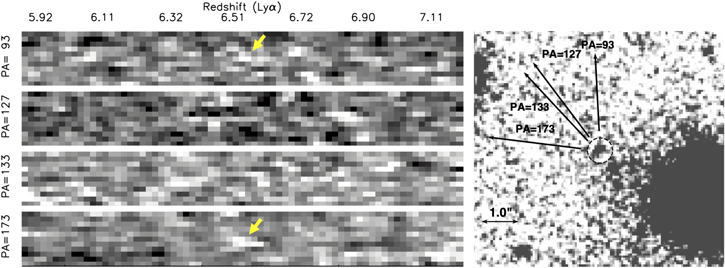
Figure 6. (Left) Four individual PA 2D spectra of the emission-line candidate galaxy (GN4_5461276). White (black) shows regions with positive (negative) flux in the spectra. The topmost and bottommost panels (PA = 93 and 173) show positive emission features. These are marked with yellow arrows. The middle two panels (PA = 133 and 127) show no such emission features. (Right) HST H-band image centered at GN4_5461276 showing the spectral dispersion directions of the four PAs (as labeled). The two PAs (93 and 173) showing positive emission do not share any potential contaminating sources. The two intermediate PAs (127 and 133) have possible contamination from the large galaxy on the bottom right of the image.
Download figure:
Standard image High-resolution image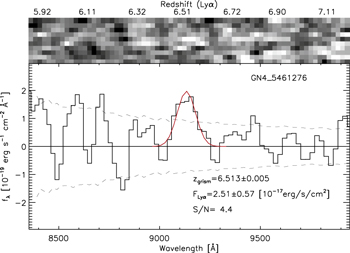
Figure 7. All-PA-combined 1D (bottom) and 2D (top) spectrum of the emission line detected from GN4_5461276. In the bottom panel, the measured spectrum is shown as the black histogram with the noise level shown as the dashed curves. The red curve represents the a model Gaussian curve fit to the emission line.
Download figure:
Standard image High-resolution imageTo rule out the possibility of being contaminated emission from nearby sources, we checked the known redshifts of the nearby bright sources and concluded that the emission line is not the zeroth-order reflection of an emission line associated with nearby sources. We fit the Gaussian function to the emission line to estimate the physical properties of the detected emission line. The S/N value was estimated from Gaussian fitting on 1000 simulated spectra by fluctuating the 1D fluxes with the 1D noise level. The emission-line flux was calculated from the best-fit Gaussian (red in Figure 7), and the redshift was derived from the peak of the best-fit Gaussian curve. The derived physical quantities are listed in the bottom panel of the plot, which shows its extreme values of rest-frame EW >1000 Å and FWHM > 100 Å.
To check the possibility of being a low-z interloper, we compare the best-fit SED models between high-z (Lyα) and low-z ([O ii]) interpretations with the HST stamp images in Figure 8. For the high-z interpretation, the Lyα contribution to HST fluxes were subtracted for the SED fitting. From the best-fit models, the high-z solution is preferred than the low-z solution, but both interpretations remain viable with the given data. Thus, further observational evidence is required to confirm this tentative Lyα detection.
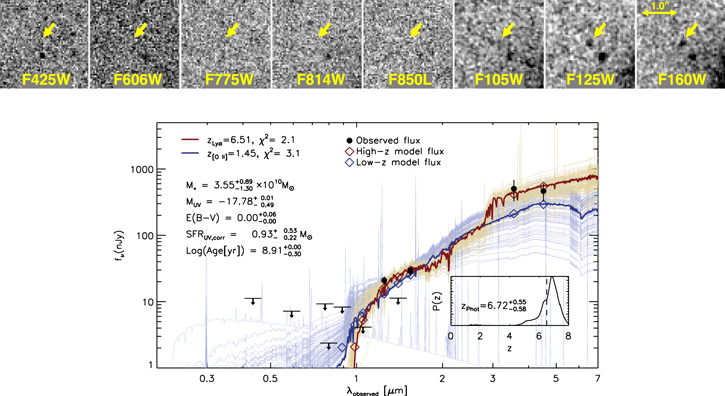
Figure 8. Images and SED models for GN4_5461276. (Top) HST ACS/WFC3 “postage-stamp images” for this galaxy. The yellow arrows indicate the locations of the object in individual stamps. (Bottom) Best-fit SED models between high-z (red: Lyα) and low-z (blue: [O ii]). The faint blue and red curves represent the SED fitting for each 100 MC realization set of the high-z and low-z cases. For the high-z solution, Lyα contribution is subtracted from HST photometry. The inset figure shows the probability distribution function of the photometric redshift (solid curve) with the grism redshift (vertical dashed line). Although the high-z solution (χ2 = 1.7) is slightly preferred compared to the low-z one (χ2 = 3.1), it is difficult to draw conclusions from the given data.
Download figure:
Standard image High-resolution imageAppendix B: Continuum Detection from a z = 6.2 Galaxy
We inspected CLEAR spectra of high-z candidates to see if they present any continuum features as described in Section 2.2.2. It results in one continuum candidate from a  galaxy. The continuum is detected at >4σ at wavelengths redward of a possible continuum break. Figure 9 shows the grism spectra of GN2_23734, combining both G102 and G140 spectra. The extracted 1D spectrum is shown as a black histogram with the noise level shown as dashed-line curves. The continuum fit given by Grizli is presented as a red curve, and we display the best-fit SED (blue), which is obtained from the SED fitting based on the object’s HST+Spitzer/IRAC photometry (see Section 2.4). In the SED fitting, we used the best-fit grism redshift (zgrism = 6.2) derived by Grizli. Although the grism continuum-fit spectrum seems comparable to the best-fit SED, we consider it tentative given the current noise level in the grism spectrum. Nevertheless, we report this tentative detection of the continuum break as it provides a possible path to confirm other high-z galaxies without Lyα. This is particularly useful for galaxies in the epoch of reionization where the Lyα transmission is lower (see Section 2.2.2 and discussion in, e.g., Rhoads et al. 2013; Watson et al. 2015; Oesch et al. 2016). It will be valuable to target this galaxy (and others) with spectroscopy from future space-based telescopes (e.g., JWST, NGRST).
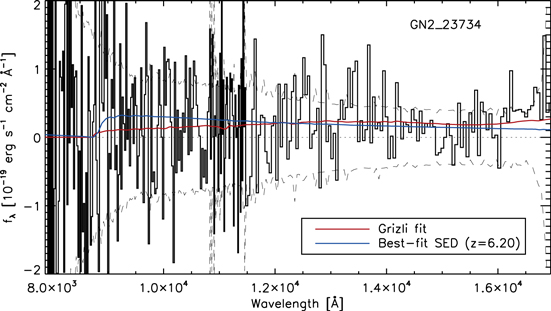
Figure 9. 1D grism spectrum of a continuum-detection candidate galaxy (GN2_23734) at  . The continuum is formally detected at wavelengths redward of the Lyα break (S/Ncontinuum > 4). The black histogram shows the 1D spectrum, which combines both of the G102 and G140 spectra of GN2_23734. The noise level is shown as dashed curves. The red curve represents the continuum fit derived by Grizli, and the best-fit SED is displayed as the blue curve, which is obtained from SED fitting based on the object’s HST+Spitzer/IRAC photometry.
Download figure:
Standard image High-resolution imageAppendix C: Summary of 6.0 < z < 8.2 Candidate Galaxies in CLEAR
As discussed in Section 2, we use the CLEAR spectra of 148 6.0 < z < 8.2 candidate galaxies for exploring the galaxy UV magnitude dependency of the IGM transmission to Lyα during the epoch of reionization. Table 2 summarizes the entire 148 6.0 < z < 8.2 CLEAR galaxies in order of increasing photometric redshift, which includes the 3σ rest-EW upper limits on Lyα in the last column.
Table 2. Summary of CLEAR 6.0 < z < 8.2 Targets
| ID a | R.A. (J2000.0) | Decl. (J2000.0) | J125 | MUV b | zphot c | EW Lyα d (Å) |
|---|---|---|---|---|---|---|
| GS4_28545 | 53.142085 | −27.779851 |

| −20.63 
| 6.00 
| <82.2 |
| GS4_5428651 | 53.162267 | −27.796050 |

| −16.03 
| 6.00 
| <1332.7 |
| GS4_30518 | 53.159459 | −27.771855 |

| −18.29 
| 6.01 
| <142.8 |
| GN5_5453006 | 189.147675 | 62.310692 |

| −21.41 
| 6.02 
| <14.0 |
| GS4_25097 | 53.143880 | −27.793083 |

| −18.97 
| 6.03 
| <123.9 |
| GN1_38168 | 189.320618 | 62.377956 |

| −22.97 
| 6.03 
| <3.3 |
| GS2_49117 | 53.128395 | −27.679525 |

| −20.41 
| 6.05 
| <55.2 |
| GN2_22377 | 189.231018 | 62.252335 |

| −20.03 
| 6.06 
| <49.0 |
| GS4_24418 | 53.139299 | −27.795872 |

| −19.88 
| 6.07 
| <53.9 |
| ERSPRIME_43483 | 53.070813 | −27.706732 |

| −20.66 
| 6.07 
| <36.0 |
| GS4_29439 | 53.165805 | −27.776102 |

| −18.23 
| 6.09 
| <155.4 |
| GS4_29085 | 53.151986 | −27.778248 |

| −21.36 
| 6.10 
| <8.7 |
| GN1_37875 | 189.292984 | 62.366493 |

| −20.30 
| 6.12 
| <54.7 |
| GN4_5463603 | 189.346069 | 62.255791 |

| −19.64 
| 6.13 
| <279.9 |
| GS2_49517 | 53.144795 | −27.676513 |

| −20.24 
| 6.14 
| <45.9 |
| GS5_40046 | 53.105382 | −27.723476 |

| −21.10 
| 6.15 
| <33.0 |
| GN5_5453623 | 189.159882 | 62.307541 |

| −20.43 
| 6.15 
| <75.6 |
| GS4_24191 | 53.152647 | −27.797311 |

| −20.01 
| 6.15 
| <48.8 |
| GS4_24855 | 53.146101 | −27.794571 |

| −19.87 
| 6.17 
| <72.0 |
| GS3_5443046 | 53.155751 | −27.746295 |

| −19.39 
| 6.17 
| <103.7 |
| GS2_48937 | 53.123742 | −27.680620 |

| −19.29 
| 6.17 
| <89.3 |
| GS3_35639 | 53.155782 | −27.746150 |

| −20.28 
| 6.17 
| <39.6 |
| GS5_44454 | 53.120956 | −27.702285 |

| −20.61 
| 6.18 
| <26.4 |
| ERSPRIME_43514 | 53.071191 | −27.706498 |

| −20.40 
| 6.18 
| <45.3 |
| GN3_30188 | 189.256210 | 62.291283 |

| −19.67 
| 6.20 
| <242.8 |
| GN7_5429834 | 189.095474 | 62.227612 |

| −19.14 
| 6.20 
| <112.1 |
| GN3_5450671 | 189.263977 | 62.318367 |

| −19.49 
| 6.21 
| <94.7 |
| GN4_5461825 | 189.323929 | 62.271130 |

| −18.76 
| 6.22 
| <174.3 |
| GN4_5446203 | 189.305573 | 62.271095 |

| −17.87 
| 6.22 
| <14672.0 |
| GN4_23534 | 189.296127 | 62.257969 |

| −19.98 
| 6.23 
| <47.7 |
| GN2_5432549 | 189.252869 | 62.235577 |

| −19.33 
| 6.24 
| <128.9 |
| ERSPRIME_5455619 | 53.069652 | −27.697069 |

| −21.06 
| 6.24 
| <67.6 |
| GN5_5453421 | 189.157303 | 62.309128 |

| −19.07 
| 6.24 
| <146.2 |
| GN4_21677 | 189.318161 | 62.249264 |

| −19.95 
| 6.28 
| <61.5 |
| GN7_16571 | 189.114838 | 62.224430 |

| −21.08 
| 6.30 
| <18.0 |
| GS5_5445164 | 53.114526 | −27.737678 |

| −19.81 
| 6.30 
| <87.2 |
| GN2_23734 | 189.211990 | 62.258846 |

| −20.43 
| 6.31 
| <67.4 |
| GS4_29685 | 53.156131 | −27.775849 |

| −20.22 
| 6.32 
| <38.0 |
| GN2_17132 | 189.197571 | 62.226990 |

| −20.48 
| 6.32 
| <34.7 |
| GN2_19472 | 189.219406 | 62.238247 |

| −18.97 
| 6.32 
| <174.7 |
| GS2_47924 | 53.146726 | −27.686787 |

| −19.86 
| 6.33 
| <68.9 |
| GS5_40767 | 53.118464 | −27.719486 |

| −20.43 
| 6.34 
| <35.4 |
| GS4_28201 | 53.156040 | −27.780970 |

| −19.04 
| 6.34 
| <71.6 |
| GN3_35300 | 189.238388 | 62.327126 |

| −21.26 
| 6.35 
| <22.4 |
| GS4_23893 | 53.153257 | −27.798288 |

| −18.87 
| 6.38 
| <180.2 |
| GN1_37866 | 189.323151 | 62.366215 |

| −20.11 
| 6.39 
| <76.4 |
| GS3_34282 | 53.149862 | −27.752839 |

| −19.82 
| 6.42 
| <224.2 |
| GN1_37461 | 189.318008 | 62.353180 |

| −20.22 
| 6.43 
| <65.5 |
| GS4_27209 | 53.173343 | −27.784645 |

| −18.90 
| 6.44 
| <88.9 |
| ERSPRIME_44510 | 53.049653 | −27.701990 |

| −19.86 
| 6.45 
| <98.9 |
| GN4_27400 | 189.277420 | 62.276405 |

| −20.95 
| 6.45 
| <26.0 |
| GS2_5457820 | 53.114407 | −27.685098 |

| −19.31 
| 6.47 
| <360.3 |
| GS4_5430868 | 53.155602 | −27.788733 |

| −17.48 
| 6.48 
| <355.1 |
| GN2_20362 | 189.240814 | 62.242630 |

| −20.04 
| 6.52 
| <53.5 |
| GS3_40377 | 53.172480 | −27.721434 |

| −20.52 
| 6.54 
| <38.0 |
| ERSPRIME_39697 | 53.064237 | −27.724698 |

| −19.77 
| 6.55 
| <83.6 |
| GN5_33256 | 189.178146 | 62.310635 |

| −19.36 
| 6.57 
| <128.3 |
| GN7_16422 | 189.177979 | 62.223713 |

| −20.49 
| 6.58 
| <71.4 |
| GN7_14851 | 189.111633 | 62.215374 |

| −20.33 
| 6.58 
| <43.4 |
| GN4_5438687 | 189.295410 | 62.252560 |

| −18.25 
| 6.59 
| <330.2 |
| GS4_28784 | 53.169042 | −27.778832 |

| −18.79 
| 6.61 
| <129.3 |
| GN5_34340 | 189.187347 | 62.318821 |

| −19.71 
| 6.63 
| <66.0 |
| GN2_5465437 | 189.239700 | 62.248108 |

| −20.59 
| 6.65 
| <39.9 |
| GS4_5431395 | 53.161653 | −27.787043 |

| −18.88 
| 6.67 
| <128.6 |
| ERSPRIME_43078 | 53.055896 | −27.708708 |

| −20.27 
| 6.68 
| <65.6 |
| GS3_5447463 | 53.167998 | −27.728187 |

| −18.34 
| 6.70 
| <689.3 |
| GN4_5462173 | 189.308792 | 62.267353 |

| −20.12 
| 6.71 
| <125.9 |
| GN7_5430295 | 189.088989 | 62.229202 |

| −18.96 
| 6.72 
| <278.5 |
| GN5_31683 | 189.165039 | 62.300194 |

| −20.59 
| 6.73 
| <35.5 |
| GN5_32053 | 189.140656 | 62.302368 |

| −19.47 
| 6.73 
| <157.3 |
| GN5_33584 | 189.156357 | 62.313087 |

| −19.67 
| 6.75 
| <112.4 |
| GN7_5428106 | 189.104630 | 62.222271 |

| −19.59 
| 6.75 
| <69.1 |
| GS4_26311 | 53.151601 | −27.787910 |

| −18.91 
| 6.76 
| <123.5 |
| GN5_5454319 | 189.140610 | 62.305511 |

| −20.73 
| 6.77 
| <46.7 |
| GS4_20530 | 53.154950 | −27.815805 |

| −20.86 
| 6.79 
| <35.6 |
| GN4_5461276 e | 189.281143 | 62.274857 |

| −18.01 
| 6.80 
| − |
| ERSPRIME_45005 | 53.066739 | −27.699829 |

| −20.86 
| 6.81 
| <29.6 |
| GN4_26634 | 189.282623 | 62.272507 |

| −19.90 
| 6.82 
| <89.3 |
| GS5_41330 | 53.094447 | −27.716946 |

| −21.37 
| 6.82 
| <16.8 |
| ERSPRIME_39962 | 53.041104 | −27.723434 |

| −20.43 
| 6.83 
| <55.2 |
| GN3_5452837 | 189.220932 | 62.311447 |

| −19.16 
| 6.83 
| <154.1 |
| GN5_34059 | 189.166245 | 62.316494 |

| −20.57 
| 6.87 
| <40.7 |
| GS3_35821 | 53.150039 | −27.745016 |

| −20.77 
| 6.88 
| <27.4 |
| GS4_20622 | 53.155370 | −27.815248 |

| −21.88 
| 6.88 
| <14.0 |
| GN2_5430417 | 189.223526 | 62.229626 |

| −19.25 
| 6.89 
| <126.7 |
| GN5_32855 | 189.134445 | 62.307865 |

| −20.52 
| 6.90 
| <57.7 |
| GS4_25335 | 53.177375 | −27.792132 |

| −19.70 
| 6.90 
| <77.8 |
| GN7_15746 | 189.095871 | 62.220078 |

| −20.72 
| 6.91 
| <42.0 |
| GS2_5452228 | 53.136772 | −27.710775 |

| −20.48 
| 6.91 
| <48.0 |
| GS4_22623 | 53.158407 | −27.804372 |

| −18.04 
| 6.91 
| <330.6 |
| GN4_24681 | 189.353012 | 62.263409 |

| −21.40 
| 6.94 
| <43.0 |
| GN5_35003 | 189.178085 | 62.324314 |

| −20.15 
| 6.94 
| <68.1 |
| GN3_5455960 | 189.279175 | 62.299282 |

| −19.64 
| 6.95 
| <173.9 |
| GS4_23998 | 53.160569 | −27.797819 |

| −17.73 
| 6.97 
| <306.7 |
| GN3_5455082 | 189.229721 | 62.302711 |

| −18.91 
| 6.97 
| <291.4 |
| GN7_11318 | 189.116867 | 62.198677 |

| −20.23 
| 6.98 
| <175.6 |
| ERSPRIME_38389 | 53.066731 | −27.731170 |

| −19.48 
| 6.98 
| <343.1 |
| GN5_33361 | 189.177856 | 62.311707 |

| −20.59 
| 6.99 
| <35.5 |
| GN4_26575 | 189.283737 | 62.272240 |

| −19.89 
| 6.99 
| <166.5 |
| GN2_24019 | 189.275925 | 62.260296 |

| −19.85 
| 7.01 
| <262.4 |
| GN2_17220 | 189.201050 | 62.227440 |

| −19.87 
| 7.02 
| <77.4 |
| GN7_5428506 | 189.150253 | 62.223709 |

| −19.26 
| 7.03 
| <133.2 |
| GN5_34042 | 189.166092 | 62.316406 |

| −19.13 
| 7.03 
| <232.7 |
| GN4_5441249 | 189.310867 | 62.260452 |

| −19.76 
| 7.04 
| <98.6 |
| GN1_37724 | 189.273300 | 62.360783 |

| −21.18 
| 7.05 
| <25.4 |
| GN5_31436 | 189.166931 | 62.298553 |

| −19.03 
| 7.06 
| <261.7 |
| GN3_34711 | 189.254974 | 62.321877 |

| −19.82 
| 7.06 
| <113.6 |
| GN2_5464240 | 189.232895 | 62.247395 |

| −18.45 
| 7.06 
| <399.1 |
| GN2_20956 | 189.205231 | 62.245541 |

| −19.20 
| 7.07 
| <213.9 |
| GN7_12243 | 189.114151 | 62.203175 |

| −21.49 
| 7.08 
| <26.2 |
| GS4_5435288 | 53.153420 | −27.774471 |

| −19.62 
| 7.11 
| <111.9 |
| GN7_16103 | 189.091812 | 62.221901 |

| −19.73 
| 7.14 
| <103.2 |
| GN4_5463508 | 189.307037 | 62.255745 |

| −18.82 
| 7.18 
| <282.2 |
| GN3_5449006 | 189.286926 | 62.277760 |

| −19.59 
| 7.19 
| <299.1 |
| GN3_5454301 | 189.225098 | 62.306057 |

| −18.51 
| 7.19 
| <442.2 |
| GN2_21995 | 189.205307 | 62.250763 |

| −20.59 
| 7.22 
| <39.5 |
| GN4_25192 | 189.264938 | 62.265793 |

| −20.95 
| 7.22 
| <41.5 |
| GN1_37619 | 189.278732 | 62.357456 |

| −20.99 
| 7.23 
| <37.7 |
| GN7_5429974 | 189.091492 | 62.228096 |

| −19.13 
| 7.28 
| <305.1 |
| GS4_5427001 | 53.152865 | −27.801940 |

| −17.40 
| 7.30 
| <848.5 |
| GS3_37079 | 53.169588 | −27.738066 |

| −20.30 
| 7.32 
| <55.0 |
| GN3_35055 | 189.273392 | 62.324780 |

| −20.90 
| 7.35 
| <36.0 |
| GN5_32031 | 189.157898 | 62.302376 |

| −21.52 
| 7.37 
| <27.8 |
| GN2_21790 | 189.199692 | 62.249802 |

| −19.48 
| 7.37 
| <113.0 |
| GN3_33949 | 189.222000 | 62.315758 |

| −19.99 
| 7.39 
| <79.0 |
| GN5_33655 | 189.133728 | 62.313564 |

| −20.52 
| 7.43 
| <64.3 |
| GS4_23143 | 53.155096 | −27.801771 |

| −19.22 
| 7.44 
| <154.4 |
| GS4_27055 | 53.161714 | −27.785390 |

| −20.34 
| 7.44 
| <38.4 |
| GS4_27958 | 53.138064 | −27.781866 |

| −18.27 
| 7.48 
| <846.2 |
| GN4_23416 | 189.333069 | 62.257233 |

| −21.19 
| 7.54 
| <66.7 |
| GS3_36060 | 53.172602 | −27.743931 |

| −21.11 
| 7.54 
| <43.6 |
| GN2_20084 | 189.249817 | 62.241226 |

| −20.82 
| 7.58 
| <39.7 |
| GS4_5432952 | 53.170708 | −27.782452 |

| −17.68 
| 7.63 
| <916.7 |
| GN7_11906 | 189.117416 | 62.201412 |

| −20.61 
| 7.65 
| <42.2 |
| GN7_16124 | 189.084152 | 62.222023 |

| −21.37 
| 7.68 
| <34.2 |
| GN2_5436513 | 189.245880 | 62.244953 |

| −19.07 
| 7.69 
| <230.4 |
| GN2_23331 | 189.197769 | 62.256966 |

| −19.52 
| 7.71 
| <274.8 |
| GN2_20338 | 189.203125 | 62.242481 |

| −20.66 
| 7.72 
| <42.2 |
| GN5_36116 | 189.161255 | 62.334435 |

| −21.47 
| 7.75 
| <44.5 |
| GN4_28143 | 189.300125 | 62.280354 |

| −19.90 
| 7.75 
| <99.6 |
| GN4_22848 | 189.336029 | 62.254650 |

| −19.71 
| 7.89 
| <165.6 |
| GN7_14602 | 189.168625 | 62.214306 |

| −20.05 
| 7.91 
| <186.5 |
| ERSPRIME_5454792 | 53.072163 | −27.700729 |

| −20.70 
| 7.92 
| <69.5 |
| GN3_5454841 | 189.214523 | 62.305443 |

| −19.50 
| 7.95 
| <240.2 |
| GS4_26328 | 53.164701 | −27.788230 |

| −19.80 
| 7.95 
| <73.6 |
| GN3_34236 | 189.287003 | 62.318020 |

| −20.71 
| 8.00 
| <62.4 |
| GN4_5439303 | 189.333542 | 62.254501 |

| −18.75 
| 8.15 
| <516.4 |
| GN3_33315 | 189.224442 | 62.311329 |

| −21.39 
| 8.18 
| <38.7 |
Notes.
a The listed IDs are encoded with their observed CLEAR fields and matched 3D-HST IDs. We use 5400000 + IDs from Finkelstein et al. (2015) for 3D-HST unmatched objects. b MUV is estimated from the averaged flux over a 1450–1550 Å bandpass from the best-fit galaxy SED model. c We present the 1σ range of zphot. d 3σ upper limits, measured from the median flux limits from individual spectra. e This object is not included in the analysis for the Lyα EW distribution and the IGM transmission due to the tentative emission-line detection.A machine-readable version of the table is available.
Footnotes
- 12
This ratio is often interpreted as the Lyα transmission in the IGM under the assumption that the evolution in this ratio is dominated by the process of reionization.