Abstract
Coronal jets are transient narrow features in the solar corona that originate from all regions of the solar disk: active regions, quiet Sun, and coronal holes. Recent studies indicate that at least some coronal jets in quiet regions and coronal holes are driven by the eruption of a minifilament following flux cancellation at a magnetic neutral line. We have tested the veracity of that view by examining 60 random jets in quiet regions and coronal holes using multithermal (304, 171, 193, and 211 Å) extreme ultraviolet images from the Solar Dynamics Observatory (SDO)/Atmospheric Imaging Assembly and line-of-sight magnetograms from the SDO/Helioseismic and Magnetic Imager. By examining the structure and changes in the magnetic field before, during, and after jet onset, we found that 85% of these jets resulted from a minifilament eruption triggered by flux cancellation at the neutral line. The 60 jets have a mean base diameter of 8800 ± 3100 km and a mean duration of 9 ± 3.6 minutes. These observations confirm that minifilament eruption is the driver and magnetic flux cancellation is the primary trigger mechanism for most coronal hole and quiet region coronal jets.
1. Introduction
Solar coronal jets are narrow, short-lived coronal features that occur frequently throughout the entire solar magnetic cycle (Shimojo et al. 1998; Wang et al. 1998; Savcheva et al. 2007; Hong et al. 2011; Raouafi et al. 2016). These events have been observed in all regions of the solar surface: in active regions (Shibata et al. 1992; Innes et al. 2011; Panesar et al. 2016; Sterling et al. 2016, 2017), quiet regions (Hong et al. 2011; Innes et al. 2016), and coronal holes (Cirtain et al. 2007; Nisticò et al. 2009; Pucci et al. 2013; Sterling et al. 2015; Panesar et al. 2018a). In addition to being wide-spread across the solar surface, they also occur very frequently; Savcheva et al. (2007) found that jets in polar coronal holes occur at an average rate of 60 jets per day. Coronal jets are most often observed in extreme ultraviolet (EUV) (Culhane et al. 2007; Zheng et al. 2013; Adams et al. 2014) and X-ray emission (Canfield et al. 1996; Yokoyama 1998; Alexander & Fletcher 1999; Cirtain et al. 2007; Glesener et al. 2012).
Coronal jets are characterized by a bright point (also known as the jet bright point, or JBP) at an edge of the base of the jet (Shen et al. 2012; Young & Muglach 2014; Sterling et al. 2015; Panesar et al. 2016) and a jet spire of collimated outward moving plasma (Shimojo et al. 1996; Shen et al. 2012; Young & Muglach 2014). Additionally, recent studies (e.g., Hong et al. 2011; Shen et al. 2012; Sterling et al. 2015) have noted the presence of a minifilament that sits at the site of the forthcoming JBP and erupts to drive the jet. Minifilaments are usually seen to begin rising earlier (≤1 minute) than the appearance of the JBP (Moore et al. 2018). Some earlier studies argued (based on observations with older data sets) that flux emergence may lead to jets (Shibata et al. 1992, 2007; Moreno-Insertis et al. 2008). More recent on-disk jet studies have found in many cases consistent evidence of magnetic flux cancellation prior to and during jet onset (Hong et al. 2011; Huang et al. 2012; Young & Muglach 2014; Panesar et al. 2016). Panesar et al. (2016) investigated the magnetic trigger mechanism of 10 randomly selected on-disk quiet region jets and found that flux cancellation was the trigger of each of these jets. In addition to larger coronal jets, small-scale jets (Panesar et al. 2018b) are also observed to erupt from neutral lines at which flux is canceling. As shown in Panesar et al. (2017), jets typically occur following the formation of a cool-plasma minifilament residing over the magnetic neutral line between canceling positive-polarity and negative-polarity flux. Thus, coronal jets appear to be miniature versions of larger-scale eruptions that make coronal mass ejections (Sterling et al. 2018).
Figure 1 is a diagram of the inferred jet-production process from Panesar et al. (2016), based on their Atmospheric Imaging Assembly (AIA) and Helioseismic and Magnetic Imager (HMI) observations. Figure 1(a) shows schematically two neighboring bipoles having adjacent negative-polarity ends on the photosphere, the smaller of the two containing a highly sheared and twisted field of a flux rope that holds a minifilament. The minifilament sits directly over the magnetic neutral line between the positive- and negative-polarity flux patches. As the opposite-polarity flux patches continue to approach each other and cancel (Figure 1(b)), the minifilament field becomes increasingly unstable due to unleashing of the flux rope through slow tether-cutting flux cancellation driven by the converging photospheric flows. The magnetic pressure in the increasingly unleashed flux rope pushes the minifilament upwards, and the field starts to erupt. This results in runaway tether-cutting internal reconnection (Moore & Roumeliotis 1992) at a current sheet within the legs of the field enveloping the erupting minifilament flux rope. As this field erupts outwards it reconnects on its outside with the neighboring far-reaching oppositely directed field lines (“external reconnection”). The low lying red loop in Figure 1(b) represents the JBP that appears at the location where the minifilament originally resided. The external reconnection creates new magnetic connections in two places: closed field lines over the large, left-most bipole (Figure 1(c)) that causes external brightenings to appear in and around the base of the jet in EUV images, and reconnected open or far-reaching field lines (Figure 1(c)). Minifilament plasma escapes out along the reconnected open or far-reaching field to form part of the jet spire.
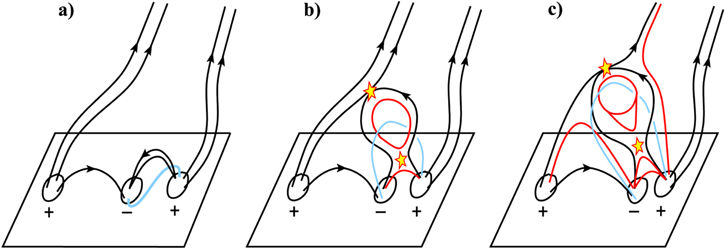
Figure 1. From Panesar et al. (2016), an illustration of inferred coronal jet production. In this schematic, the solar surface is represented by the rectangular box, and the magnetic field lines are represented by the black lines. The ellipses marked by + and − represent positive- and negative-polarity flux patches. The blue line represents the minifilament, which in panel (a) is enveloped in highly sheared and twisted magnetic field lines above the magnetic neutral line. As the negative minority flux patch approaches and cancels with the positive majority flux patch on the right, the minifilament field begins to erupt outwards, as in panel (b). This results in internal reconnection (lower star) between the legs of minifilament-carrying field, as well as external reconnection (upper star) of the minifilament-carrying field with adjacent outward-reaching field (with the two not necessarily starting at the same time). The external reconnection produces a reconnected field represented by the two red lines external to the minifilament-carrying field in panel (c); one is the far-reaching red field line along which the jet plasma escapes, forming the jet spire, and the other is the red external loop below the external reconnection star.
Download figure:
Standard image High-resolution imageThe abovementioned papers have each analyzed only one event or a limited number of jet events, so the triggering and driving mechanisms of coronal jets are not yet fully established. In this paper, we test with a larger sample of non-active-region coronal jets whether flux cancellation and minifilament eruption usually cause coronal jets. To this end, we look for minifilament eruptions in and analyze the magnetic field evolution of 60 randomly selected solar coronal jets in quiet regions and coronal holes. We use Solar Dynamics Observatory (SDO)/AIA EUV animations to follow the jet emission, and use SDO/HMI line-of-sight magnetograms to track the magnetic flux over time at the jet-base region. With the high resolution and high cadence HMI magnetograms we are able to see flux cancellation that might not have been visible in other studies that used magnetograms with lower quality. Our study of 60 solar coronal jets indicates that minifilament eruption is usually the driver and flux cancellation is usually the trigger mechanism of solar coronal jets.
2. Instrumentation and Data
This study uses multithermal (171, 193, 211, and 304 Å) EUV images from SDO/AIA to study the eruption of the minifilament and jet spire. SDO/AIA takes high resolution (06 pixel−1) and high temporal cadence (12 s) full-Sun images in seven EUV wavelengths (Lemen et al. 2012). We primarily used 171 and 193 Å images for this study, as we found pre-jet minifilaments to be best seen in 171 Å (0.6 MK, Lemen et al. 2012) and coronal hole jets to be easily seen in 193 Å (peak temperatures of 1.5 MK, Lemen et al. 2012). We used both 193 Å data and 211 Å (peak temperatures of 2 MK) data to confirm the presence of a jet in coronal holes and the quiet Sun, but used 171 Å data to measure base width and jet lifetime.
To analyze the magnetic field evolution, we used line-of-sight magnetograms from SDO/HMI. SDO/HMI produces high-resolution (05 pixel−1) magnetograms with a temporal cadence of 45 s that allow us to examine closely the photospheric magnetic field around the jet-base region (Schou et al. 2012). We use magnetogram data to track the evolution of the photospheric magnetic flux in the jet-base region from approximately 6 hr prior to jet onset to approximately 1 hr after the jet.
For this study we used JHelioviewer (Müller et al. 2017) to randomly find 60 coronal jets in zoomed-in quiet regions and zoomed-in coronal holes, 30 jets in each type of region. We downloaded SDO/AIA and SDO/HMI for 200″ × 150″ areas surrounding each of the 60 jets from the Joint Science Operations Center cutout service6 (JSOC). We downloaded AIA data at a 12 s cadence and HMI data at a 45 s cadence to observe the structure and magnetic evolution of each jet. All of the data were derotated to the middle time of each data set in order to remove the drift from solar rotation. With the derotated data, we selected a smaller field of view focused closely on the jet-base region to perform measurements and to make animations of each jet. All jets and their parameters can be found in Table 1.
Table 1. Measured Parameters of Coronal Jet Observations
| Event | Date | Timea | Locationb | Regionc | Erupting MF | Visibility of | Jet Durationf | Base Widthg |
|---|---|---|---|---|---|---|---|---|
| No. | (UT) | x, y (arcsec) | Visibilityd | Cancellatione | (minutes) | (km) | ||
| 1 | 2017 May 18 | 11:40 | −600, 64 | qr | y | y | 13 ± 3 | 7500 ± 1900 |
| 2 | 2017 Apr 16 | 6:51 | −73, 321 | qr | y | y | 9 ± 2 | 8000 ± 300 |
| 3 | 2017 Apr 14 | 9:04 | 82, −209 | qr | y | y | 12 ± 2 | 6400 ± 700 |
| 4 | 2017 Apr 11 | 23:38 | 420, 475 | qr | y | y | 12 ± 2 | 8000 ± 1800 |
| 5 | 2017 Apr 10 | 16:56 | 199, 127 | qr | y | y | 10 ± 1 | 8000 ± 200 |
| 6 | 2017 Apr 4 | 8:29 | −496, 75 | qr | y | y | 7 ± 2 | 5700 ± 100 |
| 7 | 2017 Mar 27 | 3:14 | 406, −15 | ch | y | y | 13 ± 2 | 6700 ± 1800 |
| 8 | 2017 Mar 24 | 2:15 | −211, −135 | ch | y | y | 7 ± 2 | 12600 ± 2600 |
| 9 | 2017 Mar 24 | 5:48 | −180, −134 | ch | y | y | 5 ± 2 | 11800 ± 500 |
| 10 | 2017 Mar 23 | 0:35 | 533, −122 | ch | y | y | 8 ± 2 | 5100 ± 700 |
| 11 | 2017 Mar 22 | 4:56 | −485, 69 | ch | y | y | 15 ± 2 | 8600 ± 170 |
| 12 | 2017 Mar 21 | 6:31 | 245, 244 | ch | y | h | 16 ± 2 | 11700 ± 900 |
| 13 | 2017 Mar 18 | 0:53 | −480, −82 | ch | y | y | 10 ± 2 | 5000 ± 1400 |
| 14 | 2017 Mar 17 | 7:00 | −640, −145 | ch | y | y | 4 ± 1 | 9000 ± 900 |
| 15 | 2017 Mar 17 | 6:54 | −686, −175 | qr | y | h | 5 ± 1 | 9900 ± 2350 |
| 16 | 2017 Mar 13 | 9:49 | 491, 261 | qr | i | y | 5 ± 3 | 6340 ± 800 |
| 17 | 2017 Mar 10 | 6:15 | −66, 140 | qr | y | h | 8 ± 1 | 5000 ± 750 |
| 18 | 2017 Mar 9 | 0:17 | −62, −114 | qr | y | y | 9 ± 2 | 7100 ± 1100 |
| 19 | 2017 Mar 5 | 3:06 | 372, 208 | qr | y | y | 8 ± 4 | 4600 ± 1300 |
| 20 | 2017 Mar 1 | 1:50 | −305, 252 | qr | y | y | 14 ± 2 | 3900 ± 2000 |
| 21 | 2017 Feb 28 | 21:53 | 659, 91 | ch | y | h | 6 ± 2 | 7450 ± 1100 |
| 22 | 2017 Feb 28 | 18:23 | 659, 91 | ch | y | y | 9 ± 3 | 12839 ± 3848 |
| 23 | 2017 Feb 28 | 21:47 | 694, 239 | qr | i | y | 6 ± 1 | 3490 ± 200 |
| 24 | 2017 Feb 22 | 15:40 | −230, 32 | qr | y | y | 8 ± 2 | 6300 ± 1300 |
| 25 | 2017 Feb 20 | 4:57 | −256, 247 | ch | y | y | 6 ± 2 | 7200 ± 150 |
| 26 | 2017 Feb 14 | 5:29 | −269, −338 | ch | y | y | 11 ± 2 | 6000 ± 500 |
| 27 | 2017 Feb 2 | 23:14 | 647, −439 | ch | y | y | 7 ± 2 | 5900 ± 1400 |
| 28 | 2017 Jan 31 | 1:15 | 214, −49 | ch | y | y | 6 ± 2 | 4000 ± 1300 |
| 29 | 2017 Jan 29 | 15:09 | −134, −353 | ch | y | y | 18 ± 3 | 4700 ± 550 |
| 30 | 2017 Jan 27 | 15:25 | −421, −284 | ch | y | y | 6 ± 1 | 7200 ± 150 |
| 31 | 2017 Jan 24 | 9:38 | 530, −92 | qr | y | y | 13 ± 1 | 7000 ± 400 |
| 32 | 2017 Jan 23 | 1:34 | −435, −3 | ch | y | y | 12 ± 2 | 7400 ± 1300 |
| 33 | 2017 Jan 22 | 13:22 | −734, −137 | qr | y | y | 11 ± 2 | 5700 ± 1200 |
| 34 | 2017 Jan 19 | 22:58 | −49, 83 | ch | y | y | 11 ± 2 | 4800 ± 500 |
| 35 | 2017 Jan 17 | 11:54 | 279, 510 | qr | y | h | 4 ± 1 | 7300 ± 250 |
| 36 | 2017 Jan 9 | 5:10 | 155, 402 | qr | y | y | 7 ± 2 | 7800 ± 2600 |
| 37 | 2017 Jan 7 | 14:43 | −373, 403 | qr | y | h | 15 ± 2 | 4500 ± 250 |
| 38 | 2017 Jan 3 | 18:06 | −31, −660 | ch | y | h | 9 ± 3 | 6400 ± 650 |
| 39 | 2017 Jan 2 | 16:09 | −114, −58 | ch | y | y | 11 ± 3 | 10100 ± 3500 |
| 40 | 2016 Dec 31 | 8:20 | 654, −223 | qr | y | y | 15 ± 2 | 12400 ± 4000 |
| 41 | 2016 Dec 28 | 19:53 | −50, 176 | ch | y | y | 7 ± 2 | 7100 ± 1500 |
| 42 | 2016 Dec 28 | 0:20 | 398, 79 | qr | y | h | 6 ± 3 | 17700 ± 2200 |
| 43 | 2016 Dec 27 | 10:39 | −462, −385 | qr | y | y | 5 ± 2 | 11100 ± 500 |
| 44 | 2016 Dec 26 | 16:30 | −532, 29 | ch | y | y | 8 ± 2 | 4600 ± 500 |
| 45 | 2016 Dec 11 | 5:33 | −304, 429 | qr | y | y | 6 ± 2 | 6400 ± 650 |
| 46 | 2016 Dec 11 | 5:00 | −390, 405 | qr | i | y | 6 ± 2 | 5000 ± 1500 |
| 47 | 2016 Dec 8 | 2:22 | −168, 303 | ch | y | yj | 7 ± 2 | 9412 ± 724 |
| 48 | 2016 Dec 3 | 3:53 | −470, −476 | ch | i | y | 11 ± 3 | 6400 ± 750 |
| 49 | 2016 Dec 3 | 4:20 | −358, −489 | ch | y | y | 17 ± 2 | 11700 ± 500 |
| 50 | 2016 Nov 28 | 16:16 | 7, −83 | qr | y | y | 9 ± 2 | 6800 ± 300 |
| 51 | 2016 Nov 25 | 7:09 | −375, −25 | qr | y | y | 4 ± 2 | 6400 ± 1500 |
| 52 | 2016 Nov 20 | 12:26 | −57, 433 | ch | y | y | 15 ± 2 | 8600 ± 400 |
| 53 | 2016 Nov 19 | 9:12 | −41, −511 | qr | y | y | 13 ± 2 | 12200 ± 1800 |
| 54 | 2016 Oct 24 | 5:48 | −14, 413 | ch | y | yj | 6 ± 3 | 6700 ± 1300 |
| 55 | 2016 Sep 24 | 6:49 | −661, −144 | ch | y | yj | 10 ± 2 | 8300 ± 1000 |
| 56 | 2016 Sep 22 | 13:26 | −663, 354 | ch | y | h | 4 ± 3 | 8400 ± 1100 |
| 57 | 2016 Sep 18 | 16:10 | 75, 103 | qr | y | y | 7 ± 3 | 8250 ± 800 |
| 58 | 2016 Sep 17 | 2:08 | −105, −234 | ch | y | y | 7 ± 3 | 10200 ± 1400 |
| 59 | 2016 Sep 12 | 10:15 | −167, 312 | qr | y | y | 8 ± 1 | 9700 ± 1300 |
| 60 | 2016 Sep 11 | 11:28 | −393, 268 | qr | y | y | 10 ± 2 | 6900 ± 1200 |
| Average | 90% | 85% | 9 ± 4 | 8800 ± 3100 | ||||
Notes.
aThe approximate time of jet spire formation. bLocation of the jet on the solar disk. cThe region, coronal hole (ch) or quiet region (qr), in which the jet resides. dy indicates the presence of a visible erupting minifilament (MF) during the jet. ey indicates the presence of visible cancellation prior to jet onset. fThis is the duration of the spire’s growth, measured from start of the spire to maximum spire length. Uncertainties are estimated from three or four repeated measurements along the spire. gWidth of jet-base region measured at its widest point approximately 1 minute prior to jet formation. Uncertainties are estimated from from three or four repeated measurements of the base width. hConvergence not clear. iMinifilament not clear. jSome emergence prior to cancellation.Download table as: ASCIITypeset image
3. Results
3.1. Overview
We report on the structure and magnetic origins of 60 EUV coronal jets ≲50° from disk center, 30 of which are from coronal holes, and 30 from quiet regions (see Table 1). We looked for erupting minifilaments at the times of the jets in these images. By registering the EUV images from SDO/AIA with the magnetograms from SDO/HMI, we were able to track the flux changes that occurred leading up to these jets. Table 1 lists the 60 jets and their measurements. In Sections 3.2 and 3.3 we present two examples of coronal hole jets and two examples of quiet region jets.
To examine the magnetic field evolution quantitatively, we measured either the majority-polarity or the minority-polarity flux, whichever was the more isolated in the jet-base region from prior to (∼6 hr) until well after (∼1 hr) the jet onset. We measure the flux of that polarity in a box that encloses the isolated flux patch and has no discernible flow of flux of that polarity across its perimeter. Figures 3, 5, 7, and 9 show the measured flux plotted as a function of time. For each case, we integrated the isolated-polarity flux over the entire box at each time step.
We also found the base width and jet duration for each jet (see Table 1). To find the base width of each jet, we measured the longest side of the jet base approximately one minute prior to the onset of the jet spire in each event. For the jet duration, we measure the time from when the spire is first discernible until it reaches its maximum length; i.e., by duration we mean the growth time of the spire. Uncertainties in the base width and durations were estimated as the standard deviation from repeated measurements of the quantities (three or four times for each measurement). (We ignored line-of-sight foreshortening effects. Because of this effect, some of the base-width measurements could be underestimated; in the most extreme case the underestimate factor would be ∼1/cos(50), about 50%; but most events would be effected less than this, in part because they are much less than 50 deg from disk center.) All of these measurements were made using 171 Å EUV images.
3.2. Coronal Hole Jets
We randomly selected 30 EUV coronal hole jets from 2016 September to 2017 May (see Table 1). We present two detailed examples of these coronal hole jets in Sections 3.2.1 and 3.2.2.
3.2.1. Coronal Hole Jet on 2017 January 2 (Event 39)
A coronal hole jet was observed starting at approximately 16:09 on 2017 January 2 (see Table 1 for details). A pre-jet minifilament was present in the jet-base region (Figure 2(a), red arrow; see the corresponding animation) residing above the magnetic neutral line between majority (black) and minority (white) flux patches (Figures 2(b), (f)). This minifilament is visible in Figure 2(a), almost an hour prior to the jet. The JBP (Figure 2(b)) then appeared at the site of the minifilament as the minifilament slowly began to rise, and then erupted into the jet spire (Figures 2(c), (d)). This progression appears analogous to that of typical filament eruptions, where the flare arcade grows over the neutral line in the wake of the erupting filament. The JBP is a miniature flare arcade made by internal reconnection of the legs of the erupting minifilament field. The duration of the jet spire was 11 ± 3 minutes, and the jet had a base width of approximately 12,600 km. We also observed new loop brightenings extending to majority flux patches (e.g., Figure 2(d), green arrow in Figure 2(h)).
Download figure:
Video Standard image High-resolution imageFigure 2. Example coronal hole jet, observed on 2017 January 2 (Event 39). Panels (a)–(d) show 171 Å AIA intensity images. The red arrow in panel (a) points to the pre-eruption minifilament. The white arrow in panel (b) shows the JBP. The blue arrows in panels (c) and (d) indicate the jet spire. White and black contours in (b) outline the positive- and negative-polarity flux patches, respectively, at the time of the AIA image. Panels (e)–(h) show HMI magnetogram images of the same region. The boxed areas in panels (e)–(h) enclose the measured negative flux plotted in Figure 3. The green arrow in panel (h) points to a nearby patch of majority (negative) flux to which EUV loops extend in (c) and (d). Animations of the AIA 171 Å and HMI magnetogram data showing the complete evolution of this jet are available. The AIA 171 animation runs from 14:50 to 16:50 UT, while the HMI magnetogram animation runs from 10:49 to 16:46 UT. The animations are unannotated.
Download figure:
Video Standard image High-resolution imageFigures 2(e)–(h) shows the HMI magnetogram data for the jet observed on 2017 January 2. Initially, about 5 hr prior to the jet, the positive (white) and negative (black) flux patches were far apart (see the corresponding animation available). With time, the flux patches approached each other and eventually started canceling at the magnetic neutral line between them. This flux cancellation occurred continuously for 5 hr, until the minifilament erupted, producing the jet. We measured the isolated negative majority flux for 5.5 hr in the region indicated by the white box in Figure 2 panels (e)–(h). Figure 3 shows the total negative flux in the box as a function of time. It shows an overall decrease over the 5 hr prior to the jet, providing clear evidence of flux cancellation in the jet-base region leading to the eruption of the minifilament and jet onset (red line in Figure 3). This flux evolution is not monotonic, however, as there is a hump in the curve between ∼13:00 and 14:00 UT. Inspection of magnetograms over this period indicates that the increase is due to coalescence of negative flux in the jet-base region over this time (between Figures 2(e) and (f)), resulting in weak negative flux rising above the noise level. Even so, there is still an overall downward trend in the negative-polarity flux plot, consistent with cancellation dominating the field changes over the period.
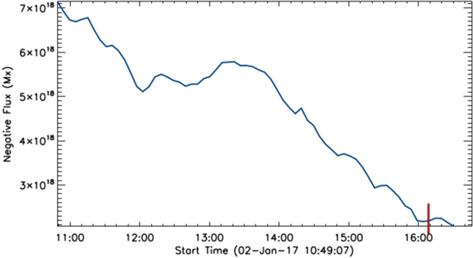
Figure 3. Flux-time plot from the base of the coronal hole jet of Figure 2. This shows the majority (negative) flux integrated over the box in Figures 2(e)–(h) as a function of time. The red line designates the time of jet onset (16:09 UT).
Download figure:
Standard image High-resolution image3.2.2. Coronal Hole Jet on 2017 March 22 (Event 11)
A coronal hole jet was observed on 2017 March 22 (see Table 1 for measurements). Similar to the jet discussed in Section 3.2.1, we observed a minifilament over the magnetic neutral line between the majority-polarity flux patch (negative) and the minority-polarity flux patch (positive, Figure 4). However, in this case, two jets occurred in close proximity from different magnetic neutral lines. We measured the larger jet, but shortly after it occurred, at 4:56 UT, a smaller jet occurred at 5:07 UT. We did not measure the smaller, second jet because its proximity to the larger jet made it difficult to obtain accurate measurements. The pre-jet minifilament (preceding the first jet) was visible at least 1 hr prior to the jet spire occurring (see the corresponding animation). At ∼04:50 UT, the minifilament began to rise (Figure 4(a)) and the JBP appeared (Figures 4(b), (f)) at the location (neutral line) of the minifilament before the eruption. The growth duration of the spire was 15 ± 2 minutes. One minute prior to formation of the jet spire, we measured the jet base to be 8700 km wide.
Download figure:
Video Standard image High-resolution imageFigure 4. Another example coronal hole jet; observed on 2017 March 22 (Event 11). Panels (a)–(d) show 171 Å AIA intensity images. The red arrow in panel (a) points to the erupting minifilament. The white arrow in panel (b) shows the JBP. The blue arrows in panels (c) and (d) indicate the jet spire, which includes the erupting minifilament. Panels (e)–(h) show HMI magnetogram images of the same region. White and black contours in (c) represent the positive- and negative-polarity flux, respectively, at the time of the AIA image. The boxed areas in panels (e)–(h) enclose the measured positive flux plotted in Figure 5. Animations showing the entire evolution of this jet are available. The AIA 171 Å animation runs from 03:45 to 5:45 UT, while the HMI magnetogram animation runs from 23:45 on March 21 to 05:42 UT on March 22. The animations are unannotated.
Download figure:
Video Standard image High-resolution imageFigure 5 shows the measured positive minority flux from ∼5 hr prior to the jet at 04:56UT, to 30 minutes after jet onset. The measured positive flux is located in the jet-base region indicated by the white box in Figure 4 panels (e)–(h). As with the jet discussed in Section 3.2.1, on average there is an overall decrease in measured flux leading up to the jet (red line, Figure 5) that occurs as the opposite-polarity flux patches approach the magnetic neutral line and cancel.
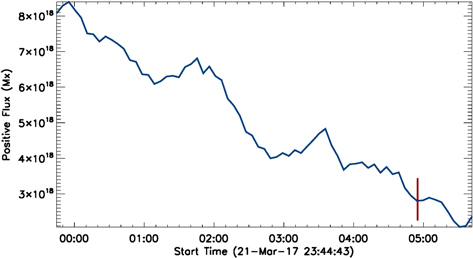
Figure 5. Flux-time plot from the base of the coronal hole jet of Figure 4. This shows the minority (positive) flux integrated over the box in Figures 4(e)–(h) as a function of time. The red line designates the time of jet onset (04:56 UT).
Download figure:
Standard image High-resolution image3.3. Quiet Region Jets
We observed 30 EUV coronal jets in quiet regions from 2016 September to 2017 May (see Table 1). We present two examples of these quiet region jets in Sections 3.3.1 and 3.3.2.
3.3.1. Quiet Region Jet on 2016 November 25 (Event 51)
A quiet region coronal jet was observed on 2016 November 25. In this jet region there are two jet-producing minifilament eruptions from the same neutral line: a partial minifilament eruption producing a weak jet at 06:21 UT at 06:21 UT (and there is an even weaker precursor to this jet at 06:00 UT), which we have not listed in Table 1; and a complete minifilament eruption producing a final jet at 07:11 UT (see the animated Figure 6). As with the previously discussed events, pre-jet cancellation occurred at the base of both of these jets, and the continued cancellation led to both jets. Similar homologous jets from the same neutral line have also been observed by Panesar et al. (2017) in their study of quiet region jets (and in Sterling et al. 2017 in active region jets). One minute prior to the final jet onset, the width of the jet-base region was approximately 8100 km. A minifilament starts to rise at 07:01:22 UT (Figure 6(a) and the corresponding animation). At 07:12 UT we observed a JBP (Figure 6(c), white arrow) at the site of minifilament formation as well as an external brightening at a nearby patch of positive majority flux (Figure 6(c), green arrow in 6(g)). After the rise of the minifilament, the jet spire started to extend and grew for 4 ± 2 minutes (Figure 6(d)). These observations follow behavior similar to that of the coronal hole jet discussed in Section 3.2.1.
Download figure:
Video Standard image High-resolution imageFigure 6. Example quiet region jet; observed on 2016 November 25 (Event 51). Panels (a)–(d) show 171 Å AIA intensity images. The red arrow in panel (a) points to the erupting minifilament. The white arrow in panel (c) shows the JBP. The blue arrow in panel (d) indicates the jet spire next to the (mostly confined) erupting minifilament. Panels (e)–(h) show HMI magnetogram images of the same region. The green arrow in panel (g) points to the majority flux patch, to which EUV jet-base brightenings extend in (c). The boxed areas in panels (e)–(h) enclose the measured negative flux plotted in Figure 7. Animations of the AIA 171 Å and HMI magnetogram data showing the complete evolution of this jet are available. The AIA 171 animation runs from 05:45 to 07:45 UT, while the HMI magnetogram animation runs from 01:45 to 07:42 UT. The animations are unannotated.
Download figure:
Video Standard image High-resolution imageWe measured the minority (negative polarity in this case) flux prior to and during the jet in the region indicated by the white box in Figure 6 panels (e)–(h). We present this measured flux as a function of time in Figure 7. Starting at 03:30 UT, about 4 hr prior to the jet, we see a continuous decrease in the overall negative flux in the jet-base region leading up to the jet at 07:09 UT. Prior to this time, flux was coalescing, which caused the increase in measured flux at 3:00 UT (Figure 7). Similar to the jets discussed in Section 3.2, this decrease in flux occurs as opposite-polarity flux patches were approaching the magnetic neutral line and canceling with each other.
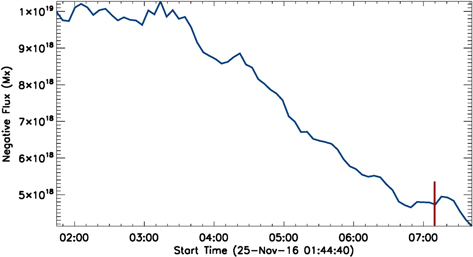
Figure 7. Flux-time plot from the base of the quiet region jet of Figure 6. This shows the minority (negative) flux integrated over the box in Figures 6(e)–(h) as a function of time. The red line designates the time of jet onset (07:09 UT).
Download figure:
Standard image High-resolution image3.3.2. Quiet Region Jet on 2017 April 10 (Event 5)
We observed a quiet region coronal jet at 16:56 UT on 2017 April 10. As with the jets discussed in Section 3.2, we observed a minifilament (Figure 8(a)) that lifted off from a magnetic neutral line, followed by the appearance of a JBP (Figure 8(b)) at that same location. During the eruption onset, the minifilament slowly rose to produce the jet spire (Figure 8(c)). One minute before the appearance of the jet spire, the jet-base region was approximately 8300 km in diameter. Upon eruption of the minifilament, the jet spire grew for 10 ± 1 minutes. In the AIA 171 images we see some smaller flows starting at 16:39 UT that precede the main jet at 16:56 UT. These smaller flows are accompanied by brightenings in the jet-base region, leading us to believe that they are homologous weaker jets resulting from the same magnetic neutral line (like those discussed in Section 3.3.1).
Download figure:
Video Standard image High-resolution imageFigure 8. Second example of a quiet region jet; observed on 2017 April 10 (Event 5). Panels (a)–(d) show 171 Å AIA intensity images. The red arrow in panel (a) points to the pre-eruption minifilament. The white (positive) and black (negative) contours in panel (b) represent the flux at the time of the AIA image. The white arrow in panel (b) shows the JBP. The blue arrows in panels (c) and (d) indicate the jet spire. Panels (e)–(h) show HMI magnetogram images of the same region. The boxed areas in panels (e)–(h) enclose the measured negative flux plotted in Figure 9. Animations of the AIA 171 Å and HMI magnetogram data showing the complete evolution of this jet are available. The AIA 171 animation runs from 16:00 to 18:00 UT, while the HMI magnetogram animation runs from 12:00 to 17:57 UT. The animations are unannotated.
Download figure:
Video Standard image High-resolution imageWe measured the negative minority flux in the jet-base region and plotted it as a function of time in Figure 9. The flux was measured in the region bounded by the white box in Figures 8(e)–(h). Starting two hours prior to the jet, the positive- and negative-polarity flux patches approached the magnetic neutral line and canceled. This behavior is reflected in the continuous overall decrease of negative flux that we see in Figure 9 leading up to the jet at 16:56 UT. Prior to ∼15:30 UT, negative flux coalesced in the measured region, causing the measurable increase in flux visible at 15:30 UT in Figure 9.
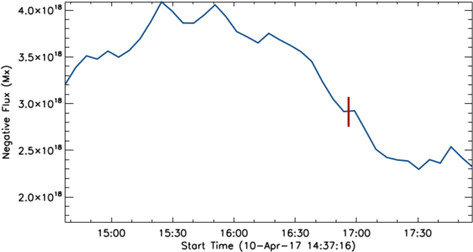
Figure 9. Flux-time plot from the base of the quiet region jet of Figure 8. This shows the minority negative flux integrated over the box in Figures 8(e)–(h) as a function of time. The red line designates the time of jet onset (16:56 UT).
Download figure:
Standard image High-resolution image3.4. Results for 60 Jets
We made a visual assessment of each jet, for (a) the behavior of the magnetic flux changes in the time period near the time of jet onset, and (b) whether we could detect a minifilament eruption at the time of the jet onset.
For most of the events, 51 in total (85%), we observed clear convergence and apparent cancellation of magnetic flux occurring along with the jet. There were only six quiet Sun jet cases, and three coronal hole jet cases, where we did not find clear evidence of flux cancellation; these nine exceptions are indicated in Table 1. In the nine cases where we did not observe clear flux cancellation, generally the flux was very weak at the location and time of the jet, so we consider that the measurement error was high. In some cases weak flux cancellation might be occurring; we expect that to have been the situation in several of these cases.
If we consider an erupting minifilament to be dark (absorbing) material expelled with the jet when viewed in AIA 171 Å animations, then we can identify erupting minifilaments in 56 events (all but four events), as indicated in Table 1. In one of the four exceptions (2016 December 3), the jet base is very small, so if a minifilament exists, it may be too small for AIA to resolve. In the three remaining exceptions any minifilament is either too faint or absent. Thus, while several of the visible minifilaments are relatively faint or otherwise tricky to detect (for example, the minifilament of 2017 January 3 (event 38) is difficult to recognize because it erupts toward the observer), we can identify them in over 90% of the events (56/60).
Thus, our conclusion is that a large majority of jets in quiet Sun and coronal holes are produced by minifilament eruptions, and those eruptions are triggered to erupt by magnetic flux cancellation at the jet-base region.
4. Summary and Discussion
We have examined 60 solar coronal jets in quiet regions and coronal holes with EUV images from SDO/AIA and magnetogram data from SDO/HMI. In the large majority of instances, the jet was preceded by a minifilament eruption prepared and triggered by continuous flux cancellation at the magnetic neutral line within the jet base. This is consistent with the findings and proposed picture by Sterling et al. (2015) and Panesar et al. (2016). Additionally, for our 60-jet sample we find a mean jet spire-growth duration of 9 ± 4 minutes and a mean jet-base width of 8800 ± 3100 km.
Our jet spire-growth-duration measurements are very similar to the EUV jets in Panesar et al. (2016; ∼12 minutes) and the X-ray jets of Savcheva et al. (2007; ∼10 minutes). Our jet-base width is nearly the same as the jet widths of Savcheva et al. (2007; 8000 km) and the mean erupting minifilament size of Sterling et al. (2015). However, our mean jet-base width is roughly half that of Panesar et al. (2016; ∼17,000 km) plausibly because Panesar et al. (2016) found their jets from viewing JHelioviewer animations of full-disk AIA 171 Å coronal EUV images, whereas we found our jets by viewing JHelioviewer animations of zoomed-in partial disk AIA 171 Å coronal EUV images of quiet regions and coronal holes. That is, the Panesar et al. (2016) study may have preferentially selected jets of larger size scale compared to the jets selected in this study.
The large majority of minifilament eruptions we observed are in agreement with Sterling et al. (2015) and Panesar et al. (2016), as shown in Figure 1. In each case, prior to the jet, a minifilament resides between opposite-polarity flux patches at the magnetic neutral line. As these flux patches approach the magnetic neutral line they continuously cancel and the minifilament eventually begins to erupt outwards. This eruption results in runaway internal reconnection within the erupting minifilament-carrying field as well as runaway external reconnection with the encountered outward-reaching field. The runaway internal reconnection creates the JBP that we observe in Figures 2(b), 4(c), 6(c), and 8(b). The runaway external reconnection produces new field lines, including the far-reaching field line along which the jet spire forms (Figures 2(d), 4(d), 6(d), and 8(d)). The runaway external reconnection also produces external brightenings between the minority-polarity patch of the pair of canceling flux patches and a nearby patch of majority-polarity flux (Figures 1(c), 2(b), and 6(c)).
In conclusion, we report observations of 60 random on-disk coronal jets in quiet regions and coronal holes. From our observations, we find that at least for the great majority of these jets, minifilament eruption is the driver and magnetic flux cancellation is the trigger mechanism for coronal hole and quiet region coronal jets.
R.A.M. gives special thanks to Dr. Navdeep Panesar for her time and mentorship throughout the research process, and to the NASA Marshall Space Flight Center, the Center for Space Plasma and Aeronomic Research at the University of Alabama in Huntsville, and the National Science foundation for supporting this study. R.A.M. was supported by the Research Experience for Undergraduates (REU) program at UAH and MSFC over summer 2017, which was funded by the National Science Foundation under grant No. AGS-1460767. N.K.P.acknowledges current support from NASA’s SDO/AIA contract (NNG04EA00C) to LMSAL and previous support by NPP at the NASA/MSFC, administered by USRA under contract with NASA. A.C.S. and R.L.M. acknowledge the support from the NASA HGI program, and by the Hinode Project. We acknowledge the use of SDO data. AIA is an instrument onboard the Solar Dynamics Observatory, a mission for NASA’s Living With a Star program.