Abstract
We present the results of the deep Subaru/FOCAS and Keck/MOSFIRE spectroscopy for four spatially extended [O iii] λλ4959, 5007 sources, dubbed [O iii] blobs, at z = 0.6–0.8 that are originally pinpointed by large-area Subaru imaging surveys. The line diagnostics of the rest-frame optical lines suggests that only one [O iii] blob, OIIIB-3, presents an active galactic nucleus (AGN) signature, indicating that hot gas of the rest of the [O iii] blobs is heated by star formation. One of such star-forming [O iii] blobs, OIIIB-4, at z = 0.838 has an [O iii] equivalent width of 845 ± 27 Å and an [O iii]-to-[O ii] λλ3726, 3729 ratio of [O iii]/[O ii] = 6.5 ± 2.7, which are as high as those of typical Green Peas. The spatially resolved spectrum of OIIIB-4 shows [O iii]/[O ii] = 5–10 over 14 kpc in the entire large [O iii] extended regions of OIIIB-4, unlike the known Green Peas, whose strong [O iii] emission region is compact. Moreover, OIIIB-4 presents no high-ionization emission lines, unlike Green Beans, which have extended [O iii] emission with a type 2 AGN. OIIIB-4 is thus a giant Green Pea, which is a low stellar mass (7 × 10⁷  ) galaxy with a very high specific star formation rate (sSFR = 2 × 10² Gyr−1), a high-ionization parameter (qion ∼ 3 × 108 cm s−1), and a low metallicity similar to those of Green Peas. Neither an AGN light echo nor a fast radiative shock likely takes place owing to the line diagnostics for spatially resolved components of OIIIB-4 and no detections of He ii λ4686 or [Ne v] λλ3346, 3426 lines that are fast radiative shock signatures. There is a possibility that the spatially extended [O iii] emission of OIIIB-4 is originated from outflowing gas produced by the intense star formation in a density-bounded ionization state.
1. Introduction
A galaxy is not a closed box that can evolve itself without exchanging materials with the environment. The accretion of cooled gas onto the galaxy is important for the galaxy to form new stars in the Λ cold dark matter (ΛCDM) model. However, the inflow alone would cause an overestimation of star formation at both low-mass and high-mass ends (e.g., Bell et al. 2003; Mutch et al. 2013). The feedback mechanism involving gas outflows becomes a default tool to resolve the discrepancy in hydrodynamic simulations (e.g., Benson et al. 2003; Somerville et al. 2008; Oppenheimer et al. 2010; van de Voort et al. 2011). The evolutional state of a galaxy is thus thought to depend on the balance of the gas flows in and out of the galaxy (e.g., Lilly et al. 2013). In addition, the galactic-scale outflow is considered a solution for various observational phenomena, including regulating the main sequence of galaxies on the mass–SFR (star formation rate) diagram (e.g., Noeske et al. 2007) and the mass–metallicity relation (e.g., Tremonti et al. 2004) and enriching the chemical abundance of interstellar medium (ISM) and intergalactic medium (IGM; e.g., Martin 2005; Rupke et al. 2005a, 2005b; Weiner et al. 2009; Coil et al. 2011).
Outflows have been massively studied in several types of galaxies ranging from normal star-forming galaxies (e.g., Weiner et al. 2009; Steidel et al. 2010; Erb et al. 2012; Martin et al. 2012; Bradshaw et al. 2013; Rubin et al. 2014) and submillimeter galaxies (e.g., Alexander et al. 2010) to more extreme systems like radio galaxies (e.g., Nesvadba et al. 2008; Liu et al. 2013), ultraluminous infrared galaxies (e.g., Heckman et al. 1990; Martin 2005; Rupke et al. 2005a, 2005b; Soto et al. 2012), and active galactic nuclei (AGNs; e.g., Cicone et al. 2014; Cheung et al. 2016; Rupke et al. 2017). Outflows are found to be ubiquitous in galaxies with an SFR surface density larger than ∼0.1  yr−1 kpc−2 and become stronger in more massive star-forming galaxies with higher SFRs (Heckman et al. 2000; Martin 2005; Weiner et al. 2009; Kornei et al. 2012; Martin et al. 2012). In the case of AGNs, the outflows strongly correlate with the black hole mass (MBH) in that the mass outflow rate increases with increasing MBH (Rupke et al. 2017). An active supermassive black hole alone could fuel the large-scale outflow even in a low-luminosity AGN (Cheung et al. 2016).
Most of these studies are based mainly on the optical/near-infrared (NIR) spectroscopic observations of blueshifted interstellar absorption lines such as Na i λλ5890, 5896, Mg ii λλ2796, 2803, Fe ii λ2374, and Fe ii λ2383 to indicate the outflow signature. No systematic search had been done by using only the imaging data until Yuma et al. (2013) proposed to use the narrowband technique to systematically identify the gas outflowing galaxies by selecting star-forming galaxies with the strong [O ii] λλ3726, 3729 emission line spatially extended over 30 kpc beyond the stellar components. They called this [O ii] extended object an “[O ii] blob,” or in short “O iiB.” The spatial extension of a metal line like the [O ii] emission line that is redshifted and falls into the narrowband image might indicate a large-scale outflow beyond the galaxy rather than evidence of a gas inflow from the metal-poor IGM (e.g., Aguirre et al. 2008; Fumagalli et al. 2011). Yuma et al. (2013) successfully identified 12 O iiBs at z ∼ 1.2, one of which is classified as an obscured AGN. The others are potentially normal star-forming galaxies, as they are not detected in X-ray or radio 1.4 GHz wavelengths. The hypothesis that the extended [O ii] emission line may represent the outflow from the [O ii] blobs is spectroscopically confirmed by the traditional method of detecting blueshifted interstellar absorption lines (Yuma et al. 2013; Harikane et al. 2014). The systematic search was then expanded toward lower and higher redshifts, i.e., z = 0.1–1.5 (Yuma et al. 2017). In Yuma et al. (2017), the spatially extended emission lines include [O ii] λλ3726, 3729, [O iii] λ5007, and Hα λ6563. The resulting sample is named accordingly as an [O ii] blob (O iiB), an [O iii] blob (O iiiB), and an Hα blob (HAB). They found 77 blobs at z = 0.4–1.5 in total, eight of which are likely to be powered by AGNs. It is suggested that the blobs are mostly normal star-forming galaxies. It is of interest to investigate an energy source for the extended emission lines of the blobs that are identified as normal star-forming galaxies.
Galaxies with large extensions of emission lines have recently been discovered by many studies. Lin et al. (2017) discovered a giant Hα blob with an Hα extent of 3–4 kpc in radius. The spatial extension of the [O iii] emission line is also found (Brammer et al. 2013; Sun et al. 2017). An AGN is thought to be a primary source of energy to produce the large-scale outflow in both the Hα blob discovered by Lin et al. (2017) and the [O iii] blobs studied by Sun et al. (2017). The latter work suggested that the size of the [O iii] extension strongly correlates with the AGN luminosity. Sun et al. (2017) also argued that there is no AGN luminosity threshold for launching the outflow, which is consistent with Cheung et al. (2016). This means that it is common to see the extended emission line in all AGNs regardless of their luminosities.
Although there are certain detailed studies about the extended emission lines in the normal star-forming galaxies (e.g., Genzel et al. 2011; Newman et al. 2012a, 2012b), the physical mechanism responsible for the spatially extended emission lines beyond the stellar component of the galaxies is still not well understood. To date, many studies about the ISM of galaxies are conducted with the integral field unit (IFU) observations (e.g., Förster Schreiber et al. 2009, 2014; Lin et al. 2017; Sun et al. 2017). This 3D imaging spectrograph enables researchers to investigate the spectra of the entire galaxies simultaneously with 2D imaging. In this paper, instead of using the IFU, we take a simple step by observing the [O iii] blobs at z = 0.63 and z = 0.83 that show no AGN signature in X-ray and radio wavelengths originally selected by Yuma et al. (2017) with a spectrograph in the multiobject spectroscopy mode. By designing the slit direction to cover the longest extension of the emission lines of the blobs, we are able to determine the emission-line ratios and examine the physical properties of the extended component of the emission lines along the slit direction.
In Section 2, we discuss the [O iii]-blob targets for the spectroscopic observations. Section 3 describes details of both optical and NIR observations and data reduction processes. We then report the results of systematic redshifts, outflow signature, AGN contribution, and properties of the ISM, including the radial profile of the [O iii] blobs, in Section 4. We also report the discovery of a giant Green Pea in this section. In Section 5, we discuss the plausible scenarios that could be responsible for the spatial extension of the emission lines seen in the [O iii] blobs. The last section, Section 6, is the summary of all our findings. Throughout this paper, we adopt the standard ΛCDM cosmology with H0 = 70 km s−1 Mpc−1, Ωm = 0.3, and Ωλ = 0.7. All magnitudes are given in the AB system (Oke & Gunn 1983).
2. Targets for Spectroscopy
We conduct the spectroscopic observations of four [O iii] blobs at z ∼ 0.63 and z ∼ 0.83. Our spectroscopic sample is originally identified as an [O iii] blob by Yuma et al. (2017). They conducted the systematic survey of [O ii], [O iii], and Hα blobs at z = 0.1–1.5, i.e., star-forming galaxies with strong [O ii], [O iii], and Hα emission lines, respectively, spatially extended over 30 kpc. The emission-line extension is measured down to a surface flux limit of 1.2 × 10⁻¹⁸ erg s−1 cm−2 arcsec−2. Among 77 blobs at z = 0.1–1.5 found by Yuma et al. (2017), there are 4 and 13 [O iii] blobs at z = 0.63 and z = 0.83, respectively. All blobs are cross-matched with the X-ray and radio catalogs to primarily check for the AGN existence. The X-ray source catalog is obtained from Ueda et al. (2008). It is observed with the European Photon Imaging Camera (Strüder et al. 2001; Turner et al. 2001) on the XMM-Newton telescope (Jansen et al. 2001). The flux limits of the catalog are 6 × 10⁻¹⁶, 8 × 10⁻¹⁶, 3 × 10⁻¹⁵, and 5 × 10⁻¹⁵ erg s−1 cm−2 in the 0.5–2 keV, 0.5–4.5 keV, 2–10 keV, and 4.5–10 keV bands, respectively. These flux limits approximately correspond to the X-ray luminosities of 1042 erg s−1 at z ∼ 0.7. The radio catalog is from Simpson et al. (2006). The radio data are observed with the Very Large Array in 1.4 GHz down to the limit of 100 μJy. All of the [O iii] blobs are not detected in X-ray and radio wavelengths.
The criteria of the spectroscopic targets are that (1) they are among the [O iii] blobs with the largest extension of the [O iii] emission line and/or (2) they are located close to each other so that we can maximize the number of the [O iii] blobs observed within one mask. As a result, we select four [O iii] blobs as the spectroscopic targets and observe them with two masks. The targets are OIIIB063s-1, OIIIB063s-2, OIIIB083m-2, and OIIIIB083m-12. The IDs are from the original catalog by Yuma et al. (2017). O iiiB indicates that it is an [O iii] blob, a galaxy with the extended [O iii] emission line. Three numbers after O iiiB represent the redshifts; for example, 063 means that the blob is at z = 0.63. The letter “s” or “m” stands for single or multiple, respectively, indicating the number of stellar components in one blob. The last numbers show the order of blobs, starting from “1” for the blob with the largest extension of the emission line. To avoid any confusion, we hereafter refer to OIIIB063s-1, OIIIB063s-2, OIIIB083m-2, and OIIIIB083m-12 as O iiiB-1, O iiiB-2, O iiiB-3, and O iiiB-4, respectively. Figure 1 shows the 2D images of the [O iii] emission line, the stellar continuum, and the equivalent width (EW) map of our four targets. The emission-line images (NB − BB) correspond to the NB816-Rz and NB921- images for the [O iii] blobs at z = 0.63 and z = 0.83, respectively, where Rz is defined as Rz ≡ (R+2
  )/3. The contour of the [O iii] extension is also displayed in the figure. The slit direction with the exact width and length is shown in the right panel of Figure 1. Coordinates and photometric properties of these four [O iii] blobs derived by Yuma et al. (2017) are listed in Table 1.
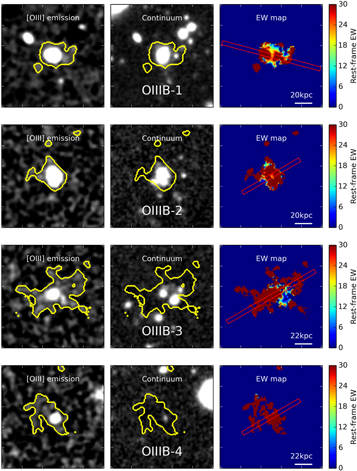
Figure 1. From left to right: emission-line (NB − BB), stellar continuum, and EW maps of four [O iii] blobs at z = 0.63 and z = 0.83, respectively. The emission-line images are NB816-Rz and NB921- for the blobs at z = 0.63 and z = 0.83, respectively. Rz is defined as Rz ≡ (R+2
  )/3. IDs are indicated in the middle panel. North is up and east is to the left. Yellow contours in the left and middle panels indicate the isophotal area of the emission-line flux measured down to 1.2 × 10⁻¹⁸ erg s−1 cm−2 arcsec−2. The color bar in the right panel corresponds to the rest-frame EW per pixel. The magenta rectangle shows the slit direction that we used to observe the spectrum of the [O iii] blobs with Subaru/FOCAS.
Download figure:
Standard image High-resolution imageTable 1. Photometric Properties of [O iii] Blobs at z = 0.63 and z = 0.83 for Spectroscopic Follow-up
| Object Name | α (J2000) | δ (J2000) | NB − BB | L([O iii])a | Isophotal Area |
|---|---|---|---|---|---|
| (mag) | (1041 erg s−1) | (kpc2) | |||
| [O iii] Blobs at z = 0.63 | |||||
| O iiiB-1 (OIIIB063s-1) | 02 17 50.244 | −05 00 04.159 | 22.04 ± 0.14 | 4.99 ± 0.7 | 1121.2 |
| O iiiB-2 (OIIIB063s-2) | 02 19 05.902 | −05 13 48.599 | 22.27 ± 0.15 | 4.04 ± 0.7 | 1121.2 |
| [O iii] Blobs at z = 0.83 | |||||
| O iiiB-3 (OIIIB083m-2) | 02 19 03.734 | −05 11 53.243 | 22.77 ± 0.13 | 4.40 ± 0.6 | 1675.0 |
| O iiiB-4 (OIIIB083m-12) | 02 18 58.701 | −05 12 58.126 | 23.32 ± 0.23 | 2.64 ± 0.6 | 981.9 |
Note.
aThe luminosity of the [O iii] emission lines is derived from the magnitude in NB − BB and is not corrected for internal dust attenuation.Download table as: ASCIITypeset image
3. Observation and Data Reduction
3.1. Subaru/Faint Object Camera and Spectrograph (FOCAS)
We conducted the optical spectroscopic follow-up observations with Subaru/FOCAS (Kashikawa et al. 2002) on 2014 October 21–22 and 2015 December 2–4 (S14B-130 and S15B-059; PI: S. Yuma). Details about the Subaru/FOCAS spectroscopic observations are described in Yuma et al. (2017). Briefly speaking, we performed the observations in the multiobject spectroscopy (MOS) mode with the VPH450 grating and the VPH850 grating with the SO58 order-cut filter. The gratings cover 3800–5250 Å with a dispersion of 0.37 Å pixel–1 and 5800–10500 Å with 1.17 Å pixel–1, respectively. We adopted the slit width of 08, providing the spectral resolutions of 1700 and 750 for VPH450 and VPH850+SO58, respectively. We used two MOS masks to observed four [O iii] blobs. Mask1 contains only O iiiB-1, which is the largest [O iii] blob at z = 0.63, while the other three blobs (O iiiB-2, O iiiB-3, and O iiiB-4) are so close to each other that we can place them all in Mask2. The on-source exposure times for Mask1 are 180 and 120 minutes in VPH450 and VPH850+SO58, respectively. For Mask2, the exposure times are 260 and 100 minutes. The sky when we observed the target in Mask1 was quite clear in that we obtain the seeing size of ∼0
6–0
7. Unfortunately, the weather was getting worse when we observed Mask2. The seeing size is roughly ∼0
9. We carefully designed the slit direction to cover the longest extent of the [O iii] emission line as shown with the magenta color in Figure 1. Note that, in Mask2, we intended to do so with O iiiB-3, which is the second-largest [O iii] blob at z = 0.83. Because all slits in one mask are required to arrange in the identical direction, the slit directions for O iiiB-2 and O iiiB-4 are consequently not oriented to the longest extension of their [O iii] emission lines.
Data reduction has been carried out with the FOCASRED package, which is the specific pipeline on the Imaging Reduction and Analysis Facility for Subaru/FOCAS data reduction. We started with bias subtraction, flat-fielding, and distortion correction. Wavelength calibration is then performed by using the ThAr lamp and OH airglow emission lines for VPH450 and VPH850+SO58 spectra, respectively. After we subtracted the sky background, we stacked the spectra and extracted them along the spatial direction to create 1D spectra. The extracting width is designed to cover the entire spatial extension of the emission line. Flux calibration is carried out by using the standard star G191-B2B observed with the same slit width. It is extracted to the 1D spectrum with the same extraction width as the target. The slit loss is automatically corrected during the flux calibration process. The 3σ flux limits are summarized in Table 2.
Table 2. Details of Optical and Near-infrared Spectroscopic Observations for Four [O iii] Blobs at z = 0.63 and z = 0.83
| Ins./Grating+Filter | Exposure Time | 3σ Flux Limit |
|---|---|---|
| (minutes) | (erg s−1 cm−2) | |
| Mask1: O iiiB-1 | ||
| FOCAS/VPH450 | 180 | ≃3.8 × 10⁻¹⁷ |
| FOCAS/VPH850+SO58 | 120 | ≃1.1 × 10⁻¹⁸ |
| MOSFIRE/Y | 285 | ≃3.1 × 10⁻¹⁸ |
| Mask2: O iiiB-2, O iiiB-3, and O iiiB-4 | ||
| VPH450 | 260 | ≃1.1 × 10⁻¹⁷ |
| VPH850+SO58a | 100 | ≃1.0 × 10⁻¹⁸ |
Note.
aFor O iiiB-2, we discard two observed frames to avoid the cosmic ray at the wavelength of the Hβ λ4861 emission line. Therefore, the 3σ flux limit of O iiiB-2 is ≃3.7 × 10⁻¹⁸ erg s−1 cm−2.Download table as: ASCIITypeset image
3.2. Keck/MOSFIRE
NIR observation was conducted only for O iiiB-1 with MOS For Infrared Exploration (MOSFIRE; McLean et al. 2012) attached on the Keck I telescope. O iiiB-1 was observed as a filler target with the Y-band filter on 2014 January 3–4 (S15B-075; PI: M. Ouchi). The main objective of the MOSFIRE proposal is to confirm the Lyα emitters at z ∼ 5.7. The spectral resolution is 3388 with the standard 07 slit width. The total exposure time is 4.45 hr with a seeing size of ∼0
7. Data reduction is performed with the MOSFIRE data reduction pipeline5
following the standard processes for reducing the spectra and flux calibration with the standard stars taken during the observations. The exposure time and the limiting flux are also listed in Table 2.
4. Results
4.1. Systemic Redshifts
Before we investigate the spectra in detail, we first check whether our [O iii] blob sample is at the targeted redshifts. We examine the emission lines detected in the VPH850+SO58 spectra. The [O iii] blobs at z ∼ 0.63 and z ∼ 0.83 are originally identified by the narrowband technique using the NB816 and NB921 images, respectively. Thus, we expect the [O iii] emission line to be around 8090–8210 Å for O iiiB-1 and O iiiB-2 and 9130–9262 Å for O iiiB-3 and O iiiB-4. In fact, Yuma et al. (2017) already confirmed that the emission line detected in the wavelength ranges mentioned above is [O iii] λ5007 based on the spectroscopic confirmation of [O ii] λ3727, Hβ λ4861, and [O iii] λ4959 emission lines at the corresponding wavelengths. They confirmed that O iiiB-1 and O iiiB-2 are at z = 0.621 and z = 0.641, respectively, whereas O iiiB-3 and O iiiB-4 are both at z = 0.838. We fit the [O ii], Hβ, and [O iii] emission lines with a single Gaussian profile and adopt the center of the Gaussian profile that is best fitted to the [O iii] λ5007 emission line as the spectroscopic redshift for each [O iii] blob (Table 3). Our resulting spectroscopic redshifts are consistent with those derived by Yuma et al. (2017).
Table 3. Spectroscopic Redshifts and Dust-corrected Fluxes of [O ii], Hβ, and [O iii] Emission Lines for Four [O iii] Blobs at z = 0.63–0.83
| Target | zspec | Observed Flux (×10−16 erg s−1 cm−2) | ||
|---|---|---|---|---|
| [O ii] | Hβ | [O iii] | ||
| O iiiB-1 | 0.6210 | 16.67 ± 0.29 | 5.02 ± 0.27 | 12.16 ± 0.25 |
| O iiiB-2 | 0.6413 | 7.33 ± 0.60 | 1.53 ± 0.31 | 3.58 ± 0.65 |
| O iiiB-3 | 0.8365 | 6.12 ± 0.51 | 0.71 ± 0.35 | 5.48 ± 0.68 |
| O iiiB-4 | 0.8379 | 0.31 ± 0.11 | 0.30 ± 0.12 | 2.02 ± 0.12 |
Download table as: ASCIITypeset image
4.2. Spectroscopic Properties of Emission Lines
The Subaru/FOCAS spectra of four [O iii] blobs at z ∼ 0.63–0.83 are illustrated in Figure 2 at the observed wavelengths of the [O ii] λ3727, Hβ λ4861, and [O iii] λλ4959, 5007 emission lines. In each plot, we show the 2D spectral image in the top panel and the 1D spectrum in the bottom one. All the lines for a given blob are plotted with the same flux scale to provide the idea of the strength of the emission lines as compared to one another. The top row of Figure 2 shows that the stellar continuum is significantly detected in O iiiB-1. The excessive extension of the emission lines beyond the stellar components is clearly seen in the 2D spectral image.
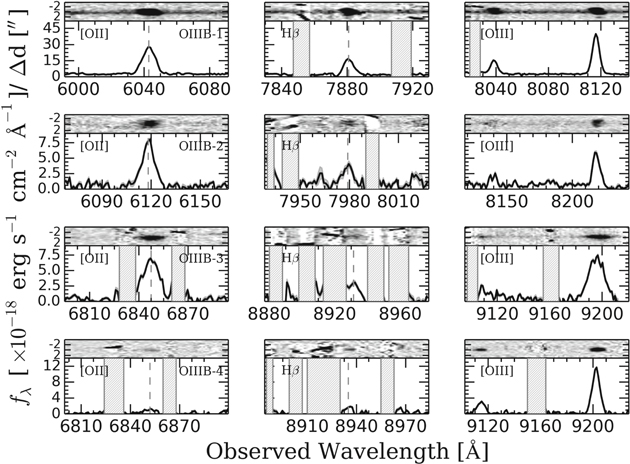
Figure 2. Subaru/FOCAS spectra of O iiiB-1, O iiiB-2, O iiiB-3, and O iiiB-4 from top to bottom, respectively. The left, middle, and right columns show the [O ii], Hβ, and [O iii] emission lines of each object, respectively. In each plot, we illustrate the 2D spectrum in the top panel, centering at the center of the stellar component of the blob, while the bottom panel shows the 1D spectrum at the corresponding observed wavelengths. The centers of [O ii] and Hβ lines are indicated with the dashed gray lines. The shaded regions in some figures indicate the area with poor S/N in the spectrum.
Download figure:
Standard image High-resolution imageAlthough we marginally detect the stellar continuum of O iiiB-2, the emission lines of O iiiB-2 seem to be extended over the stellar continuum in the spatial direction. Likewise, we are able to see the spatial extension of the [O iii] λ5007 emission line of O iiiB-3. O iiiB-3 shows the significantly larger spectral line width of the [O iii] λ5007 emission as compared with O iiiB-1 and O iiiB-2. The FWHM of the [O iii] λ5007 line of O iiiB-3 is 419.5 ± 76.8 km s−1 after correcting for the instrument, while it is on the order of 150–200 km s−1 for O iiiB-1 and O iiiB-2. For O iiiB-4, the stellar continuum is unfortunately not detected, but we can detect the [O iii] emission line with the high signal-to-noise ratio (S/N). However, the [O ii] and Hβ emission lines are marginally detected with an S/N of 2σ–3σ. The observed flux of each emission line is derived by fitting the 1D spectrum with a single Gaussian profile and corrected for the dust attenuation, which is explained in the Appendix. In short, we derive the dust attenuation of O iiiB-1 and O iiiB-2 from the Balmer decrement using the Hγ/Hβ line ratios. We find that the color excesses (E(B − V)) estimated from the Balmer decrement are in agreement with those derived by fitting the observed spectral energy distribution of the blob with the stellar population synthesis models (SED fitting method; Appendix). Therefore, for O iiiB-3 and O iiiB-4, whose Hγ emission lines are not detected, we adopt the color excesses derived by the SED fitting method. The nebular color excesses of O iiiB-3 and O iiiB-4 are then calculated by using the relation between the nebula and the stellar dust extinctions in Calzetti et al. (2000). More details on the SED fitting procedures of the [O iii] blobs are explained in Section 4.7 and Yuma et al. (2017). We summarize the dust-corrected fluxes of the [O ii] λ3727, Hβ λ4861, and [O iii] λ5007 emission lines with corresponding 1σ uncertainties in Table 3. The extended features seen in O iiiB-1, O iiiB-2, and O iiiB-3 confirm that the blob selection method by Yuma et al. (2017) is efficient in selecting galaxies with the spatially extended emission line.
4.3. Outflow Signature
The galaxies with spatially extended emission lines like [O iii] blobs are thought to be in an ongoing process of the large-scale outflow. The gas outflow is already confirmed in [O ii] blobs at z ∼ 1.2 with Subaru/FOCAS, VLT/VIMOS, and Magellan/LDSS spectra of the [O ii] blobs at z ∼ 1.2 (Yuma et al. 2013; Harikane et al. 2014); however, this is the first time to confirm whether the [O iii] blobs are in the middle of the outflow process. The blueshifted interstellar absorption lines are one of the most common methods that are used to study the outflow process of the galaxies. Unfortunately, the spectra of three out of four blobs in the VPH450 grating, in which we expect to detect the absorption lines, have too low S/N. We only detect the absorption lines in the O iiiB-1 spectrum. Figure 3 shows the blueshifted Fe ii λ2600 absorption, Fe ii λ 2626 fine-structure emission, and Mg ii λ2804 absorption lines. They are all blueshifted from the systemic redshift, indicating the gas outflow from the galaxy. We fit the blueshifted absorption and emission lines with a single Gaussian profile. The velocity offsets of the Fe ii, Fe ii
 , and Mg ii lines are −160, −200, and −270 km s−1, respectively. It is important to note that the Mg ii absorption line is possibly affected by strong resonant emission at the systemic velocity. This infilling emission can shift the centroid of the Mg ii velocity offset on the order of tens of kilometers per second (e.g., Prochaska et al. 2011). Erb et al. (2012) studied the outflow of normal star-forming galaxies at z = 1–2 by using various interstellar absorption lines including those detected in this work. They found that the velocity offsets of the Fe ii λ2600 and Mg ii λ2804 absorption lines of star-forming galaxies at z = 1–2 with stellar masses and SFRs comparable to those of O iiiB-1 range between −190 and −130 km s−1. The Fe ii
 and Mg ii lines of O iiiB-1 show velocity offsets slightly higher than those of the normal star-forming galaxies.
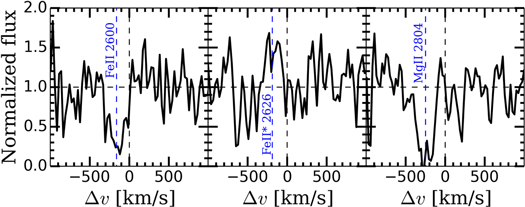
Figure 3. Blueshifted Fe ii λ2600 absorption (left), Fe ii λ2626 fine-structure emission (middle), and Mg ii λ2804 absorption lines (right) of O iiiB-1. The observed flux is normalized to the continuum spectrum. The blue vertical dashed lines indicate the centroids of velocity offsets of each line.
Download figure:
Standard image High-resolution image4.4. AGN Diagnostics
An AGN is one of the plausible energy sources providing hard ionizing photons that can cause the emission lines at large scale. Yuma et al. (2017) carried out a primary check for the AGN contribution in the [O iii] blobs by cross-matching the X-ray and radio catalogs obtained by Ueda et al. (2008) and Simpson et al. (2012), respectively. They found no X-ray or radio counterpart for any [O iii] blobs in our sample down to the X-ray luminosity of 1042 erg s−1 as mentioned in Section 2. This luminosity limit is ∼0.5 dex brighter than the faintest bin of the X-ray luminosity functions of AGNs at similar redshifts (e.g., Fotopoulou et al. 2016; Ranalli et al. 2016). Thus, we know that the [O iii] blobs are not unobscured AGNs, but the possibility that the [O iii] blobs are faint or heavily obscured AGNs cannot yet be ruled out.
To further investigate AGN signature in the targets, we first plot the Baldwin, Phillips, and Terlevich (BPT) diagram in the left panel of Figure 4. The BPT diagram is a plot of the [O iii]/Hβ ratio versus the [N ii]/Hα ratio (Baldwin et al. 1981). Kewley et al. (2006) used this diagram to efficiently classify their sample into the star-forming galaxies, composites, and AGNs. Compared with star-forming galaxies, AGNs have a higher ionization state, resulting in higher values of both [O iii]/Hβ and [N ii]/Hα ratios. We plot local galaxies (z = 0.04–0.10) obtained from the Sloan Digital Sky Survey (SDSS) Data Release 7 (DR7; Abazajian et al. 2009) in the left panel of the figure and separate them into pure star-forming galaxies (red), composites (blue), and AGNs (green) based on their locations on the BPT diagram. O iiiB-1 is the only object that has the NIR spectrum available. It is clearly seen from the figure that O iiiB-1 lies exactly on the distribution of the local star-forming galaxies, indicating that it is a normal star-forming galaxy.
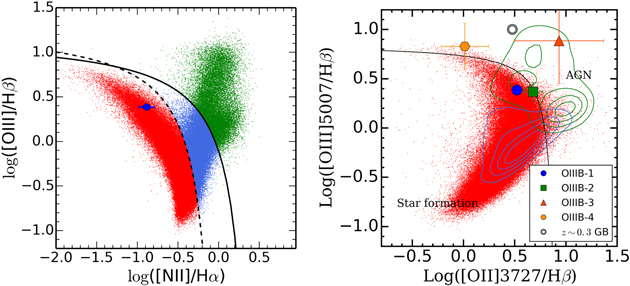
Figure 4. Left panel: BPT diagram showing the [O iii]/Hβ ratio against the [N ii]/Hα ratio. The blue circle indicates O iiiB-1, while local galaxies taken from SDSS DR7 data are shown in three different colors. The red, blue, and green dots are for star-forming galaxies, composites, and AGNs, respectively. The black dashed and solid curves are the criteria for separating pure star-forming galaxies, composites, and AGNs by Kauffmann et al. (2003) and Kewley et al. (2001), respectively. Right panel: [O iii]/Hβ vs. [O ii]/Hβ or the blue diagram of four [O iii] blobs at z = 0.63 and z = 0.83. The line ratios are already corrected for dust attenuation. The blue circle is O iiiB-1 and the green square is O iiiB-2 at z ∼ 0.63. O iiiB-3 and O iiiB-4 at z ∼ 0.83 are indicated with the red triangle and the orange hexagon, respectively. Red dots represent the local star-forming galaxies classified by the BPT diagram in the left panel. Blue and green contours show the distribution of composites and AGNs, respectively. The open gray circle shows a Seyfert type 2 AGN (J2240–0927) at z ∼ 0.3 with a spatially extended [O iii] emission line, which is called a Green Bean (GB; Schirmer et al. 2013). The black solid line divides the blue diagram into two regions of star formation and AGN (Lamareille 2010).
Download figure:
Standard image High-resolution imageFor the remaining three [O iii] blobs, we use the blue diagram, which is a plot between the dust-corrected [O iii]/Hβ and [O ii]/Hβ emission line ratios (right panel of Figure 4). AGNs can be distinguished from the star-forming galaxies with the solid curve shown in the right panel of Figure 4 (e.g., Lamareille 2010; Harikane et al. 2014). On the blue diagram, we display the local SDSS galaxies that we already categorized into star-forming galaxies, composites, and AGNs based on the BPT diagram as a reference. The local star-forming galaxies and composites are largely overlapped with each other in the region below the curve that is used to separate the star formation activity from AGNs. On the other hand, AGNs can be distinguished from the star formation galaxies and composites efficiently. Lamareille (2010) stated that the contamination of AGNs in the region of star-forming galaxies on the blue diagram is roughly 16%. We also plot a Seyfert type 2 AGN (J2240–0927) at z = 0.326 that shows the extended [O iii] emission line (Schirmer et al. 2013). We discuss the similarity and difference between our [O iii] blobs and this AGN in Section 4.7.
From the blue diagram in the right panel of Figure 4, O iiiB-1 is still confirmed to be in the pure star formation region consistent with its location on the BPT diagram. O iiiB-2, on the other hand, shows the higher [O ii]/Hβ ratio and get closer to the separation curve. Thus, we cannot rule out the possibility that O iiiB-2 might be fueled by an AGN activity. The other two [O iii] blobs at z ∼ 0.83 show the remarkably high [O iii]/Hβ ratios. O iiiB-3 is clearly located in the AGN region. This is in good agreement with its emission-line width mentioned in Section 4.2. The [O iii] λ5007 line width of 419.5 km s−1 suggests that O iiiB-3 is plausibly the type 2 Seyfert, whose typical line widths are roughly ∼500 km s−1.
O iiiB-4 shows the remarkably high [O iii]/Hβ ratio but low [O ii]/Hβ ratio (right panel of Figure 4). The high ratio of [O iii] to Hβ emission lines places O iiiB-4 above the separated curve in the blue diagram. As seen in the blue diagram, some fraction of the local star-forming galaxies distribute in the same region as O iiiB-4, while AGNs do not. It is likely that O iiiB-4 is one of the star-forming galaxies with the strongest [O iii]/Hβ ratio. In conclusion, with the emission-line diagnostics, we can confirm that O iiiB-1 and O iiiB-4 are star-forming galaxies, whereas O iiiB-3 is an obscured AGN. However, there is no clear conclusion for O iiiB-2; it can be a star-forming galaxy, composite galaxy, or AGN.
4.5. Properties of ISM
Nakajima et al. (2013) and Nakajima & Ouchi (2014) show that the diagram between the [O iii]/[O ii] line ratio and the R23 index is efficient to investigate an ionization parameter and metallicity of a star-forming galaxy simultaneously. The emission-line ratio of an atom at different ionization states, such as the [O iii]/[O ii] ratio, strongly depends on the ionization parameter of gas, qion, which is the ratio of the ionizing photon flux per unit area to the number density of hydrogen atoms. The ionization parameter qion corresponds to the dimensionless ionization parameter U as  , where c is the speed of light (Kewley & Dopita 2002). The R23 index is defined as

The R23 index is one of the good indicators for estimating metallicities of the galaxies (e.g., Pagel et al. 1979; Kewley & Dopita 2002), although it slightly depends on the ionization parameter.
We plot the [O iii]/[O ii] ratios of the [O iii] blobs against their R23 indices in Figure 5 to investigate the properties of their ISM. The local SDSS star-forming galaxies (gray dots), local SDSS AGNs (dark gray dots), and star-forming galaxies at 0.47 < z < 0.92 (open triangles; Lilly et al. 2003) are also plotted as a reference. Another population that we plot in the figure as a reference is Green Peas (hereafter GPs). GPs are the compact star-forming galaxies at z = 0.112–0.360 with the strong [O iii] emission line with a rest-frame EW up to 1000 Å (Cardamone et al. 2009). The [O iii] emission line of GPs falling into the r band makes this type of galaxy look green in the g, r, i composite image. In addition to the observed galaxies at various redshifts, we plot photoionization models at constant ionization parameters of qion = 2 × 107 cm s−1, 8 × 107 cm s−1, and 3 × 108 cm s−1 with varying metallicities. The models with the constant metallicities are linked with dashed lines, and the values of the metallicities in terms of  are indicated by the open circles. The local SDSS star-forming galaxies show a variety of R23 indices ranging from 1.0 to 10.0, while their [O iii]/[O ii] ratios are mostly below 1.0. Likewise, star-forming galaxies at z ∼ 0.7 are distributed in the same area on the plot. It is indicated that most of the star-forming galaxies at z = 0 and z ∼ 0.7 have ionization parameters between qion = 2 × 107 cm s−1 and qion = 8 × 107 cm s−1 but have wide ranges of metallicities. On the other hand, the star-forming GPs with the strong [O iii] emission line show high [O iii]/[O ii] ratios and R23 indices. According to the figure, the GPs at z = 0.1–0.4 show ionization parameters higher than 8 × 107 cm s−1, which is clearly higher than the normal star-forming galaxies at z = 0 and z = 0.7. Due to the strong [O ii] and [O iii] emission, the SDSS AGNs at z ∼ 0 show high R23 indices that are relatively greater than those of the star-forming galaxies at z = 0 and z ∼ 0.7. Meanwhile, the [O iii]/[O ii] line ratios of the local AGNs are distributed in the same range as those of the star-forming galaxies.
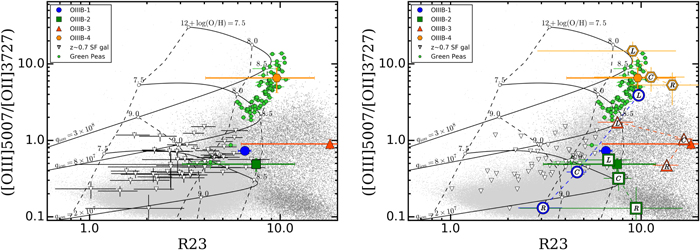
Figure 5. Relation between [O iii]/[O ii] ratio and R23 index. Left panel: colored symbols represent O iiiBs at z ∼ 0.7 as in previous figures. Light-gray and dark-gray dots are the SDSS star-forming galaxies and AGNs, respectively. Open triangles represent star-forming galaxies at z = 0.5–0.9 by Lilly et al. (2003). Green circles are for the local GPs with the strong [O iii] emission line by Cardamone et al. (2009). Each solid black line shows a track of photoionization models at constant ionization parameters of qion = 2 × 107 cm s−1, 8 × 107 cm s−1, and 3 × 108 cm s−1 with 12+log(O/H) in the range of 7.5–9.0 (Kewley & Dopita 2002). The dashed lines connect the photoionization model tracks at a constant 12+log(O/H). Right panel: [O iii]/[O ii] ratio vs. R23 index of the radial profiles of the [O iii] blobs. Open symbols with the letters “L,” “C,” and “R” refer to the left, central, and right parts of the blobs in Figure 6, respectively (more details in main text). Other symbols and lines are identical to those in the left panel.
Download figure:
Standard image High-resolution imageO iiiB-1 and O iiiB-2 are located in the same region as the local and z = 0.7 star-forming galaxies, suggesting similar ionization parameters and metallicities. O iiiB-1 and O iiiB-2 should have an ionization parameter slightly less than qion = 8 × 107 cm s−1. Note that the inferred ionization parameter and metallicities of O iiiB-2 only apply if it is a star-forming galaxy. O iiiB-3 shows huge error bars in the R23 index owing to the low S/N of the Hβ emission line. As O iiiB-3 is classified as an AGN in Section 4.4, it is obvious that its location is consistent with the AGNs found in the local universe. In contrast, O iiiB-4 is located in a totally different region in Figure 5. O iiiB-4 shows an impressively high [O iii]/[O ii] ratio, indicating that the ionization parameter qion should be roughly 3 × 108 cm s−1. This high [O iii]/[O ii] ratio of O iiiB-4 agrees well with those of the GPs at z = 0.1–0.4.
4.6. Radial Profile of the [O iii] Blobs
We further investigate the nature of the [O iii] blobs by plotting their [O iii]/[O ii] line ratios as a function of the distance from the center of the blobs. By observing the [O iii] blobs with the slits finely aligned along the most extended direction of the [O iii] emission line (see Figure 1),6 we are able to examine the spectroscopic properties of the outer region of the [O iii] blobs. The radial profile of the emission line is constructed from the background-subtracted 2D spectrum by integrating the emission line at each spatial position along the wavelength direction covering the full wavelength range of the best-fitted Gaussian profile. This wavelength range covers all spatial components of the emission line. The stellar continuum profiles at the wavelengths blueward and redward of each emission line for a given blob are estimated by creating the continuum profiles using an identical wavelength range as used to create the emission-line profile. Then, we interpolate both continuum profiles to obtain the average continuum profile at the wavelength of the emission line. In this way, we can ensure that the emission-line profile is not over- or underestimated. The spatial profile of the [O iii]/[O ii] ratio is obtained after carefully removing the estimated stellar continuum and shown in Figure 6. The negative values of the distance from the center refer to the component at the top of the 2D spectral image in Figure 2. For comparison purposes, we show the shaded regions where the GPs at z = 0.1–0.4 and star-forming galaxies at z ∼ 0.7 are typically located.
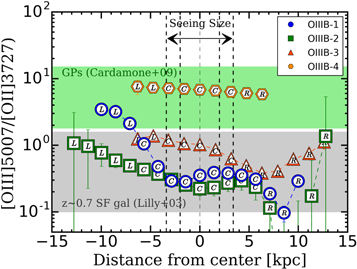
Figure 6. Radial profiles of [O iii]/[O ii] ratios of four O iiiBs at z ∼ 0.7 as a function of the distance from the center of the blobs. The left-to-right radial profile is drawn from the top to the bottom part of the 2D spectrum in Figure 2. The symbols of the four [O iii] blobs are identical to the previous figures. The letters “L,” “C,” and “R” indicate the regions that we use to determine the left, central, and right components of a given blob, respectively. The gray area represents the typical line ratios of star-forming galaxies at 0.47 < z < 0.92 (Lilly et al. 2003). The green region indicates the line ratios of the GPs at z = 0.112–0.360 by Cardamone et al. (2009). The average seeing size of the data is also shown in the figure.
Download figure:
Standard image High-resolution imageIt is seen from Figure 6 that all four of our samples extend beyond the seeing size of the spectral images. The centers of O iiiB-1, O iiiB-2, and O iiiB-3 lie in the region where the typical star-forming galaxies at z ∼ 0.7 are located. Interestingly, the left part of the O iiiB-1 profile at a distance larger than 5 kpc shows the high [O iii]/[O ii] ratio consistent with the GPs at z − 0.1−0.4. Similarly, the [O iii]/[O ii] ratio of O iiiB-2 increases as a function of the distance from the center on both sides, albeit with a large uncertainty. O iiiB-3 shows an [O iii]/[O ii] ratio of roughly 1–2, which is slightly higher than the central parts of O iiiB-1 and O iiiB-2, but it is still in the range of the typical star-forming galaxies. Finally, the [O iii]/[O ii] radial profile of O iiiB-4 seems to be almost constant at roughly [O iii]/[O ii] = 5–10 over ∼14 kpc. It is noteworthy that the spatial extension of O iiiB-4 is smaller than the other three blobs because the slit direction is unfortunately not designed to observe the longest axis of O iiiB-4. The [O iii]/[O ii] ratios are significantly greater than those of the typical star-forming galaxies and consistent with those of the compact GPs at z = 0.1–0.4. This is in agreement with what we have found in Section 4.5 (left panel of Figure 5), that O iiiB-4 has both [O iii]/[O ii] ratio and R23 index comparable to those of the GPs. In contrast to O iiiB-4, the GPs show compact morphology in g, r, i images, suggesting that they have a compact stellar component (Cardamone et al. 2009). Although there is no detailed study about the extension of the [O iii] emission line of the GPs yet, the compact size of the GPs seen in the r-band image, in which the [O iii] emission line falls, may imply the compact size of the [O iii] emission line as well. The unresolved morphology of the GPs in the r-band image suggested that the sizes of the [O iii] emission line should be less than 5 kpc (Cardamone et al. 2009). Further study of the spatial extension of the [O iii] emission line for the GPs is necessary to confirm the above statement. The fact that O iiiB-4 shows an extended profile of the [O iii] emission line over ∼14 kpc makes O iiiB-4 different in size from the GPs at z = 0.1–0.4. Thus, we call O iiiB-4 a giant GP, as it shows a high [O iii]/[O ii] ratio like the GPs and its spatially extended feature of the [O iii] emission line.
We replot the diagram of the [O iii]/[O ii] ratio against the R23 index in the right panel of Figure 5 by separating the radial profiles of each [O iii] blob into three components: the central part and two outer regions on both sides of the profile beyond the stellar continuum. We use letters “L,” “C,” and “R” to represent the left, central, and right components of each blob, respectively. The left component corresponds to the left part of the radial profile shown in Figure 6. The central component is roughly twice the FWHM of the continuum radial profile to ensure that the extended parts are not contaminated by the stellar contribution. As seen in the figure, the left and central components of O iiiB-2 are close to the plot of the entire object and are located in the region where the star-forming galaxies at z ∼ 0 and z ∼ 0.7 are distributed. The line ratio of the right subregion of O iiiB-2, however, shows higher R23 index and agrees well with the line ratios of the local SDSS AGNs. Originally, O iiiB-3 shows the high R23 index with a large uncertainty. When we divide O iiiB-3 into three components, the extended parts of O iiiB-3 show slightly lower R23 indices but are still consistent within the large uncertainties. The left part of O iiiB-3 falls closer to the GP region, with the [O iii]/[O ii] ratio higher than that of the central part, which is in agreement with Figure 6. Meanwhile, the central and right subregions are located close to the integrated line ratio.
For O iiiB-1, the left component moves apart from the rest and falls into the GP region of the high [O iii]/[O ii] ratios and R23 indices. It can be argued that the extended component of O iiiB-1 has not only a comparable [O iii]/[O ii] line ratio to the GPs, as seen in Figure 6, but also a similar R23 index. Likewise, the locations of all three components of O iiiB-4 on the [O iii]/[O ii]–R23 diagram are consistent with those of the GPs. In conclusion, one extended part of O iiiB-1 and the entire O iiiB-4 show [O iii]/[O ii] ratios and R23 indices consistent with those of the compact GPs at z = 0.1–0.4.
4.7. Discovery of a Giant Green Pea at z = 0.838
We discover a giant GP, O iiiB-4, which has spatially extended [O iii] emission and line ratios consistent with those of the GPs found at z = 0.1–0.4 by Cardamone et al. (2009). Figure 7 shows the close-up RGB image of O iiiB-4. The extended green color on the order of 10–20 kpc around the center of O iiiB-4 clearly indicates the large-scale extension of the [O iii] emission line. It is noteworthy that the green components in the northeast (top left) direction of O iiiB-4 are also parts of O iiiB-4 when we measure the [O iii] surface brightness down to 1.2 × 10⁻¹⁸ erg s−1 cm−2 arcsec−2 (see Figure 1).
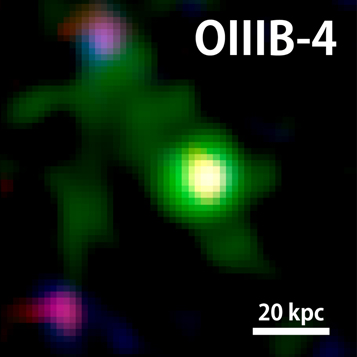
Figure 7. Composite images of O iiiB-4. North is up, east is left. The red and blue colors of both images are the images observed in the R and z bands, respectively, whereas the green color represents the [O iii] emission line observed in the NB921 image. The size of each image is roughly 12 × 12 arcsec2, which corresponds to the physical dimension of 90 × 90 kpc2 at z = 0.8379. The white bar in the lower right corner indicates the physical scale of 20 kpc.
Download figure:
Standard image High-resolution imageThe left panel of Figure 8 shows the relation between the rest-frame [O iii] EWs of the [O iii] blobs and the SFRs derived by using the SED fitting method. In Yuma et al. (2017), the observed SEDs of the [O iii] blobs are collected from the photometry in nine bands: BVRizJHK, IRAC ch1 (3.6 μm), and IRAC ch2 (4.5 μm).7
The magnitudes in the i or z band are excluded because they might be contaminated by the strong [O iii] emission line at z = 0.63 or z = 0.83, respectively. The stellar population models are constructed with the Bruzual & Charlot (2003) code by assuming a constant star formation history, a Salpeter (1955) initial mass function with mass cutoffs of 0.1 and 100  , Calzetti et al. (2000) dust attenuation, and solar metallicity. The effect of varying the parameters used to construct the models (e.g., the IMF, star formation histories, and metallicity) is included in the uncertainties of the derived stellar properties. The rest-frame [O iii] EWs of all [O iii] blobs are in the range of 200–1000 Å. The giant GP (O iiiB-4) shows the largest EW of 845 ± 27 Å. We also plot the GPs at z = 0.1–0.4 in the figure for comparison purposes. As mentioned earlier, the GPs are selected as the galaxies with excessive fluxes in the r-band image. Hence, they should show very high rest-frame [O iii] EWs by definition. The SFRs of the GPs at z = 0.1–0.4 were derived from the dust-corrected Hα fluxes (Cardamone et al. 2009). From the left panel of Figure 8, the rest-frame [O iii] EWs of the GPs are typically in the range of 100–2000 Å. All [O iii] blobs studied in this paper show EWs in well agreement with the GPs at z = 0.1–0.4. However, O iiiB-1 and O iiiB-2 have significantly higher SFRs than the GPs, indicating more intense activity of star formation. Meanwhile, the giant GP (O iiiB-4) shows the lower SFR of roughly 15
  yr−1, which is consistent with the compact GPs at z = 0.1–0.4.
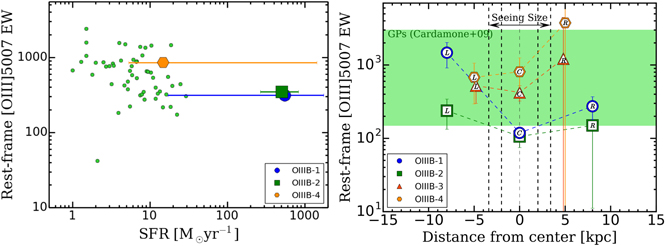
Figure 8. Left panel: relation between the rest-frame [O iii] EWs ([O iii] EWs) and the SFRs of four [O iii] blobs at z ∼ 0.63 and z ∼ 0.83. The symbols of the [O iii] blobs are identical to those in the previous figures. The small green circles show the GPs discovered at z = 0.1–0.4 by Cardamone et al. (2009). Right panel: rest-frame [O iii] EWs of the [O iii] blobs as a function of the distance from the center. The radial profile of each [O iii] blob is divided into three components: left (L), center (C), and right (R), corresponding to the left, center, and right parts of the profile shown in Figure 6.
Download figure:
Standard image High-resolution imageWe plot the radial profile of the rest-frame [O iii] EW in the right panel of Figure 8 by dividing the profile into three components based on their distances from the center: left (L), center (C), and right (R). O iiiB-4 shows high [O iii] EWs in all components. The left and central parts of O iiiB-4 have [O iii] EW in the range of 800–1000 Å, consistent with the EW of the entire blob. They are in the same range as the typical GPs at z = 0.1–0.4. The right component even shows the higher EW, albeit with the large error bar due to the low S/N of the faint continuum. This clearly confirms that O iiiB-4 has [O iii] EW high enough to be called a giant GP. Among the remaining three [O iii] blobs, O iiiB-3 shows a high [O iii] EW comparable to the GPs throughout the entire object. On the other hand, O iiiB-1 and O iiiB-2 show [O iii] EWs at the center slightly smaller than those of the typical GPs at z = 0.1–0.4. Their [O iii] EWs are on the order of 100 Å, while the [O iii] EWs of the extended components increase to approximately 150–250 Å in the case of O iiiB-2. The left component of O iiiB-1 shows a significantly large EW of more than 1000 Å. It is consistent with what we have found in the right panel of Figure 5, that the left part of O iiiB-1 has an [O iii]/[O ii] line ratio and R23 index comparable to those of the GPs.
Besides the GPs at z = 0.1–0.4, there is another population that is similar to our giant GP. Schirmer et al. (2013) discovered Seyfert-2 galaxies at z ∼ 0.3 in SDSS DR8 with luminous narrow-line regions and named these galaxies GBs. GBs show the high [O iii] luminosities on the order of 1043 erg s−1 and large [O iii]/[O ii] ratios of more than 1.0. Compared with GPs at similar redshifts, GBs are much larger, with a size of the [O iii] emission line of 15–20 kpc, and show higher [O iii]/[O ii] ratios. Their [O iii] EWs are on the order of 1000 Å. GBs at z ∼ 0.3 are similar to O iiiB-4 in terms of the large [O iii] EW and the spatial extension of the [O iii] emission line. However, the [O iii]/[O ii] ratios of GBs are slightly higher than those of O iiiB-4. The main difference between O iiiB-4 and GBs is the energy source; GBs are Seyfert type 2 AGNs, but O iiiB-4 is a star-forming galaxy. We plot the most prominent GB, J2240–0927, in the right panel of Figure 4. Its location on the blue diagram is consistent with the distribution of local SDSS AGNs, whereas O iiiB-4 is located close to the local star-forming galaxies on the same figure. Additionally, the high-ionization lines such as [Ne v] emission are not detected in O iiiB-4. The 3σ flux limit for nondetection is roughly 1.0 × 10⁻¹⁸ erg s−1 cm−2, which provides a 3σ upper limit on the [Ne v]/Hβ ratio of O iiiB-4 of <0.03. In contrast, the [Ne v] emission line is detected in many GBs, including J2240–0927, with an [Ne v]/Hβ ratio of 0.22 (Schirmer et al. 2016).
Figure 9 shows the correlation between the [O iii]/[O ii] line ratios and four different physical properties: stellar mass (M*), SFR, sSFR (=SFR/M*), and μ0.32.8 The stellar mass and SFR of the [O iii] blobs are derived by the SED fitting method (Yuma et al. 2017). μ0.32 is defined as a combination of M* and the SFR proposed by Mannucci et al. (2010):

where α = 0.32 provides the minimum scatter of the SDSS galaxies in the local universe in the μα–metallicity plane. The metallicity in terms of  can be empirically estimated from μ0.32 as

where x = μ0.32 − 10 (Mannucci et al. 2010). It is noteworthy that Equation (3) is obtained by fitting the local SDSS galaxies with stellar masses of 
 or μ0.32 in the range of μ0.32 = 9.0–11.5. In this fitting range, the metallicity 12+log(O/H) decreases with μ0.32. We would reach the minimum metallicity of 12+log(O/H) = 8.4 at μ0.32 = 8.73. This relation might not be highly accurate for galaxies with μ0.32 smaller than 8.73. However, it seems that the metallicity continues to decrease at μ0.32 below 8.73 but becomes constant at μ0.32 greater than 10.5. Mannucci et al. (2010) also proposed that the metallicity of star-forming galaxies with any stellar mass, any SFR, and at any redshift up to z = 2.5 practically follows the linear correlation between
  and μ0.32:

where x = μ0.32–10. Therefore, μ0.32 can basically represent the metallicity of the galaxies with a stellar mass in the range of 
 .
.
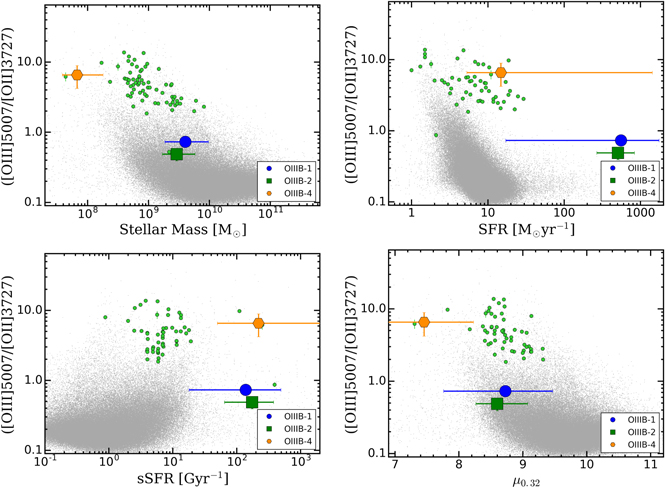
Figure 9. Diagrams of the [O iii]/[O ii] ratios vs. the stellar mass (M*; top left), SFR (top right), sSFR (bottom left), and μ0.32 (defined by Mannucci et al. 2010; bottom right). Symbols are identical to those in the previous figures.
Download figure:
Standard image High-resolution imageAs mentioned earlier, the giant GP, O iiiB-4, shows the highest [O iii]/[O ii] ratio among all four [O iii] blobs discussed in this paper. It is located in different locations from the rest of the [O iii] blobs in all plots in Figure 9. The stellar mass of O iiiB-4 is 
 . Compared with the other [O iii] blobs in our sample, O iiiB-4 is the [O iii] blob with the smallest M* and the lowest μ0.32. The sSFR of O iiiB-4 is ∼2 × 10² Gyr−1, which is comparable to the other [O iii] blobs. In fact, most of the [O iii] blobs found at z = 0.63 and z = 0.83 show a high sSFR that is greater than the sSFR of typical star-forming galaxies on the so-called main sequence of the stellar mass–SFR diagram (Elbaz et al. 2007; Yuma et al. 2017). O iiiB-4 is the [O iii] blob at z ∼ 0.83 with the smallest stellar mass. Even if we compare O iiiB-4 with the normal [O iii] emitters at the same redshift, we would still find that O iiiB-4 is among the emitters with the smallest stellar mass and highest sSFR (see Figures 12 and 13 in Yuma et al. 2017). The high [O iii]/[O ii] line ratio of O iiiB-4 is comparable to the z = 0.1–0.4 GPs; however, their stellar properties are not exactly consistent. O iiiB-4 has a stellar mass smaller than a majority of the GPs and SDSS galaxies. The sSFR of O iiiB-4 is consistent with two GPs at z = 0.1–0.4, while it is higher than those of the remaining GPs. The low μ0.32 of O iiiB-4, as seen in the bottom right panel of Figure 9, may imply its low metallicity. Amorín et al. (2010) showed that the GPs at z = 0.1–0.4 have metallicities in the range of
  . The comparable line ratios between O iiiB-4 and the GPs may imply that the metallicity of O iiiB-4 is likely similar to that of the GPs. The implied subsolar metallicity of O iiiB-4 might affect the stellar properties derived by the SED fitting method in that the models with subsolar metallicity give slightly lower SFRs (0.12 dex) than those with solar metallicity (Yabe et al. 2009). However, the effect of varying metallicity of models is already included in the uncertainties of the derived properties.
With the small stellar mass and low metallicity, O iiiB-4 is somehow similar to the galaxies with extreme emission lines at low redshifts (e.g., Amorín et al. 2014; Izotov et al. 2017; Yang et al. 2017). Amorín et al. (2014) found the galaxies at 0.2 ≤ z ≤ 0.9 with high rest-frame [O iii] EWs of 100–1700 Å. They also suggested high-ionization parameters of q ≥ 108 cm s−1, sSFR of 1–100 Gyr−1, and metallicity of  , which are similar to O iiiB-4. Amorín et al. (2014) also determined the μ0.32 of their sample to be in the range of μ0.32 = 7.0–8.5. This is also consistent with the μ0.32 of O iiiB-4. Izotov et al. (2017) and Yang et al. (2017) conducted separate surveys and found the galaxies with extreme [O iii]/[O ii] emission-line ratios at z < 0.07 and z < 0.05, respectively. Yang et al. (2017) proposed the photometric method to select these galaxies and called them the blueberry galaxies, which are basically GPs with low masses. The blueberry galaxies show low stellar masses and high [O iii]/[O ii] ratios comparable to those of O iiiB-4. However, the only obvious difference between O iiiB-4 and these extreme emission-line galaxies is the physical size of the emission line. These galaxies show a size so compact that some of them are unresolved in the SDSS images (Yang et al. 2017).
The average properties of O iiiB-1 are indistinguishable from those of O iiiB-2; it is located close to O iiiB-2 in all plots in Figure 9. Although the [O ii]/[O ii] line ratios of O iiiB-1 and O iiiB-2 are not as high as those of O iiiB-4 and GPs, they are still somewhat higher than the majority of the local star-forming galaxies. According to the figure, O iiiB-1 and O iiiB-2 show moderate masses of roughly (3–5) × 109  , significantly high SFR on the order of a few hundred
  yr−1, and subsequently high sSFR as compared with the local star-forming galaxies. Their μ0.32 values are less than most star-forming galaxies in the local universe, implying metallicities lower than those of the local star-forming galaxies.
5. Discussion
We know from Section 4.4 that AGN activity is possibly responsible for the spatial extension of the [O iii] emission line in only one blob, O iiiB-3, but we cannot make a constraint on the AGN contribution of O iiiB-2. O iiiB-2 can be a star-forming galaxy, composite, or AGN. Thus, we do not further discuss the origins of O iiiB-2 and O iiiB-3 because of the possible AGN contribution. The giant GP (O iiiB-4) with the remarkably high [O iii]/[O ii] line ratios and O iiiB-1 are likely to be heated by the star formation activity with the high sSFR. Jaskot & Oey (2013) studied six most extreme GPs at z = 0.1–0.4 with the highest [O iii]/[O ii] ratios. They examined possible origins of the He ii λ4686 emission detected in most of their sample, including Wolf-Rayet stars, AGNs, and fast radiative shocks. Because of the size difference of the [O iii] emission lines between the GPs at z = 0.1–0.4 and [O iii] blobs at z ∼ 0.7, the physical structures in the extended regions of the [O iii] blobs may be different from the GPs. In this section, we discuss plausible scenarios and physical conditions that maybe able to explain the extended [O iii] emission in O iiiB-1 and O iiiB-4, including an AGN light echo (e.g., Schawinski et al. 2015; Ichikawa et al. 2019), fast radiative shocks (e.g., Kewley et al. 2001; Allen et al. 2008; Shirazi & Brinchmann 2012), and the density-bounded system (e.g., Nakajima et al. 2013; Nakajima & Ouchi 2014).
5.1. AGN Light Echo
An AGN plays an important role in regulating the galaxy evolution. The accretion to the supermassive black hole at the center of the AGN produces a significant amount of radiative energy that is able to photoionize the ISM of the host galaxy and cause large-scale gas outflows from the host galaxy (e.g., Silk & Rees 1998). In this mode of the AGN activity, AGN photoionization overcomes the photoionization from the H ii region of the host galaxy, so the host galaxy can be identified as an AGN (e.g., Baldwin et al. 1981; Veilleux & Osterbrock 1987; Lamareille 2010). It has been long known that an AGN can show luminosity variability (Ulrich et al. 1997). It is possible that the AGN photoionization occurs after the accretion stops because the light echo from the past AGN activity takes time to travel across the ISM of the host galaxy (e.g., Schawinski et al. 2015). In this period of the AGN light echo, an AGN signature such as the X-ray emission at the center of the galaxy is not visible, but we can still observe the extended emission of the galaxy. Although O iiiB-4 and O iiiB-1 do not show any signature of the current AGN activity, it is still possible that their extended emission lines are the effect of the past AGN activity. If this is the case, O iiiB-4 and O iiiB-1 should show AGN-like line ratios in the extended components.
We plot the blue diagram again in Figure 10, but this time we separate the line ratios into three components based on the distance from the center of the [O iii] blob (see also Section 4.6). For comparison purposes, we also plot the line ratios of the GPs at z = 0.1–0.4. All components of O iiiB-4 show [O iii]/Hβ ratios consistent with the GPs and some fraction of the local star-forming galaxies that show high [O iii]/Hβ ratios. For O iiiB-1, the left component with the high [O iii]/[O ii] ratio seen in the right panel of Figure 5 and in Figure 6 is located in the GP region. Therefore, it is unlikely that the extended [O iii] emission lines of O iiiB-4 and O iiiB-1 are caused by the AGN photoionization left as the AGN light echo after the supermassive black hole at the center stops accreting. It is also seen from the figure that all components of O iiiB-2 lie in the intersect region of star-forming galaxies, composites, and AGNs. The line ratios of the central and right components of O iiiB-3 are consistent with those of AGNs, while the left component shows a lower [O ii]/Hβ ratio, closer to the star-forming galaxies and the GPs.
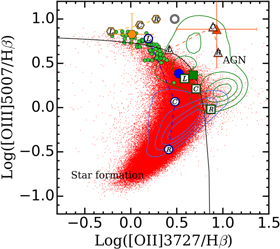
Figure 10. Blue diagram identical to the right panel of Figure 4, overplotted with three spatial components of the [O iii] blobs. The letters “L,” “C,” and “R” correspond to the left, center, and right components of each blob, respectively. The circle, square, hexagon, and triangle represent O iiiB-1, O iiiB-2, O iiiB-3, and O iiiB-4, respectively. Small green circles are the GPs at z = 0.112–0.360 by Cardamone et al. (2009). Red dots are the local SDSS star-forming galaxies. Blue and green contours represent composites and AGNs, respectively.
Download figure:
Standard image High-resolution image5.2. Fast Radiative Shock
Without the AGN contribution, the extended [O iii] emission line and the gas outflow observed in O iiiB-4 and O iiiB-1 are most likely fueled by the intense star formation activity (see also Section 4.7). However, some physical conditions are still required to explain such high [O iii]/[O ii] ratios in the extended parts of the [O iii] blobs. Supersonic motion of supernovae or gas outflows from a galaxy are able to create the radiative shock with energy high enough to strongly affect the H ii region and the ISM of the galaxy. A fast radiative shock, where extreme-ultraviolet and soft X-ray photons are created by strong ionizing radiation behind the shock front, is one of the plausible explanations for the existence of the highly ionized emission lines (e.g., Dopita & Sutherland 1996; Allen et al. 2008).
Allen et al. (2008) developed the library of radiative shock models called “MAPPINGS III,” for the ISM with various ranges of metallicities (solar, Small Magellanic Cloud, and Large Magellanic Cloud metallicities), preshock densities of 0.01–1000 cm−3, and shock velocities of 100–1000 km s−1. When the velocity of the shock increases, the velocity of the photoionization front increases and exceeds the shock velocities at a certain velocity limit (vshock ≈ 170 km s−1). At this point, the photoionization front is separated from the shock front and forms a “precursor” of the H ii region, which dominates the optical emission of shocks at high shock velocities (Allen et al. 2008). In the models of shock+precursor, the [O iii]/Hβ ratios become consistent with those of the extended components of the [O iii] blobs, i.e., ![$\mathrm{log}({\rm{O}}\,{\rm{III}}]/{\rm{H}}\beta )\geqslant 0.5$](https://content.cld.iop.org/journals/0004-637X/882/1/17/revision1/apjab2f87ieqn27.gif) (see Figure 10), when the shock velocity reaches vshock ≥ 350 km s−1 regardless of the values of the magnetic field and the metallicity. The prominent emission lines that are indicative of the fast radiative shocks include He ii λ4686 and [Ne v] λλ3346, 3426 (e.g., Dopita & Sutherland 1996; Thuan & Izotov 2005; Izotov et al. 2012; Jaskot & Oey 2013). However, we do not detect the He ii or [Ne v] emission line in O iiiB-4 and O iiiB-1 above the 3σ flux limit of roughly 1.0 × 10⁻¹⁸ erg s−1 cm−2. This places the upper limit of the He ii/Hβ ratios at <0.03 in the case of O iiiB-4. O iiiB-1 even seems to show He ii λ4686 as an absorption line (left panel of Figure 11). The nondetection of He ii and [Ne v] of O iiiB-4 is also shown in the middle and right panels of the figure, respectively. The lowest shock velocity of 100 km s−1 in the MAPPINGS III shock models by Allen et al. (2008) suggests an He ii/Hβ line ratio of 0.47 assuming a density of n = 1.0 cm−3 and solar abundance.
(see Figure 10), when the shock velocity reaches vshock ≥ 350 km s−1 regardless of the values of the magnetic field and the metallicity. The prominent emission lines that are indicative of the fast radiative shocks include He ii λ4686 and [Ne v] λλ3346, 3426 (e.g., Dopita & Sutherland 1996; Thuan & Izotov 2005; Izotov et al. 2012; Jaskot & Oey 2013). However, we do not detect the He ii or [Ne v] emission line in O iiiB-4 and O iiiB-1 above the 3σ flux limit of roughly 1.0 × 10⁻¹⁸ erg s−1 cm−2. This places the upper limit of the He ii/Hβ ratios at <0.03 in the case of O iiiB-4. O iiiB-1 even seems to show He ii λ4686 as an absorption line (left panel of Figure 11). The nondetection of He ii and [Ne v] of O iiiB-4 is also shown in the middle and right panels of the figure, respectively. The lowest shock velocity of 100 km s−1 in the MAPPINGS III shock models by Allen et al. (2008) suggests an He ii/Hβ line ratio of 0.47 assuming a density of n = 1.0 cm−3 and solar abundance.
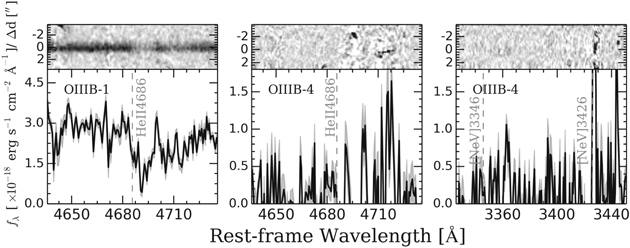
Figure 11. 1D and 2D spectra of O iiiB-1 (left panel) and O iiiB-4 (middle and right panels) at the wavelengths of He ii λ4686 and [Ne v] λλ3346, 3426. The expected wavelength of each line is indicated with the gray dashed line.
Download figure:
Standard image High-resolution imageFor O iiiB-1, for which we have Keck/MOSFIRE NIR spectra, we also use another line diagnostics to investigate the shock scenario. Figure 12 shows the line ratios of each component of O iiiB-1 in various emission-line diagnostic diagrams. The grids of both shock-only and shock+precursor models are also illustrated in the figure in the case of solar metallicity and preshock density of n = 1 cm−3. It is clearly seen that the left component of O iiiB-1 is not in the shock regions in all diagrams. Therefore, it is unlikely that the fast radiative shock is a physical process responsible for the high-ionization parameters observed in O iiiB-4 and the extended part of O iiiB-1.
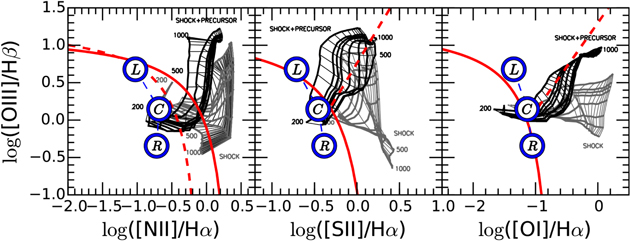
Figure 12. Emission-line diagnostic diagrams of O iiiB-1. Symbols for O iiiB-1 are identical to those in the previous figures. The gray and black grids show the shock-only and shock+precursor models with solar abundance and preshock density of n = 1 cm−3 obtained from MAPPINGS III (Allen et al. 2008), respectively. The grid consists of the lines of constant shock velocity in the range of 200–1000 km s−1 with 50 km s−1 intervals (thin lines) and the lines of constant magnetic parameter ranging from  μG cm3/2 to
  μG cm3/2 (thick lines).
Download figure:
Standard image High-resolution image5.3. Density-bounded Nebulae
As already seen in Figure 5, the [O iii]/[O ii] ratio strongly depends on the ionization parameter and metallicity. The [O iii]/[O ii] ratio increases with increasing ionization parameters and decreasing metallicities. In addition, Shirazi et al. (2014) argued that the high gas density of high-redshift galaxies affects the extreme value of [O iii]/[O ii] ratios. Nakajima & Ouchi (2014) studied the ISM of star-forming galaxies at z = 0–3 and found that the [O iii]/[O ii] line ratio also depends on the escape fraction of the ionizing photons, which is defined as the ratio of ionizing photons escaping the galaxy to the totally produced ionizing photons. To explain the relationship between the [O iii]/[O ii] ratio and the escape fraction, they classified star-forming nebulae into two types: ionization-bounded and density-bounded nebulae. The size of the ionization-bounded nebulae is equivalent to the Strömgren radius, which is determined by the ionization equilibrium between the producing rate of ionizing photons and the recombination rate. In the ionization-bounded nebulae, the high-ionization state of oxygen ions (producing [O iii]) locates close to the ionizing sources, while the envelope of the O+ ions that produce [O ii] is around the edge of the nebulae (e.g., Shields 1990; Oey & Kennicutt 1997; Pellegrini et al. 2012; Nakajima & Ouchi 2014). On the other hand, some fraction of the ionizing photons is allowed to escape from the homogeneous density-bounded nebulae. The H i clouds around the density-bounded nebulae are so small that they are completely ionized. The radius of the density-bounded nebulae is thus constrained by the density of the gas cloud instead of the Strömgren radius, as the complete Strömgen sphere cannot be formed. The size of the O+ region is thus smaller in the density-bounded nebulae than it is in the ionization-bounded system. With a similar size to the O2 + region, the density-bounded nebulae would show larger [O iii]/[O ii] ratio in the extended part.
The high [O iii]/[O ii] ratios of O iiiB-4 may be explained by the hypothesis that the [O iii] blob is the density-bounded nebula. The [O iii]/[O ii] ratio in the outer region is due to the escaping ionizing photons produced by the intense star formation activity at the center of the blob. Arthur et al. (2011) performed a radiation-magnetohydrodynamic (MHD) simulation of the formation and expansion of the H ii regions. They showed that the highly ionized density-bounded nebula is strongly influenced by the radiative feedback and gas instability, leading to the peculiar gas morphologies. O iiiB-1 has only one side with a high [O iii]/[O ii] ratio, implying the asymmetric morphology of the outflow. However, it does not explain why the [O iii]/[O ii] ratio increases at a greater distance from the center of O iiiB-1. Normally, the [O iii]/[O ii] ratio should decrease as a function of the distance from the center, as the O+ ions increase while the O2 + ions decrease at the outer region (Pellegrini et al. 2012). The studies of diffuse ionized gas (DIG) beyond the H ii regions of the local galaxies typically show the decrease in [O iii]/[O ii] ratios at the outer region of the galaxies and suggest lower ionization parameters of DIG than those of the H ii regions (e.g., Zhang et al. 2017). The higher [O iii]/[O ii] ratio of the left component of O iiiB-1 than the rest of the galaxy seems to contradict the typical DIG in the local universe. Nonetheless, Weber et al. (2019) performed a numerical analysis to predict the line ratios of H ii regions and DIG by varying the metallicity, stellar effective temperature, and escape fraction fesc. They found that the [O iii]/[O ii] ratios increase with radius only in the models of the density-bounded leaky H ii regions with a stellar effective temperature of 40,000 K and an escape fraction of less than 10%. This might be the case for O iiiB-1. O iiiB-1 may have the peculiar gas morphology that can cause the leakage of highly ionized photons through a hole in some direction away from the line of sight to the center of the galaxy. Dense gas clouds in the line of sight lead to the low escape fraction, whereas the [O iii] emission is largely scattered toward us from the extended region (Bassett et al. 2019). Further constraint on the escape fraction of O iiiB-1 is necessary to confirm this scenario.
6. Summary
[O iii] blobs are galaxies that exhibit the strong and spatially extended [O iii] emission line beyond their stellar continuum. The first systematic survey of [O iii] blobs has been conducted by Yuma et al. (2017). In this paper, we investigate the physical nature of the [O iii] blobs in more detail by using optical and NIR spectroscopy. We choose the spectroscopic targets based on their large extension of the [O iii] emission line and their coordinates to maximize the number of targets per the observed mask. As a result, we observed the two largest [O iii] blobs at z ∼ 0.63 (O iiiB-1 and O iiiB-2) and another two [O iii] blobs at z ∼ 0.83 (O iiiB-3 and O iiiB-4) in the optical wavelengths with Subaru/FOCAS. O iiiB-1 was also observed in the NIR wavelength with Keck/MOSFIRE. The main results are listed below.
- 1.We confirm the spectroscopic redshifts of all targets to be at the expected redshifts, i.e., O iiiB-1 and O iiiB-2 are at z = 0.6210 and z = 0.6413, respectively. O iiiB-3 and O iiiB-4 are at z = 0.8365 and z = 0.8379, respectively.
- 2.The original survey of [O iii] blobs was based on the hypothesis that the spatially extended [O iii] emission line is caused by the large-scale outflow of gas from the center of galaxies. We could confirm the outflow signature in O iiiB-1, which has a stellar continuum bright enough to be detected with the high S/N. The blueshifted Fe ii λ2326 absorption, Fe ii
 λ2626 fine-structure emission, and Mg ii λ2804 absorption lines are detected with the central velocity offsets of −160, −200, and −270 km s−1, respectively. The outflow velocities are slightly higher than those of normal star-forming galaxies at z = 1–2 by Erb et al. (2012).
 - 3.We examine AGN contribution by using the BPT diagram for O iiiB-1 with available NIR data and the [O iii]/Hβ versus [O ii]/Hβ diagram for the other three blobs, of which we have only the optical spectroscopic data. Among the four observed [O iii] blobs, O iiiB-3 is the only one that is heated by an AGN activity at the center based on its location on the [O iii]/Hβ versus [O ii]/Hβ diagram. O iiiB-1, on the other hand, is located in the region consistent with the the pure star formation activity on the BPT diagram. O iiiB-4 is another [O iii] blob that is identified as a normal star-forming galaxy in the blue diagram, though it shows a remarkably high [O iii]/[O ii] line ratio. Lastly, we could not rule out the possibility of AGN contribution in O iiiB-2; it is likely to be a composite powered by both star formation and AGN activities.
- 4.The properties of the ISM surrounding the [O iii] blobs have been examined by the [O iii]/[O ii]–R23 diagram. O iiiB-1, O iiiB-2, and O iiiB-3 show [O iii]/[O ii] line ratios comparable to those of the local SDSS galaxies and the star-forming galaxies at z ∼ 0.7. Their inferred ionization parameters should be slightly less than qion = 8 × 107 cm s−1. Interestingly, O iiiB-4 exhibits an impressively high [O iii]/[O ii] ratio. The line ratio and the R23 index of O iiiB-4 agree well with those of the compact GPs at z = 0.1–0.4. The ionization parameter of O iiiB-4 should be roughly on the order of 108 cm s−1.
- 5.The radial profile of the [O iii]/[O ii] ratios indicates that O iiiB-4 shows an [O iii]/[O ii] ratio much greater than those of the star-forming galaxies at z ∼ 0.7 and the other three [O iii] blobs. The radial profile of O iiiB-4 shows almost constant [O iii]/[O ii] emission-line ratios of approximately 5–10 over 14 kpc. The [O iii]/[O ii] ratios are consistent with those of the GPs at z = 0.1–0.4; however, the physical sizes are different, as the GPs are compact with [O iii] emission lines within 5 kpc. Thus, we call O iiiB-4 a giant GP. Among the remaining three blobs, there is only one extended part of O iiiB-1 showing an [O iii]/[O ii] ratio as high as the GPs. It is suggested that such a high [O iii]/[O ii] ratio found in the GPs at z = 0.1–0.4 can also be found in the extended component beyond the stellar continuum of the galaxies as well.
- 6.The rest-frame [O iii] EW of O iiiB-4 is 845 ± 27 Å. This is well in agreement with the typical GPs at z = 0.1–0.4, which are the galaxies with high [O iii] EWs by definition. The [O iii] EWs of O iiiB-4 are still consistent with those of the GPs, whose [O iii] EWs are in the range of 100–2000 Å, even if we divide the radial profile into three components according to the distance from the center of the blob. O iiiB-1, O iiiB-2, and O iiiB-3 also have rest-frame [O iii] EWs in the same ranges as the GPs. When we divide the EWs into three components, the large [O iii] EW of the left component of O iiiB-1 (>1000 Å) is obviously seen. It is in agreement with the [O iii]/[O ii] ratio and the R23 index of this component, which are similar to those of the GPs. However, the centers of O iiiB-1 and O iiiB-2 show [O iii] EWs of ∼100 Å, slightly smaller than those of the GPs.
- 7.The giant GP, O iiiB-4, is also similar to GBs at z ∼ 0.3 in that they show comparable [O iii] EWs and consistent spatial extension of the [O iii] emission line. However, unlike O iiiB-4, GBs are powered by AGNs rather than star formation.
- 8.The giant GP, O iiiB-4, is the [O iii] blob at z ∼ 0.83 that has a low stellar mass of 7 × 10⁷, a high sSFR of 2 × 10² Gyr−1, and low metallicity. Its physical properties are similar to those of the GPs found at z = 0.1–0.4.
- 9.We check whether or not the [O iii] extensions of O iiiB-4 and O iiiB-1 are an AGN light echo influenced by the AGN activities in the past. The blue diagram suggests that the extended parts of O iiiB-4 and O iiiB-1 are caused by the star-forming activity. Thus, we can rule out the AGN light echo scenario.
- 10.The fast radiative shock is another potential mechanism to explain the high [O iii]/[O ii] ratios. We do not detect the shock-indicative emission lines such as [Ne v] λλ3346, 3426 and He ii λ4686 in O iiiB-4 and O iiiB-1 at the 3σ flux limit of 1.0 × 10⁻¹⁸ erg s−1 cm−2. The upper limit of the He ii/Hβ ratios (<0.03) suggests that the fast radiative shock is unlikely.


The most likely scenario to explain the high [O iii]/[O ii] ratios observed in O iiiB-4 and the extended component of O iiiB-1 is probably density-bounded nebulae. In the case of the density-bounded nebulae, high-ionization photons can escape from the center of the galaxy, and the O+ region producing the [O ii] emission line is small because of the small H i cloud. The density-bounded region at the center might lead to a harder emitted spectrum that ionizes the more extended nebulae. Further observations are needed to confirm whether the physical conditions of the [O iii] blobs are really consistent with the density-bounded nebulae.
The authors are very grateful to an anonymous referee for valuable comments that helped improve the article. This work is supported by Faculty of Science, Mahidol University, Thailand, and the Thailand Research Fund (TRF) through a research grant for new scholars (MRG6180279). We thank Moire Prescott for her useful comments. S.Y. thanks David J. Ruffolo for support as a mentor of the TRF research grant. M.O. is supported by the World Premier International Research Center Initiative (WPI Initiative), MEXT, Japan, and KAKENHI (15H02064, 17H01110, and 17H01114) Grant-in-Aid for Scientific Research (A) through the Japan Society for the Promotion of Science.
Appendix: Correction for Dust Attenuation
In order to obtain accurate results of the observed fluxes and the line ratios, we need to take dust extinction into account. For O iiiB-1 and O iiiB-2, we are able to detect the Hγ emission lines and use the Balmer decrement to derive the dust attenuation. In addition, we can also detect the Hα emission line of O iiiB-1 from the Keck/MOSFIRE spectrum. The observed Hγ, Hβ, and Hα fluxes of O iiiB-1 are 4.92 × 10⁻¹⁷ erg s−1 cm−2, 1.24 × 10⁻¹⁶ erg s−1 cm−2, and 4.76 × 10⁻¹⁶ erg s−1 cm−2, respectively. These result in Hγ/Hβ and Hα/Hβ line ratios of 0.40 ± 0.08 and 3.84 ± 0.40, respectively. The Hγ/Hβ line ratio for O iiiB-2 is 0.39 ± 0.26 because the Hγ and Hβ emission lines show observed fluxes of 1.04 × 10⁻¹⁶ erg s−1 cm−2 and 2.70 × 10⁻¹⁶ erg s−1 cm−2, respectively. The color excess E(B − V) can be derived from the Hγ/Hβ ratio as follows:


Likewise, the Hα/Hβ line ratio is related to the color excess as


The intrinsic Hγ/Hβ and Hα/Hβ ratios are 0.469 and 2.86, respectively. They are obtained by assuming case B recombination with an electron density of 102 cm−3 and temperature of 104 K (Osterbrock 1989). The reddening curve κ(λ) is derived by adopting the expression in Calzetti et al. (2000). Substituting κ(Hγ) = 5.12, κ(Hβ) = 4.60, and κ(Hα) = 3.33 into the above equations, we obtain color excesses  of 0.33 ± 0.19 mag and 0.24 ± 0.10 mag for O iiiB-1 as derived by using the Hγ/Hβ and Hα/Hβ line ratios, respectively. These are consistent with each other within 1σ uncertainty. For O iiiB-1, we adopt
  to correct for the dust attenuation. Because the Hγ and Hβ lines are observed simultaneously with the same instrument, they suffer less from different slit correction or flux calibration as compared to the Hα emission line. The color excess of O iiiB-2 estimated from the Hγ/Hβ ratio is 0.41 ± 0.42 mag. These nebular color excesses derived from the Balmer decrement are roughly consistent with those of stellar continuum estimated by the SED fitting method (Yuma et al. 2017) after multiplying by a factor of 0.44 described in Calzetti et al. (2000). For O iiiB-3 and O iiiB-4, whose Hγ emission lines are not detected, we estimate nebular color excesses from the stellar color excesses obtained by the SED fitting method (Yuma et al. 2017). The color excesses of all four blobs are listed in Table 4. It is noteworthy that we assumed the constant dust extinction across the [O iii] blobs. We checked the Hα/Hβ ratio profile of O iiiB-1 and found that the Hα/Hβ ratios decrease slightly with increasing distance up to 5–6 kpc from the center of O iiiB-1. However, the ratios are still within the line ratio uncertainty of the entire blob.
Table 4. Color Excesses of Four [O iii] Blobs at z = 0.63–0.83 Derived from the Balmer Decrement and SED Fitting Method
| [O iii] Blobs |

|

|
|
|---|---|---|---|
| Hγ/Hβ | Hα/Hβ | SED Fitting | |
| O iiiB-1 | 0.33 ± 0.19 | 0.24 ± 0.10 |

|
| O iiiB-2 | 0.41 ± 0.42 | ⋯ |

|
| O iiiB-3 | ⋯ | ⋯ |

|
| O iiiB-4 | ⋯ | ⋯ |

|
Download table as: ASCIITypeset image
Footnotes
- 5
- 6
This is not the case for O iiiB-2 and O iiiB-4, whose slit direction is fixed to that of O iiiB-3, the brightest [O iii] blob in the same mask (see Section 3.1).
- 7
IRAC ch1 and ch2 are the mid-infrared data obtained with the Infrared Array Camera from the Spitzer UKIDSS Ultra Deep Survey (SpUDS; PI: J. Dunlop).
- 8
Note that we do not plot O iiiB-3 in Figure 9 because the AGN contribution might affect the SED fitting results.