Abstract
We have applied the semi-empirical spectral analysis, developed by the Sloan Digital Sky Survey (SDSS)-IV/Apache Point Observatory Galactic Evolution Experiment 2 (APOGEE2) Massive Star Team, to a large sample of new O- and B-type stars identified along the Sagittarius spiral arm, in the direction of the southern star clusters NGC3603 and NGC3576. We obtained H-band spectra for 265 point sources, using the APOGEE2-S spectrograph at the du Pont Telescope at the Las Campanas Observatory. We analyzed the associated spectral features deriving spectral types, as well as the massive star distribution along the line of sight. From a total of 265 science targets, 95 are classified as mid- to late-O-type stars (for which only 10 O-type stars are previously known in the literature), 38 are found to be early- to mid-B-type stars, and 32 are classified as either yellow or blue supergiants, completing a total of 165 massive stars.
1. Introduction
The study of individual stars in the Milky Way (MW) is a powerful tool to understand the formation and evolution of our own Galaxy. Massive stars are continuously forming in the disk of this prototypical spiral galaxy. As a result, they synthesize chemical elements from helium to iron, returning them to the interstellar medium (ISM). Through successive stellar generations, the present-day chemical element abundances are achieved. It is well established that high-mass stars evolve faster and end up as core-collapse supernovae, producing most of the alpha-elements in the ISM. Massive stars are also key actors in the energy balance of the Galaxy, as their powerful winds and expanding H ii regions inject large quantities of momentum and energetic ultraviolet (UV) photons into their surroundings. However, high-mass stars are extremely rare. The canonical Salpeter initial mass function (IMF) implies that for each star with over 20 M⊙ formed in the Galaxy, about 100,000 solar-type stars are expected (Zinnecker & Yorke 2007).
The Sagittarius Spiral Arm (hereafter, SSA) hosts some of the most massive star-forming regions in the MW, which in many cases, contain hundreds of OB stars (Smith 2006), making this part of the Galaxy an excellent laboratory for the study of spatially segregated formation of stars and triggering mechanisms, as well as of isolated field stars.
Figure 1 shows a Two Micron All Sky Survey (2MASS7 ) JHKs color-composite image of the aforementioned portion of the Galactic plane. The starburst cluster NGC3603 and the massive star-forming region NGC3576 are prominently seen close to the center of the field. The former is at a distance of d ∼ 7.6 kpc while the later is at d ∼ 2.0 kpc, illustrating that in this direction, we are examining a long stretch of the SSA. As a consequence, several other massive star-forming molecular complexes are covered within our survey area, allowing the study of the evolution of a diversity of young H ii regions and their stellar content, with a rich mixture of evolutionary stages.
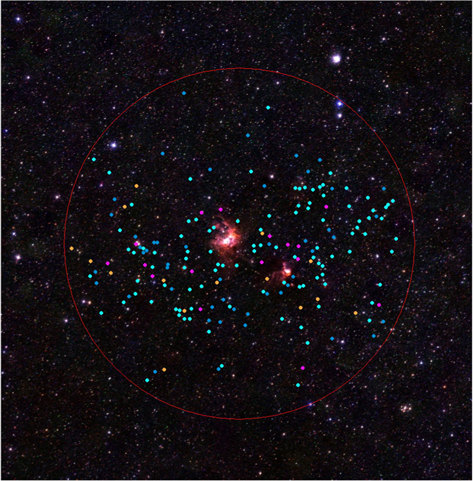
Figure 1. The 291-00-C (CNTAC project CN2017B-11) APOGEE2-S plate target positions, overlaid on the 2MASS color-composite image of the Galactic field in the direction of NGC3603 (center) and NGC3576 (to the right). North is up and east to the left. The large red circle indicate the approximate projected size of the APOGEE2-S plate field of view. The solid colored circles indicate the positions of the stars in our sample, which are coded as follows: O stars (cyan), B stars (light blue), BSGs (magenta), and YSGs (gold).
Download figure:
Standard image High-resolution imageIn this paper, we identify more than a hundred massive stars (O- and B-type stars as well as several supergiant stars from blue to yellow types), using Sloan Digital Sky Survey (SDSS)-IV/Apache Point Observatory Galactic Evolution Experiment 2 (APOGEE2) southern data, which were acquired in the framework of the Chilean National Time Allocation Committee (CNTAC) project CN2017B-11. In Section 2, we briefly describe the APOGEE2 project; in Section 3, we present the details on the target selection and results. In Section 4, we discuss the results, and in Section 5, we present the summary and future work.
2. The APOGEE2 Survey
The APOGEE (Majewski et al. 2017) was one of the core projects of the third phase of the Sloan Digital Sky Survey (SDSS-III; Eisenstein et al. 2011; Gunn et al. 2006), providing valuable constrains for the study of the chemical history and evolution of the Galaxy. The extension of the program, the APOGEE2 Survey, expands its coverage to the southern Milk-Way from the Las Campanas Observatory (LCO), representing a unique all-sky spectral database of hundreds of thousands stars (Zasowski et al. 2017).
The survey is performed using two APOGEE instruments, the first (APOGEE2-N) operating at the Apache Point Observatory (Gunn et al. 2006) and the second (APOGEE2-S) located in the southern hemisphere at LCO (Wilson et al. 2010, 2019). Each of them is a 300-fiber spectrograph working in the wavelength range of 15000–17000 Å in the near-infrared (NIR) H band. They work over three detectors that individually cover the ranges of 15145–15810 Å (blue), 15860–16430 Å (green), and 16480–16950 Å (red), with a mean resolving power of R ∼ 22,500. Each APOGEE observation (or visit) is a 1 hr block integration covering fields of radii 15 and 1
0 for APOGEE2-N and APOGEE2-S, respectively. In each visit, most of the 300 fibers are dedicated to science targets, with a minor portion (about 35 fibers per visit) being used for telluric and sky line corrections. For more details on the APOGEE data reduction procedure, see Nidever et al. (2015).
The APOGEE2-S spectroscopic data of this work were collected during three nights of the 2018 southern summer. In Table 1, we present a summary of the observations with some key information of our CNTAC SDSS-IV/APOGEE2-S program.
Table 1. Resume of the SDSS-IV/APOGEE2-S Observations of Plate 291-00-C of the CNTAC Program CN2017B-11
| Field | Plate Number | MJD | R.A. | Decl. |
|---|---|---|---|---|
| 291-00-C | 10294 | 58147 | 168.6954 | −61.2669 |
| 291-00-C | 10294 | 58148 | 168.6954 | −61.2669 |
| 291-00-C | 10294 | 58149 | 168.6954 | −61.2669 |
Download table as: ASCIITypeset image
3. Definition of the Sample and Results
In this section, we describe the selection criteria used to construct our sample of massive star candidates. We also define the physical constraints for the APOGEE2-S observations of the selected stars, describing the methods applied for analyzing the spectra, emphasizing on our quantitative 2D spectral classification of early-type stars using APOGEE2-S spectra. Finally, we discuss the results of our CNTAC/APOGEE2-S survey.
3.1. Target Selection Criteria and Physical Constraints
The O, B, and supergiant stars presented in this study were selected from the 2MASS Point Source Catalog (PSC; Skrutskie et al. 2006) applying an NIR color selection criteria adapted from the work of Roman-Lopes et al. (2016), with the H-band magnitudes of the point sources satisfying a slightly different magnitude range: (a) H-band magnitudes in the range of 8.0 < H < 12.15 with associated errors < 0.1 magnitude (only sources with AAA flags) and (b) NIR colors satisfying 0.3 < (J − KS) < 1.65 and 1.5 < [(J − H)/(H − KS)] < 2.1. About 330 sources are selected from the mentioned criteria. However, for a given sample, the number of targets that can be observed in a plate is limited not only by the available fibers (265 fibers assigned to science targets, excluding those used to perform telluric and sky corrections on the APOGEE data), but it is also dependent on the fiber collision limit, which, in turn, is set by the physical size of the optical fiber connector. In the case of the southern spectrograph, the effective fiber collision radius is about 56″. In order to observe point sources in high-density stellar fields, a solution is to dedicate more visits to a given field, each with a distinct plate design, allowing us to observe more sources whose relative distances are smaller than the effective collision radius. On the other hand, due to vignetting at the border of the plate’s field of view (FOV, about 1° radius for APOGEE2-S), only targets positioned at less than 095 from the plate center are observed. Finally, the central part of the plate’s FOV is not covered/used by fibers due to a circular gap at the center of the plate.
Because of the mentioned physical constrains, about 30% of the initial sample was discarded from our science target list. In order to provide additional targets for the remaining science fibers, we looked for sources in the catalog of Mohr-Smith et al. (2017; MS sample), keeping those with assigned effective temperatures in the 30,000–45,000 K range. Unfortunately, not all these sources could be accommodated because of the same physical limitations, and the remaining science fibers were then used to observe stars from the main APOGEE2-S disk program.
The coordinates of the selected targets were crossmatched with those of known O- and B-type stars found in the SIMBAD8 and VIZIER9 databases. Some of them were found to be already known O and B stars, but they were also observed as part of the project. In Figure 1, we show the relative positions of the massive stars identified in this work. Most of the targets are seen spread around the NGC3603 and NGC3576 cluster centers and, as expected, distributed mainly along the Galactic plane direction.
3.2. Results
From the plates and epochs listed in Table 1, a total of 265 individual targets were observed during the three visits of our SDSS-IV/APOGEE2-S CNTAC Program CN2017B-11. From visual examination of the features present in the associate spectra, and the careful measuring of the equivalent widths (EW) and the FWHM of the respective hydrogen spectral lines, we found that from the 265 individual sources observed in our CNTAC/APOGEE2-S program, the massive star subsample is composed by 95 O-type stars, 38 B-type stars, 16 blue supergiants (BSGs), and 16 yellow supergiants (YSGs). A small portion of the associated APOGEE2-S spectra are presented in the next section. The entire sample of APOGEE2-S O-, B-, BSG- and YSG-stars are public available and can be accessed using the SDSS DR16 Science Archive Server (SAS).10 Besides the mentioned types, another 32 stars present emission line features typical of Wolf-Rayet and Be-type stars, as well as young stellar objects (YSOs). Those sources will be the subject of an upcoming paper. Additionally, the remaining 68 sources are compound by late-type stars of the F, G, K, and M types.
Figure 1 shows the relative positions (solid colored circles) of the O, B, BSG, and YSG types, with the colors indicating the distinct flavors as follows: O stars (cyan), B stars (light blue), BSGs (light green), and YSGs (gold). Their positions in the [(J − H)/(H − KS)] versus (J − KS) diagram are shown in Figure 2, with the same color coding. In this diagram, we also show the position of a red supergiant star (red dot) identified by us as part of the main APOGEE2-S disk sample (not treated in this work). Finally, Table 2 presents the list of O (#1–#95), B (#96–#133), BSG (#134–#149), and YSG (#150–#165) stars. Column (1) contains the internal ID, column 2 contains the APOGEE ID, column 3 contains the source ID as available in the literature, column 4 contains the 2MASS H-band magnitudes, column 5 contains the spectral type and luminosity class (if any) taken from the literature, and column 6 contains the reference from which the spectral types and luminosity classes were taken.
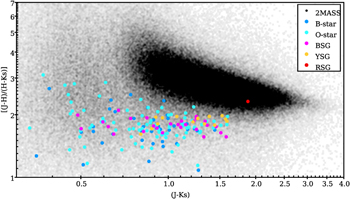
Figure 2. The [(J − H)/(H − KS)] vs. (J − KS) diagram used in the selection of the targets of the APOGEE2-S CNTAC project. The black dots represent the 2MASS point sources in a 2° radius area centered on the NGC3603 cluster coordinates. The colored circles represent the sources we selected to be observed with the APOGEE2-S spectrograph. They are identified by colors: the 2MASS sample for the entire region (black), O stars (cyan), B stars (blue), BSGs (magenta), YSGs (gold), and an identified red supergiant (red), which belongs to the main APOGEE2-S disk sample (not treated in this work).
Download figure:
Standard image High-resolution imageTable 2. SDSS-IV/APOGEE2 Survey of Massive Stars in the Sagittarius Arm
| Star | APOGEE ID | ID | H-mag | Sp. Type | Reference |
|---|---|---|---|---|---|
| # | (Literature) | (2MASS) | (Literature) | ||
| 1 | 2M11075217-6054055 | 10.46 | |||
| 2 | 2M11175752-6133269 | 9.62 | |||
| 3 | 2M11164098-6124209 | 9.75 | |||
| 4 | 2M11125312-6112116 | 10.27 | |||
| 5 | 2M11192934-6153574 | 10.41 | |||
| 6 | 2M11161262-6143542 | 2MASS J11161262-6143542 | 9.924 | O3.5If* | Roman-Lopes et al. (2016) |
| 7 | 2M11151536-6051176 | 2MASS J11151536-6051176 | 9.392 | O2.5If*/WN6 | Roman-Lopes et al. (2016) |
| 8 | 2M11153211-6141464 | 10.29 | |||
| 9 | 2M11074348-6110253 | 10.07 | |||
| 10 | 2M11084090-6042395 | [PCN2006] 8 | 9.94 | B1Ia | Pasquali et al. (2006) |
Note. List of O (#1–#95), B (#96–#133), BSG (#134–#149), and YSG stars (#150–#165) observed in the framework of the CNTAC APOGEE2-S project CN2017B-11. Column (1) contains the internal ID, column 2 contains the APOGEE ID, column 3 contains the source ID found in the literature, column 4 contains the 2MASS H-band magnitudes, column 5 contains the spectral type and luminosity class (if any) taken from the literature, and column 6 the reference from which the spectral types and luminosity classes were taken.
Only a portion of this table is shown here to demonstrate its form and content. A machine-readable version of the full table is available.
Download table as: DataTypeset image
3.2.1. Spectral Line Parameter Measurements
For each star in Table 2, we performed a careful measurement of the associate line profiles of the hydrogen 4–11 (Br11) and 4–13 (Br13) and helium 7–12 and 7–13 lines, using the routines available in the IRAF11 SPLOT package (Tody 1986, 1993). The results are shown in Table 3. The uncertainties in the EWs, and FWHM values range from about 10% for line measurements in the spectra with the highest signal-to-noise ratio (S/N), usually above 200–250 in case of the brightest sources, to about 20%–25% for spectra presenting lower S/N values, typically in the range 80–150. In addition to the EW and FWHM values mentioned above, we also performed radial velocity measurements from the Doppler shifts detected in the associate spectral lines, with the procedure being done for all stars listed in Table 2. The kinematic analysis for the massive star sample will not be treated in this work and will be presented later in another paper of this series.
Table 3. Line Parameters and Spectral Type Estimates from the APOGEE2-S Spectra of O and B Starsa
| # | EW(A) | FWHM(A) | EW(A) | FWHM(A) | EW(A) | FWHM(A) | EW(A) | FWHM(A) | Sp. Type | Lum. Class | Sp. Type |
|---|---|---|---|---|---|---|---|---|---|---|---|
| [Br11] | [Br11] | [Br13] | [Br13] | [He ii 7–12] | [He ii 7–12] | [He ii 7–13] | [He ii 7–13] | (This work) | (Literature) | ||
| 1 | 1.2 | 13.4 | 1.3 | 13.4 | O9.5-B0 | I-III | |||||
| 2 | 1.6 | 20.0 | 0.6 | 22.4 | O9.5-B0 | I-III | |||||
| 3 | 1.3 | 28.3 | 0.9 | 25.2 | O9.5-B0 | IV-V | |||||
| 4 | 1.4 | 16.7 | 1.5 | 19.0 | O9.5-B0 | I-III | |||||
| 5 | 1.1 | 18.6 | 0.5 | 15.0 | 0.1 | 6.5 | O9 | I-III | |||
| 6 | 0.6 | 22.0 | 0.5 | 25.4 | 0.5 | 17.3 | 0.2 | 13.8 | O7.5 | I-III | O3.5 |
| 7 | 1.4 | 26.6 | 1.9 | 44.0 | 0.6 | 14.4 | 0.4 | 13.0 | O7 | IV-V | O2 |
| 8 | 1.2 | 13.0 | 1.3 | 17.0 | O9.5-B0 | I-III | |||||
| 9 | 1.3 | 9.7 | 1.8 | 12.1 | 0.1 | 8.0 | O9 | I-III | |||
| 10 | 0.3 | 17.0 | O9.5-B0 | I-III | B1 |
Note.
aEW and FWHM measurements for the H i (Br11 and Br13) and He ii (7–12 and 7–13) spectral lines detected in the spectra of the Sagittarius APOGEE2-S O-star sample. Associated uncertainties on the quoted values are estimated to vary from 10%–25%.Only a portion of this table is shown here to demonstrate its form and content. A machine-readable version of the full table is available.
Download table as: DataTypeset image
3.2.2. Luminosity Classes and Spectral Types of the New O- and B-type Stars
H-band spectra of O stars usually show He ii (7–12 and the 7–13) absorption lines, as well as relatively weak hydrogen absorption lines of the Bracket series (Figure 3). On the other hand, in the case of H-band spectra of early- to mid-B stars (Figure 4) of classes iv–v, the 7–12 and the 7–13 He ii lines vanish, with the hydrogen lines of the Brackett series being much stronger and deeper (EW[Br11+Br13] > 3.6 Å) than those seen in the spectra of the O stars. Roman-Lopes et al. (2018) showed that the EW of the Br11 and Br13 hydrogen lines, combined (when possible) with the corresponding values for the He ii (7–12 and the 7–13) line transitions, enable reliable spectral type estimation for mid- to late-O stars, as well as for early- to mid-B stars. The appropriate linear relations can be chosen based on the observed position of the source in an EW[Br11+Br13] versus mean FWHM[Br11–Br13] diagram, as shown in Figure 5. There the O-type stars in our sample (indicated by the solid cyan circles) that occupy a well-defined region on its bottom left side, while the B-type stars (class iv–v, represented by the solid blue triangles) are found spreading from the top middle to the right part of the diagram.
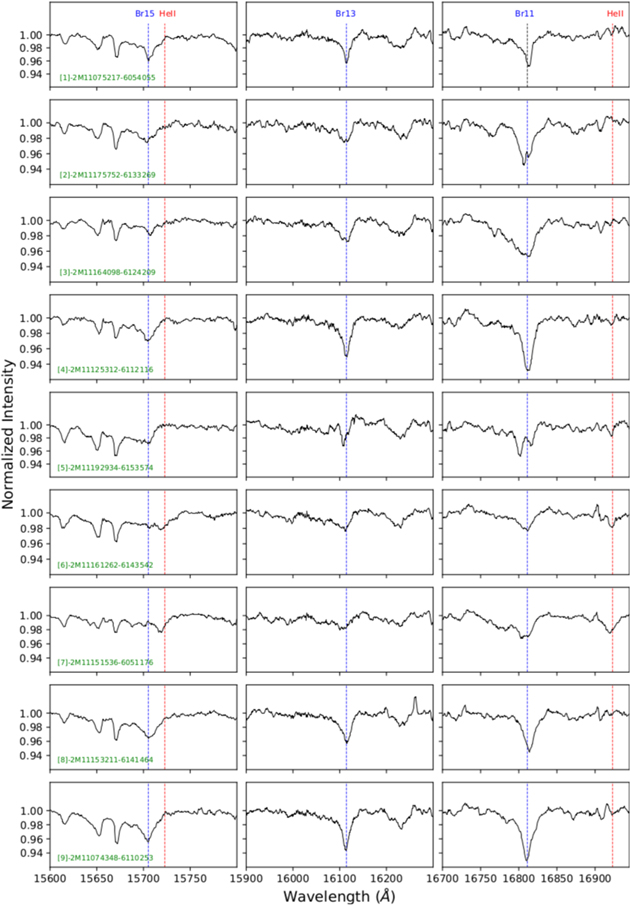
Figure 3.
H-band spectra of O stars obtained with the APOGEE2-S plate 291-00-C in the framework of the CNTAC project CN2017B-11 showing the spectral regions of the Br11, Br13, and Br15 lines, as well as the 7–12 and 7–13 helium line transitions. The spectra for the remaining O stars are available in Figure Set 3. (The complete figure set (10 images) is available.)
Download figure:
Standard image High-resolution image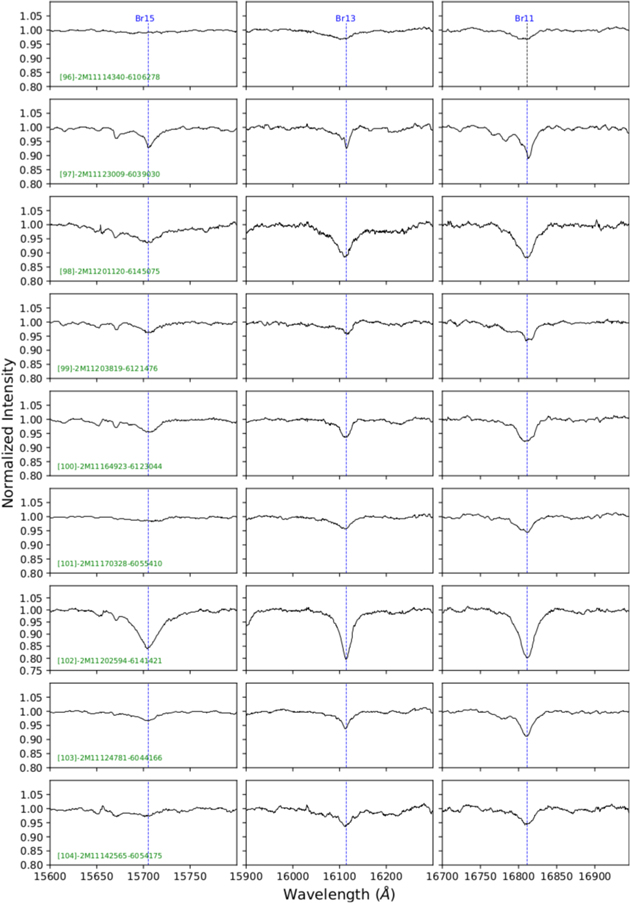
Figure 4.
H-band spectra of B stars obtained with the APOGEE2-S plate 291-00-C in the framework of the CNTAC project CN2017B-11 showing the spectral regions of the Br11, Br13, and Br15 lines. Only 9 spectra (among the 38 B stars observed in the APOGEE2-S plate 291-00-C) are shown. The spectra for the remaining B-type stars are available in Figure Set 4. (The complete figure set (5 images) is available.)
Download figure:
Standard image High-resolution imageIn order to estimate the spectral types of the O- and B-type stars in our sample, the first step was to determine their most probable luminosity classes using the line parameter values shown in Table 3, following the methodology described by Roman-Lopes et al. (2018). Then, by using the appropriate linear relations and the hydrogen and helium EW values, spectral types for each O and B star in Table 3 were computed, considering the numerical values in intervals following the sequences: O stars [(5.0–5.5), (5.5–6.0),…, (9.0–9.5)] corresponding to [(O5–O5.5), (O5.5–O6),..., (O9–O9.5)] and B stars [(10–10.5), (10.5–11),…, (14.5–15)] corresponding to [(B0–B0.5), (B0.5–B1),…, (B4.5–B5)]. In cases in which the spectra of the stars also contain the helium lines, the spectral types were defined by taking the average of the values computed from the equations associated to the two transitions. In case of sources with no He ii lines, we derived lower and upper limits to their spectral types, and in the cases in which both results agree, only the resulting spectral type (not a range) was assigned (Roman-Lopes et al. 2018). The results obtained in the spectral classification process are shown in the last columns of Table 3 with the O stars corresponding to sources #1–#95 and the B stars (classes iv–v) corresponding to sources #96–#134.
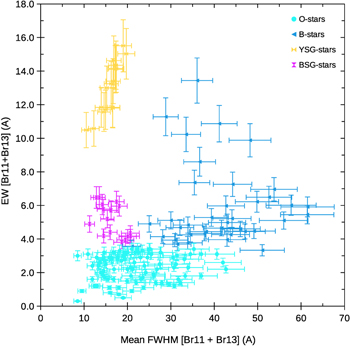
Figure 5. O-type stars can be separate into two groups. The first is composed exclusively by stars whose spectra present hydrogen Bracket line EWs satisfying the criteria EW(Br11) < 1.0 Å and EW(Br13) < 0.75Å (“O stars only”—Roman-Lopes et al. (2018)). The second group (“[O + B0–B1] cand”) is composed by stars with EW measured values in the range of 1.0 < EW(Br11) < 2.1 Å, and 0.75 < EW(Br13) < 1.5 Å. These sources likely have spectral types in the range from O9 to B0–B1. However, in a few cases, some O stars (identified as such by the presence of He ii 7–12 and 7–13 spectral line transitions) may present unusually strong hydrogen lines (Bracket series; for more details, see discussion in Roman-Lopes et al. 2018).
Download figure:
Standard image High-resolution image3.2.3. BSG and YSG Stars
Besides the new O- and B-type stars presented above, in the APOGEE2-S sample, we also identified new Galactic BSG and YSG stars. Figures 6 and 7 show some APOGEE2-S spectra of the mentioned type. The remaining spectra of BSG and YSG stars can be accessed using the SDSS DR16 SAS.12
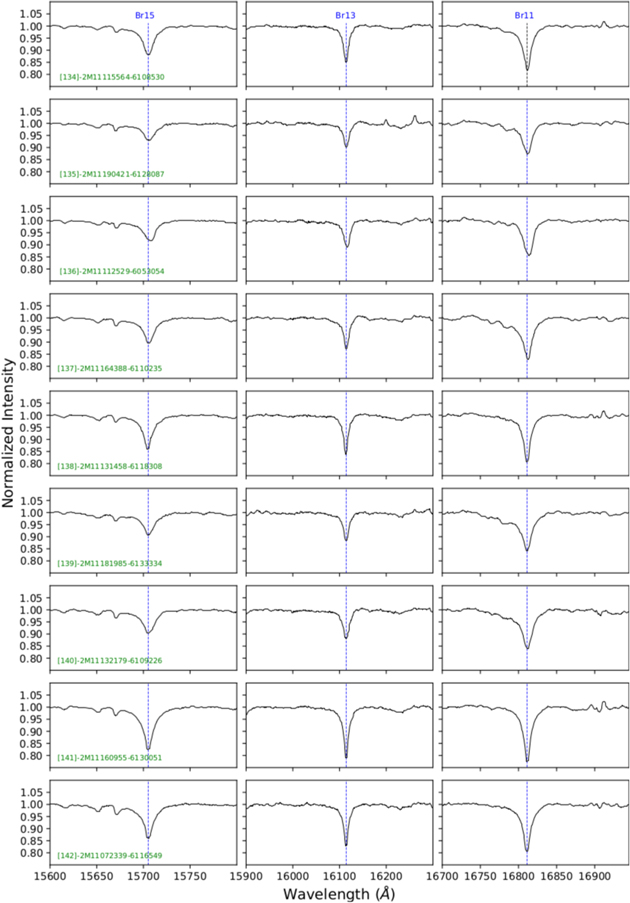
Figure 6.
H-band spectra of BSG stars obtained with the APOGEE2-S plate 291-00-C, in the framework of the CNTAC project CN2017B-11. It is possible to see that the main spectral features are the Br11, Br13, and Br15 lines. Only nine spectra are shown here. The APOGEE2-S spectra of the remaining BSG stars are available in Figure 6.1. (The complete figure set (2 images) is available.)
Download figure:
Standard image High-resolution imageFrom visual inspection of the APOGEE2-S spectra of BSGs and YSGs, it is possible to see that the hydrogen lines of the Brackett series are narrower and deeper than those found in the spectra of B-type stars of the class iv–v. Furthermore, in the case of YSG stars, their spectra also contain atomic transition lines produced by heavier elements, like C, Mg, and Fe. On the other hand, concerning the positions occupied by BSG and YSG stars in the EW[Br11+Br13] versus mean FWHM[Br11–Br13] parameter space (Figure 5), we can see that, like in the cases of O and B stars (classes iv–v), BSGs and YSGs are also seen forming separate groups in areas of the diagram, as follows: BSGs—10 Å < mean FWHM[Br11–Br13] < 23 Å and 3.8 Å <EW[Br11+Br13] < 7 Å; YSGs: 10 Å <mean FWHM[Br11–Br13] < 23 Å and 10 Å <EW[Br11+Br13] < 16 Å.
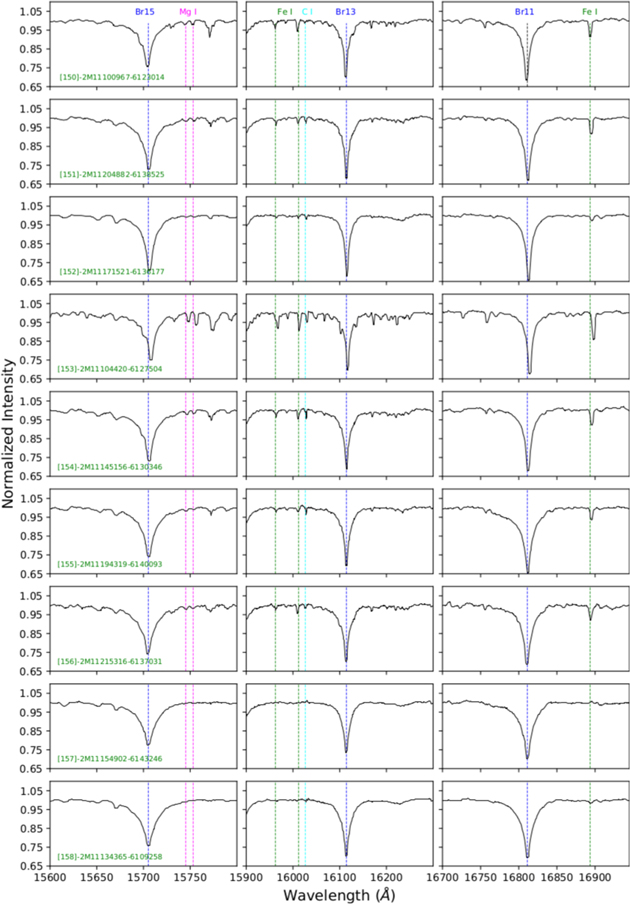
Figure 7. H-band spectra of YSG stars obtained in the framework of the CNTAC project CN2017B-11, with the APOGEE2-S plate 291-00-C . It is possible to see that the associated spectral range also contains (besides the Br11, Br13, and Br15 lines) some absorption lines possibly produced by Mg, Fe, and C atomic transitions. The APOGEE2 spectra of the remaining BSG stars are available in Figure 6.2.
Download figure:
Standard image High-resolution imageIn case of the new BSG stars, we computed their spectral types using the associated EW values (sources #134–#149 in Table 3), and the spectral type (“Sp. Type”) versus EW linear relation for early- to mid-B supergiant stars obtained by Roman-Lopes et al. (2018, their Equation (1)). The results are listed in the last columns of Table 3, and as can be seen there, they are mostly of the B1–B2 types. On the other hand, for the YSG stars, the approach we used in the spectral type estimation was different. As this type of star was not previously studied by us with the APOGEE spectrographs, we made use of the template spectra of supergiant stars of Meyer et al. (1998). In Figure 8, there are six exemplars of H-band spectra of supergiant stars from their sample: HR1017 (B8 Ia), HR3975 (A0 Ib, HR1865 (F0Ib), HR1017 (F5 I), HR7796 (F7/F8 -band spectra of c Ib), and HR7479 (G1 II). Although the spectral resolution of the Meyer’s spectra is lower than that of APOGEE2-S, it is still possible to easily recognize several spectral features common to both samples: (a) three hydrogen lines of the Brackett series; (b) two lines at 15745 and 15753 Å, possibly corresponding to Mg i; and (c) three narrow lines at 15965, 16010, and 16893 Å that are probably due to Fe i transitions. Indeed, for each of the mentioned lines, we found from inspection of the Fe i line lists of the NIST Atomic Spectra Database13 that several Fe i lines, taking into account the spectrograph’s resolution, should probably appear blended at the mentioned wavelengths. (d) One line at 16022 Å was possibly due to C i. Although it is desirable to have the mentioned spectral features properly identified in the template spectra, for the purpose of this work, it is useful just to use them as H-band NIR indicators for the YSG spectral types.
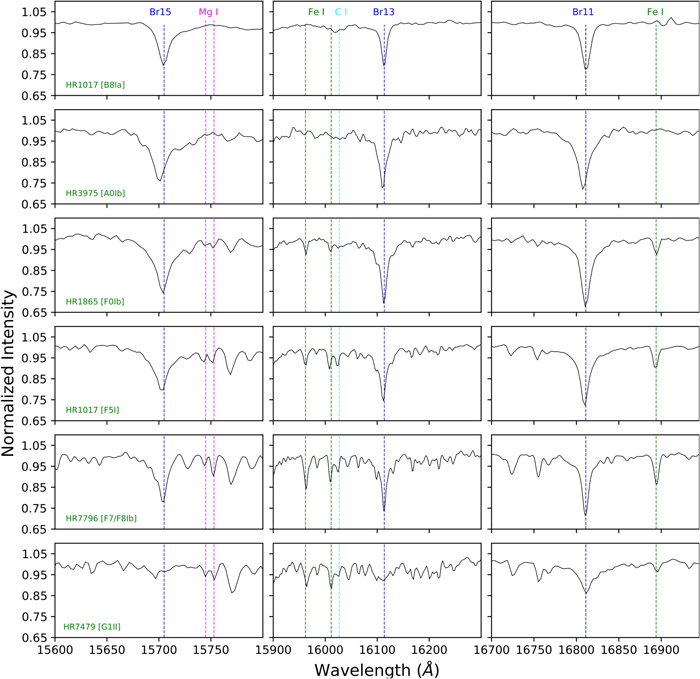
Figure 8. Template spectra of YSG stars from B8–G1 spectral types (Meyer et al. 1998).
Download figure:
Standard image High-resolution imageIn Figure 9 (in black), we present the H-band spectra of the supergiant stars HR1865 (F0Ib) and HR1017 (F5Ib), together with the APOGEE2-S spectra (in red) of the sources 2M11100987-6123014 and 2M11104420-6127504. In order to highlight the similarity between spectral types of the APOGEE2-S supergiant stars with those from the template spectra of supergiants of Meyer et al. (1998), the APOGEE2-S spectra were degraded in their resolution by using a Gaussian filter. We can see that, despite the small differences in the shape of the continuum of the two spectral samples, as well some differences on the intensity of some atomic lines, the observed similarity enables us to provide reliable spectral type estimates for the program stars.
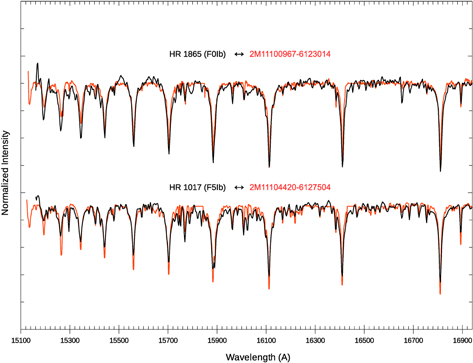
Figure 9. H-band spectra for the known YSG stars (in black) HR1865 (F0Ib) and HR1017 (F5Ib) together with the spectra (in red) of the APOGEE2-S sources 2M11100987-6123014 and 2M11104420-6127504. In order to highlight the similarity between spectral types of the APOGEE2-S supergiant stars with those from the template spectra of supergiants of Meyer et al. (1998), the APOGEE2-S spectra were degraded in their resolution by using a Gaussian filter.
Download figure:
Standard image High-resolution imageBased on the comparison of the YSG template spectra with those of the new YSG stars, spectral types were assigned, and the results for sources #150–#165 are shown in Table 3. There we can see that from the 16 YSG stars, most are probably of the F type (nine), with three others being of the A0 type. For the remaining four exemplars in Table 3, they are probably intermediate A supergiants, but due to the lack of A-type supergiant templates (e.g., A1–A9), we assign spectral type A0–F0 for them.
4. Discussion
4.1. O-star Luminosity Classes in the Sagittarius and Perseus Arms
Regarding the luminosity classes for O-type stars in Table 3 (stars #1–#95), we see that the majority have hydrogen mean FWHM[Br11–Br13] values lower than 25 Å, which, according to Roman-Lopes et al. (2018), does indicate a giant or supergiant nature. This result is quite different from that obtained by Roman-Lopes et al. (2019) in their similar SDSS-IV/APOGEE2 study of O stars in the direction of the W3, W4, and W5 massive star formation regions in the Perseus arm. This is illustrated in Figure 10, where we show comparative distributions (histograms with 5 Å bins) of the fraction of sources as a function of their FWHM[Br11–Br13] values for the O stars in W3/W4/W5 (Perseus sample) and of those studied here (Sagittarius sample). Clearly, both distributions differ significantly. While in the Perseus sample, only 11% of the O stars belong to luminosity classes i–iii (i.e., having FWHM[Br11–Br13] < 25Å), in the Sagittarius sample, the fraction of giants/supergiants turns out to be about 70%. In the next subsection, we discuss the possible causes for this observed behavior.
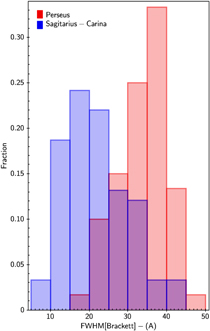
Figure 10. Histogram of the mean EW[Br11+Br13] values for O-type stars in the W3/W4/W5 (Roman-Lopes et al. 2019) star-forming regions (in red—Perseus sample), located in the outer Galaxy, and for the O stars in this work (in blue—Sagittarius sample). We can see that the majority of the O stars in this work have hydrogen mean FWHM[Br11–Br13] values < 25 Å, which, according to Roman-Lopes et al. (2018), may indicate a giant or supergiant nature. This is quite different from what Roman-Lopes et al. (2019) found in W3/W4/W5 massive star-forming regions localized in the outer galaxy. There, the majority of the O-star populations appear to belong to classes iv–v.
Download figure:
Standard image High-resolution image4.2. A Distance Range Bias or an Age Effect?
Although the Sagittarius arm and the Perseus arm samples (Roman-Lopes et al. 2019) are basically compound by an early-type population associated to massive star-forming regions of the Galactic disk, their Galactic longitude distribution make them qualitatively different. The line of sight toward the Perseus arm sample (Galactic longitude l = 134°) intersects the Perseus spiral arm perpendicularly, at a mean heliocentric distance of about 2.8 kpc (Georgelin & Georgelin 1976). The young stellar population in such sample would then be mostly limited spatially to the width of the spiral arm of about 500 pc (Román-Zúñiga et al. 2019). This volume includes the giant complexes, W3, W4, and W5, whose population probably dominates the Perseus sample.
The line of sight toward the Sagittarius sample (Galactic longitude l = 291°) runs along the Sagittarius arm, thus covering a long distance stretch that goes from 2 kpc < d < 10 kpc, obviously including several giant young star formation regions, notably NGC3603 and NGC3576. This assumption is confirmed by the results shown in Figure 11, where we present the histogram of the heliocentric distances to the O, B, BSG, and YSG stars in Table 2 (our Sagittarius sample). The values were taken from the catalog of Gaia Data Release 2 distances of Bailer-Jones et al. (2018). As expected, it shows that the O stars in our sample are in fact distributed along a wide range of heliocentric distances, mostly in the range of 2 kpc < d < 10 kpc, with at least three main O-star groups (highlighted by the peaks of the distribution) at mean heliocentric distances of 2.8, 5.8, and 7.8 kpc. Interestingly, the last one presents a very pronounced peak that is probably associated with the large NGC3603 starburst complex, at a distance of about 7.6 kpc (Melnick et al. 1989; Crowther et al. 2010).
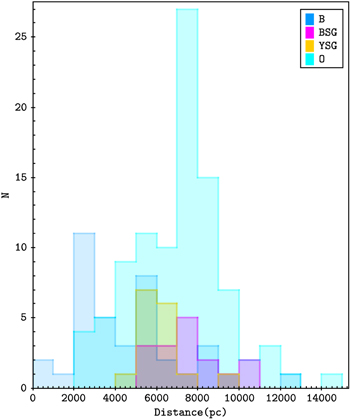
Figure 11. Histogram of heliocentric distances for O, B, BSG, and YSG stars in Table 2, taken from the catalog of Bailer-Jones et al. (2018). It shows that the O stars in our sample are distributed along the Sagittarius arm, mainly at heliocentric distances in the range of ∼2 kpc < d < 10 kpc. Also, it is possible to see the presence of at least three main O-star groups, at the mean heliocentric distances of ∼3.0, 5.8, and 7.9 kpc. The farther one presents a sharp peak that is probably associated with the NGC3603 complex, which is placed at a heliocentric distance of 7.6 kpc (Crowther et al. 2010).
Download figure:
Standard image High-resolution imageAs the Sagittarius sample is H magnitude bound, (8 < H < 12.2), one would expect a certain bias that favors the detection of the most luminous stars, i.e., the supergiant stars. Accordingly, besides the O-type supergiants of the Sagittarius sample, we identified a significant number of other BSG and YSG stars (see e.g., Figure 5). In Figure 12, we show a modified version of the distribution of the mean FWHM[Br11+Br13] values, in which we separate the O stars of the Sagittarius sample into three distance groups: (i) d < 4 kpc (green), (ii) 4 < d < 7 kpc (blue), and (iii) d > 7 kpc (red). It is clear that for all distance groups, most of the O stars still belong to luminosity classes I–III. Defining S/D as the ratio of number of classes I–III to classes IV–V stars, we computed the S/D values for the three groups in Figure 12. The larger S/D ratio 4 corresponds to the O stars closest to the Sun, (those with d < 4 kpc). Also, in the case of the two other distance groups (d > 4 kpc), a high S/D value of 2 is found, which is a much larger value compared to that observed for the Perseus sample (S/D = 0.1). In conclusion, we confirm that the observed behavior is not produced by differences in the heliocentric distances of the O stars.
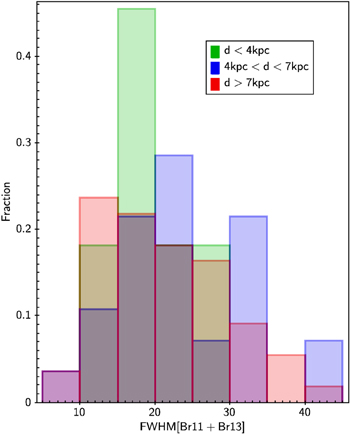
Figure 12. Histogram of mean EW[Br11+Br13] values for O-type stars in Table 3, for three different distance ranges: d < 4 kpc (green), 4 kpc < d < 7 kpc (blue), and d > 7 kpc (red).
Download figure:
Standard image High-resolution imageOn the other hand, as the O stars in the Perseus sample come from a much smaller volume that is occupied mainly by the star-forming regions W3/W4/W5 (Roman-Lopes et al. 2019), the O-star population is expected to be, on average, significantly younger than that from the Sagittarius sample, which covers a much larger volume where the average stellar age of the O-star population tends to be higher. This age effect will result in average S/D ratio values much smaller in the Perseus population than in the Sagittarius sample. Additional studies in other directions and arms of the Galaxy certainly will help us to understand if this effect is a general behavior or just a localized statistical fluctuation at the top heavy end of the Galactic IMF.
4.3. Limitations of the SDSS-IV/APOGEE2 Empirical Classification Method for O Stars
Despite that fact that we only have a few sources in Table 2 with previous spectral classification, it is still possible to critically discuss some of the results obtained in this work, in light of previous studies. From the 165 sources in Table 2, 24 have some spectral type in the literature. Among them, 10 are known O-type stars for which we were able to estimate spectral types that are listed as follows (literature versus this study): sources #6 (O3.5 versus O7.5), #7 (O2 versus O7), #19 (O8 versus O7.5), #25 (O5 versus O8.5), #30 (O5.5 versus O6.5), #31 (O7.5 versus O7.5), #34 (O6 versus O6), #37 (O6 versus O7.5), #48 (O7 versus O8), and #51 (O7 versus O8). The largest discrepancies correspond to the earliest O-type stars (e.g., spectral types earlier than ∼O5). This is not a surprise as Roman-Lopes et al. (2018, 2019) already warned that for the mentioned spectral range, the EWs of the hydrogen Brackett lines stop decreasing monotonically with the temperature increase (while the EWs of the He ii lines deviate from the observed linear relation), and their equations may not deliver good results in the mentioned temperature range. Further studies are necessary in order to properly extend the usage of APOGEE’s H-band spectral window to the study of the earliest O-type stars, which corresponds to the spectral type range not covered by the work of Roman-Lopes et al. (2018).
On the other hand, in the early-B-type regime, the results obtained in case of sources #52 (B0 versus O9.5-B0), #97 (B2 versus B2), #101 (B1.5 versus B1/2), #103 (B0 versus B1), #111 (B1.5 versus B1.5), #116 (B3 versus B3), #121 (B3 versus B2/5), and #133 (B4 versus B2.5) indicate that spectral types for early-B stars obtained with the SDSS-IV/APOGEE2 empirical classification method are in good agreement with those obtained from other spectral ranges and/or methods.
5. Summary and Future Work
In this work, we have applied the SDSS-IV/APOGEE2 semi-empirical spectral analysis for O- and B-type stars described by Roman-Lopes et al. (2018) to a large sample of H-band spectra of candidate massive stars taken in the framework of the SDSS-IV/APOGEE2-S CNTAC Program CN2017B-11. Our main findings and results are as follows:
(I) From a total of 265 science targets observed by our CNTAC program, 95 are classified as mid- to late-O-type stars (for which only 10 are previously known O-type stars) and 54 are found to be early- to mid-B-type stars, with 16 of them possibly being BSGs.
(II) Based on the visual comparison of APOGEE2-S spectra of newly discovered YSGs, with template H-band spectra of YSGs of Meyer et al. (1998), we concluded that from the 16 newly discovered exemplars, 9 are of the F type, while other 3 can be classified as of type A0, with the remaining 4 exemplars probably being intermediate A supergiants, for which we assign spectral types A0-F0.
(III) Based on the luminosity classes for the O-type star sample, we found that the majority have mean hydrogen FWHM[Br11–Br13] values indicative of a giant or supergiant nature. This result is quite different from that obtained by Roman-Lopes et al. (2019) in their SDSS-IV/APOGEE2 survey of O stars in the direction of the W3/W4/W5 massive star-forming regions, localized in the Perseus arm. While in the Perseus sample, only 11% of the O stars belong to classes i–iii, in the Sagittarius sample, about 70% of the O-type stars are found to be giants or supergiants. By defining S/D as the ratio of the number of stars of classes i–iii to classes iv–v, we computed S/D values for three ranges of heliocentric distances. The larger S/D ratio of ∼4 in the Sagittarius sample is that for the closest O stars belonging to the heliocentric distance range of 2 kpc < d < 4 kpc. A high S/D value of ∼2 is found in case of the two other distance groups, which compared to the observed S/D ratio of ∼0.1 computed for the Perseus sample, confirms that the observed behavior is not produced by differences in the O stars’ heliocentric distances. Further studies in other directions and arms of the Galaxy (that are being conducted by the SDSS-IV/APOGEE2 team) can help to understand if this is a general effect or instead just a localized statistical fluctuation on the top heavy end of the Galactic IMF.
(IV) From the 165 sources classified as O, B, or YSG stars, to date, 21 have some spectral type estimation or determination in the literature. Among them, 10 are known O-type stars with discrepancies of 1 to 4 spectral subclasses. In order to improve the efficiency/accuracy of the present semi-empirical methodology, further work is necessary to use the APOGEE spectrograph by extending the study to contemplate the earliest (<O5) O-type stars, which were not covered by the work of Roman-Lopes et al. (2018).
(V) In the case of the B-type stars, the results obtained in this work confirm that spectral type classification of normal early-B-type stars, derived with the SDSS-IV/APOGEE2 semi-empirical method, are in good agreement with those obtained from the optical spectral window.
(VI) Regarding the O-type stars reported here, an analysis of their heliocentric distances shows that the O stars in our sample are mostly distributed along a large range of heliocentric distances, mainly in the range of ∼2 kpc < d < 10 kpc, with at least three main O-star groups probably placed at mean heliocentric distances of ∼3.0 kpc, 5.8 kpc, and 7.9 kpc. Interestingly, the last one presents a very pronounced peak that is likely associated with the NGC3603 complex located at a heliocentric distance of 7.6 kpc.
We acknowledge a very constructive report by the anonymous referee. A.R.-L. acknowledges financial support provided in Chile by Comisión Nacional de Investigación Científica y Tecnológica (CONICYT) through the FONDECYT project 1170476 and by the QUIMAL project 130001. C.R.-Z. acknowledges support from UNAM-PAPIIT grants IN-108117. M.T. acknowledges financial support from UNAM-PAPIIT grant No. IN-107519. D.M. is supported by the BASAL Center for Astrophysics and Associated Technologies (CATA) through grant AFB 170002, by the Programa Iniciativa Cientifica Milenio grant IC120009, awarded to the Millennium Institute of Astrophysics (MAS), and by Proyecto FONDECYT No. 1170121. J.B. acknowledge support provided by the Ministry for the Economy, Development and Tourism, Programa Iniciativa Cientica Milenio grant IC120009, awarded to the Millennium Institute of Astrophysics (MAS). Funding for the Sloan Digital Sky Survey IV has been provided by the Alfred P. Sloan Foundation, the U.S. Department of Energy Office of Science, and the Participating Institutions. SDSS-IV acknowledges support and resources from the Center for High-Performance Computing at the University of Utah. The SDSS website is www.sdss.org. SDSS-IV is managed by the Astrophysical Research Consortium for the Participating Institutions of the SDSS Collaboration including the Brazilian Participation Group, the Carnegie Institution for Science, Carnegie Mellon University, the Chilean Participation Group, the French Participation Group, Harvard-Smithsonian Center for Astrophysics, Instituto de Astrofísica de Canarias, The Johns Hopkins University, Kavli Institute for the Physics and Mathematics of the Universe (IPMU)/University of Tokyo, Lawrence Berkeley National Laboratory, Leibniz Institut für Astrophysik Potsdam (AIP), Max-Planck-Institut für Astronomie (MPIA Heidelberg), Max-Planck-Institut für Astrophysik (MPA Garching), Max-Planck-Institut für Extraterrestrische Physik (MPE), National Astronomical Observatories of China, New Mexico State University, New York University, University of Notre Dame, Observatário Nacional/MCTI, The Ohio State University, Pennsylvania State University, Shanghai Astronomical Observatory, United Kingdom Participation Group, Universidad Nacional Autónoma de México, University of Arizona, University of Colorado Boulder, University of Oxford, University of Portsmouth, University of Utah, University of Virginia, University of Washington, University of Wisconsin, Vanderbilt University, and Yale University. This research has made use of the SIMBAD database, operated at CDS, Strasbourg, France (Wenger et al. 2000). This research has made use of the VizieR catalog access tool, CDS, Strasbourg, France. The original description of the VizieR service was published in Ochsenbein et al. (2000).
Footnotes
- 7
- 8
- 9
- 10
- 11
IRAF is distributed by NOAO, which is operated by Association of Universities for Research in Astronomy (AURA) under cooperative agreement with the National Science Foundation (NSF): http://iraf.noao.edu/.
- 12
- 13