The occurrence probability of S-bursts within the Io-D/B was misplaced as a function of frequency in Figure 4 of the original paper. The figure with the correct occurrence probabilities is shown below.
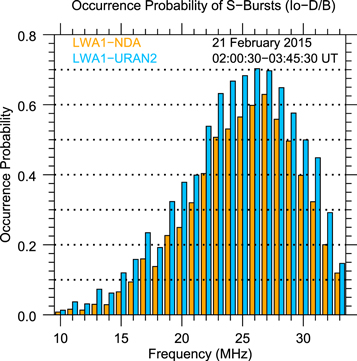
Figure 4. Histogram of occurrence probability of S-bursts within the Io-D/B (i.e., integrated number of occurrences in the surrounded yellow lines of Figure 2 of the original paper) based on the cross-correlation analysis plotted as a function of frequency.
Download figure:
Standard image High-resolution image