Abstract
The number of independent parameters that ultraviolet interstellar extinction curves depend on has never been decisively clarified, yet the issue is critical for the comprehension and modeling of interstellar extinction observations. Cardelli, Clayton, & Mathis (CCM89) concluded that normalized extinction curves rely on only one parameter, but E. Fitzpatrick and others consider this finding at most a first-order approximation favored by uncertainties in measurement. However, the multiparameter fits successively introduced by Fitzpatrick & Massa were intended to give the best possible analytical representation of extinction curves, not to investigate their degrees of freedom. A deeper examination of these fits and of the CCM89 conclusion shows that they do not necessarily conflict. Fitzpatrick & Massa’s parameterization of extinction curves and the large database (nearly 600 directions) published by Krelowski & Strobel are used in this paper to show that, within the precision allowed by the data, E(λ − V) correlates tightly with E(B − V) for all λ within the near-infrared to far-ultraviolet spectrum. This correlation confirms the relationships that led to the CCM89 fit and calls into question the reliability of today’s interstellar dust models, which all need at least seven parameters (reddening included) to fit observed ultraviolet extinction curves.
1. Introduction
The discovery of the ultraviolet part of extinction curves in the 1960s–70s modified the view, justified until then, that the shape of an extinction curve was determined by the quantity of matter on the line of sight alone. This shift prompted the question of how the different parts of an extinction curve were related. Formulated differently, the problem was to know how many degrees of freedom (number of independent parameters) could be attributed to observed interstellar extinction curves. The answer constrains interstellar grain models and beyond that, the whole physics and chemistry of the interstellar medium.
Near-infrared to far-ultraviolet interstellar extinction curves have a well defined shape that is suitable for analytical representation. The first analytical decomposition of ultraviolet extinction curves normalized by the reddening E(B − V) (Fitzpatrick & Massa 1988, FM88 hereafter) led to the conclusion that six parameters were enough to reproduce the curves, consistent with previous investigations on the relationships among the near-ultraviolet extinction, the 2200 Å bump, and the far-ultraviolet rise of extinction curves (Greenberg & Chlewicki 1983, and Sections 2–3).
This scheme was soon shaken by the finding that, allowing for observational errors, normalized extinction Aλ/AV at any near-infrared to far-ultraviolet wavelength is determined by the estimated value of the selective-to-absolute extinction parameter RV = AV/E(B − V) (Cardelli et al. 1988, 1989, CCM88 and CCM89 in the following). CCM89 deduced that interstellar extinction has only two degrees of freedom, the reddening E(B − V) and an unknown—still to be determined and not necessarily RV—parameter (Sections 4–7).
The CCM89 insight into ultraviolet extinction poses a profound difficulty for interstellar extinction theory, because it cannot be justified by any of today’s standard interstellar dust models. The FM88 parameterization of normalized extinction curves may be compatible with traditional multicomponent interstellar dust models, but a one parameter dependency is not. Siebenmorgen et al. (2017) have recently confirmed that any standard extinction model will require at least six parameters (+ E(B − V)), and eight to fulfill cosmic abundance requirements. Interstellar dust models made out of realistic polycyclic aromatic hydrocarbons (PAHs) involve an even larger number of free parameters, no fewer than 225 in Mulas et al. (2013).
The challenge raised by CCM89's findings was barely debated. When they were mentioned, they were dismissed on the ground that they were biased by “sample selection and methodology” (Voshchinnikov 2012). However, the relationship among the different parts of extinction curves has been reaffirmed (Section 5) and the CCM89 fit has been improved over time (Section 8). A two parameter (including reddening) dependency of interstellar extinction curves can thus no longer be dismissed so easily (Section 9).
In this paper, I use the precision achieved by the successive Fitzpatrick & Massa fits to verify, over a large sample of stars, the relationships at the core of CCM89's conclusions, bringing into question the independence of the fits’ parameters (Section 10). The Krelowski & Strobel (2012) database further confirms a near-perfect correlation between E(λ − V) and E(B − V) (λ within the near-infrared to far-ultraviolet spectrum), and therefore the soundness of the CCM89 approach (Section 11). I thus argue that the CCM89 and FM88 fits do not contradict one another and that the relationships that motivated CCM89's conclusions can, today, hardly be disputed.
The question remains of the implications these relationships have for interstellar dust models, as the number of independent parameters ruling interstellar extinction should be far fewer than seven (Section 12). This constraint imposed on dust models should provide a powerful test of their reliability independent of the physics behind the extinction. Overall, the question of how many independent parameters interstellar extinction curves depend on remains a challenge that needs to be addressed (Section 13). The purpose of this article is to bring this issue to the fore.
2. From the Greenberg & Chlewicki (1983) Conception of Ultraviolet Extinction to the Fitzpatrick & Massa (1988) Fit of Extinction Curves
When ultraviolet extinction curves became available, their intriguing shape encouraged their separation into three components (Figure 1): the near-ultraviolet extension of the optical extinction curve, the 2200 Å bump, and a far-ultraviolet rise. This division was felt to correspond to an objective reality, with each part of the curve expressing the extinction law of a specific type of interstellar particle.
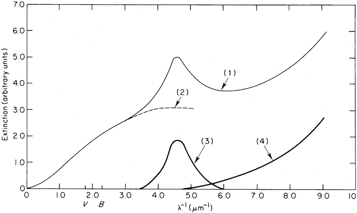
Figure 1. Figure 1 in Greenberg & Chlewicki (1983): “Schematic representation of the mean extinction curve (1). The “visual” portion (2) is the contribution made by classical size particles (radius ∼0.1 μm). The hump (3) and the far-ultraviolet portion (4) are produced by much smaller particles.”
Download figure:
Standard image High-resolution imageInterpretation of the linear extinction (∝λ−p, p ∼ 1) in the visible part of the spectrum is straightforward (see Zagury & Turner 2012). The extinction must arise from dust grains with sizes comparable to the wavelength. Visual extinction curves normalized by E(B − V) all line up for λ > 4400 Å (Figure 14 in Nandy 1964), so that, to a very good approximation, extinction in the visible wavelength range depends only on the quantity of interstellar matter on the line of sight and is fully characterized by the reddening E(B − V). The normalized visible extinction is invariant from one direction to another.
Normalized extinction curves flatten and do not superimpose well in the ground-based accessible near-ultraviolet domain λ < 4400 Å (Figures 14–15 in Nandy 1964). There is less extinction at near-ultraviolet wavelengths than expected from the continuation of the linear optical extinction law toward ultraviolet wavelengths. Savage (1975) and Greenberg & Chlewicki (1983) found a good correlation between the 2200 Å bump strength Abump and E(B − V). Estimated by Abump = Aλ2200−Aλ3320, Abump/E(B − V) remains close to 5 with slight differences from region to region (Savage 1975).
Greenberg & Chlewicki (1983) found no relationship between the far-ultraviolet rise of extinction curves and the extinction at longer wavelengths. Their Figure 4 plots a set of three extinction curves (in addition to the average Seaton curve) normalized to the same level in the near-ultraviolet part of the spectrum (left plot of Figure 2, this paper). Differences appear on the blue side of the bump, and even more in the far-ultraviolet domain. Far-ultraviolet rises maintain a constant functional shape (right plot of Figure 2).
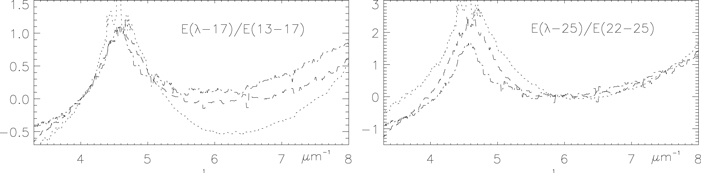
Figure 2. Extinction curves of BD+60°502 (HD 15558, dots), HD 42087 (dashes), and HD 147889 (dashed–dotted line), normalized to the same extinction in the near-ultraviolet (left), and in the far-ultraviolet (right). Left plot demonstrates that one parameter (E(B − V)) alone cannot account for the ultraviolet extinction. Right plot shows that the far-ultraviolet rise keeps the same functional shape (Section 2).
Download figure:
Standard image High-resolution imageDespite the correlation they noted between the 2200 Å bump and the optical extinction, Greenberg & Chlewicki (1983, p. 563) concluded,
“All indications are that the dust grains responsible for the visual, the 2200 Å hump, and the FUV extinction are a trimodal distribution of independent groups of particles.”
Parameters other than E(B − V) are thus necessary to account for the variety of ultraviolet extinction curves. These parameters are supposed to reflect the size distribution of the “large” dust grains (responsible for the extinction at optical wavelengths), the proportion of the 2200 Å bump particles, and the proportion of the particles responsible for the far-ultraviolet rise. In this framework, presumably because of a decline in their size distribution, large grains contribute to the ultraviolet extinction through a nearly constant, or slowly variable, background (dashed line in Figure 1).
Working with this three-component decomposition of extinction curves, FM88 modeled the 2200 Å bump by a Drude profile, D(x = λ−1, γ, λ0−1), and the far-ultraviolet rise at x > 5.9 μm−1 by a polynomial F(x) with degree 4 (F(x) = 0 if x ≤ 5.9 μm−1). Bringing these expressions together with a linear polynomial, called the linear ultraviolet background (Figure 3), FM88 argued that a six-parameter analytical expression could fit all ultraviolet normalized extinction curves:


valid for 3.3 < x < 8.5 μm−1 (3000 > λ > 1700 Å).
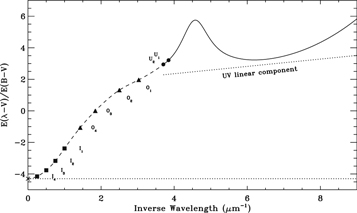
Figure 3. Figure 2 in Fitzpatrick & Massa (2005). The whole extinction curve and the linear ultraviolet background (dots). The bottom dotted line sets the limit of the extinction when  and determines the value of RV (Equation (2)). Optical and infrared photometric bands are indicated.
Download figure:
Standard image High-resolution imageParameter c1 typically ranges from −2 to 2, c2 from −0.2 to 1.4, c3 from 1 to 5, γ from 0.8 to 1.2, and c4 from 0 to 1 (Figures 4–7 in FM88).
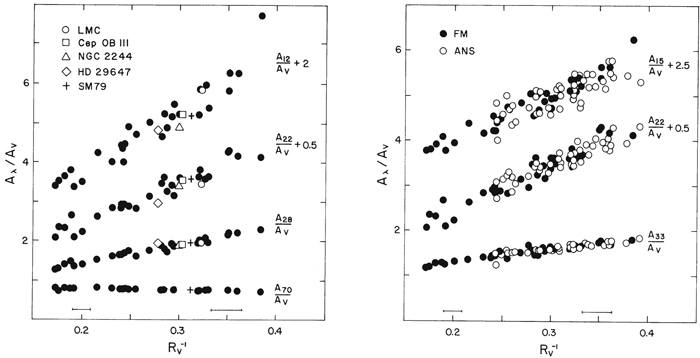
Figure 4. Figure 1 in CCM89. For several wavelengths Aλ/AV is plotted against 1/RV. See CCM89 for details. Mishra & Li (2017, Figure 13) checked the relationships on similar plots for a sample of 46 stars. Bondar et al. (2006, Figure 3) found equivalent relationships in the form of two color diagrams E(λ − V) vs. E(B − V) in the directions of 22 B1V stars.
Download figure:
Standard image High-resolution imageThe far-ultraviolet function F(x) was later simplified and the fit was refined, but at the cost of an additional parameter, c5 (Fitzpatrick & Massa 2007, FM07):

In practice c5 is always larger than x = 5.9, the limit that was set for the previous F(x) function not to be null. The far-ultraviolet normalized extinction now depends on two parameters, and normalized ultraviolet extinction curves on seven parameters.
The large FM07 database gives the fit’s seven parameters, plus two additional ones for the near-infrared/visible spectrum (see the next section), for 328 E(λ − V)/E(B − V) normalized extinction curves. This database, available on Vizier’s website,1 enables a reconstruction of each original normalized extinction curve.
3. The Fitzpatrick & Massa (2005) Extension of the FM88 Fit to the Optical/Near-infrared Spectrum
The linear ultraviolet background is clearly related to the continuation of the optical extinction law into the ultraviolet spectrum, and may stand for the flattening of the extinction by interstellar dust grains, although Fitzpatrick & Massa (2005; FM05) warn against any physical interpretation of the fit. The linear visual extinction and the linear ultraviolet background join up at the so-called near-ultraviolet knee (Figure 1 in Fitzpatrick 1999), around x = 2.25 μm−1, λ = 4400 Å. On a E(λ − V)/E(B − V) versus x = 1/λ plot the ultraviolet linear background passes under the bump (Figures 1 and 3). The linear visual extinction protracted in the ultraviolet passes above the near-ultraviolet part of an extinction curve and falls close to the top of the bump on the mean extinction curve.
Some extinction curves have little or no bump, as if the linear visual extinction continued in the ultraviolet to the bump region and sometimes over the whole ultraviolet spectrum. This happens for very low column density directions and stars with circumstellar dust, and relatively frequently for Magellanic Cloud stars (Zagury 2007). In the corresponding clouds there should be no interruption of the dust size distribution law, and the ultraviolet background should coincide with the extension of the linear optical extinction law in the ultraviolet up to the bump region or beyond.
FM05 extended the FM function (Equation (3)) to the visual and near-infrared spectrum:

for x < 3.7 μm−1 (λ > 2700 Å). This extension requires two additional free parameters, RV and kIR.
4. The CCM88–CCM89 Approach to Interstellar Extinction Observations
Instead of segmenting extinction curves in three and seeking to give an analytical representation of each segment taken individually, as Greenberg & Chlewicki (1983) and FM88 had done, CCM88/CCM89 explored the possibility of connections between extinctions at different wavelengths. Their aim was to see whether they could predict “the extinction of one spectral region from observations in the other” (CCM88). Parameter RV, which CCM89 extrapolated for the subset of FM88's observations for which near-infrared extinction data could be obtained, provided the link for this search.
Despite the uncertainties involved, the results exceeded expectations. They are summarized by Figures 1 and 2 in CCM89 (Figure 4, this paper), which show that at any wavelength Aλ/AV correlates linearly with 1/RV.
The implication of the Aλ/AV versus 1/RV relationships is that the normalized extinctions at any two wavelengths taken between the near-infrared and the far-ultraviolet are tightly related. In the words of CCM89 (p. 253),
“in the real ISM the processes which modify the extinction at one wavelength also seem to modify the entire mean extinction law in a regular way.”
5. Checks of the CCM89 Aλ/AV versus 1/RV Relationships
CCM89's methodology was recently applied to a sample of 46 Galactic sight-lines and led to the same conclusion that Aλ/AV versus 1/RV plots follow a linear relationship (Figure 13 in Mishra & Li 2017). Although Mishra & Li worked in a classical Greenberg & Chlewicki (1983)–FM88 framework, they acknowledge that “the extinction at any wavelength from the optical to the far-UV correlates with 1/RV, consistent with the earlier findings of Cardelli et al. (1989).” They also state that “in the ISM the processes that modify the extinction at one wavelength... must also modify the extinction over the entire wavelength range...” (Mishra & Li 2017).
Bondar et al. (2006) compared E(λ − V) and E(B − V) for a sample of 20 stars of the same spectral type and for several near-infrared, visible, and ultraviolet wavelengths obtained from photometric observations.2 The procedure they used was equivalent to CCM89's search but avoided the difficulty of determining RV and absolute magnitudes, and the resulting additional inaccuracy. The authors found near-perfect linear correlations between E(λ − V) and E(B − V), for all wavelengths (their Figure 3). The Bondar et al. (2006) results were generalized and confirmed (see Section 11) on a much larger set of over 560 stars in Krelowski & Strobel (2012).
6. The CCM89 One-parameter Fit for Normalized Interstellar Extinction Curves
CCM89 attempted to summarize the relationships shown in Figure 4 in a single formula involving two functions of x = 1/λ alone, a(x) and b(x):

The equation holds over the whole near-infrared to far-ultraviolet spectrum.
The CCM89 fit given by Equation (6) has no more physical meaning than the FM88 fit. Concerning its ability to represent observed extinction curves, CCM89 (p. 252) concluded:
“the entire mean extinction law, from the near-IR through the optical and IUE-accessible ultraviolet, can be well represented by a mean relationship (Equation (6)) which depends upon a single parameter. ... the deviations of the observations from the mean relation are impressively small ...”
Figure 5 applies the CCM89 fit to the normalized extinction curves of BD+60°502 (HD 15558) and HD 42087 that Greenberg & Chlewicki (1983) used to justify the partition of extinction curves (Section 2 and Figure 2). For the application of an empirical formula the fits are more than satisfactory. Most directions, though not all, are represented equally well with the CCM89 fit. Equation (6) does not fit the extinction curve of the third star of the sample (HD 147889) as well as the others. This curve, with its very deep 2200 Å bump and a slow far-ultraviolet rise, is regarded as “highly anomalous” (Greenberg & Chlewicki 1983; Valencic et al. 2004, and references therein). Other extinction curves for which Equation (6) systematically fails are extinction curves with no 2200 Å bump (Section 8.2).
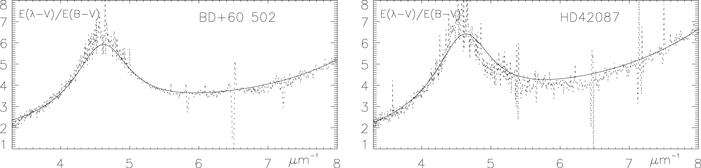
Figure 5. Best CCM89 fits for the ultraviolet extinction curves of the two stars, BD+60°502 (HD 15558) and HD 42087, chosen as examples in Greenberg & Chlewicki (1983). Parameter RV equals 4.2 for BD+60°502 (E(B − V) = 0.84) and 3.3 for HD 42087 (E(B − V) = 0.36).
Download figure:
Standard image High-resolution image7. Note on the RV Parameter of Equation (6)
Entering successively xB = 2.27 μm−1 and xV = 1.82 μm−1 in Equation (6) leads to a constant RV (=1.42, independent of the direction of observation, Zagury 2012), in manifest contradiction with its supposed variable nature.
A similar problem is encountered with the FM05 fit of optical extinction curves. Equation (5) leads to two equations that should be satisfied for all directions:


They imply


for all directions.
The optical parts of the CCM89 or FM fits also introduce slight nuances in the extinction curve for λ > 4400 Å that do not seem to be needed (Section 2), and do not even correspond in the CCM89 and FM parameterizations (they use a different power law for x = 1/λ).
In addition, the optimized RV value that can be derived from fitting an extinction curve with Equation (6) only roughly agrees with its infrared determination. For HD 42087 Valencic et al. (2004) find RV = 3.16 ± 0.45 from near-infrared extinction measurements, while a best fit with Equation (6) favors RV ≃ 3.6 (Figure 5). The extinction curve of HD 204827 cannot be fitted with Equation (6) (Valencic et al. 2004) but is reproduced accurately with the improved Zagury (2007) fit (Section 8.2) and RV = 3; for this direction and from infrared photometry FM07 and Valencic et al. (2004) find, respectively, RV = 2.44 ± 0.05 and RV = 2.58 ± 0.09.
For these reasons it might be preferable to restrict the CCM89 and FM fits to the ultraviolet spectrum, for which they were conceived and where they are needed. Parameter RV in Equation (6) can then be considered as adjustable and devoid of physical meaning, as CCM89 (p. 253) had anticipated:
“We have chosen to use RV for convenience, but it has no particular physical significance. No doubt other well-observed quantities similarly defined could have served in its stead.”
This restriction does not affect FM88's Equation (3), in which RV plays no part.
8. Improvements to the CCM89 Fit
8.1. O’Donnell (1994) and Valencic et al. (2004)
O’Donnell (1994) improved the CCM89 fit in the near-ultraviolet 2.25–3.33 μm−1 (3000–4400 Å) region with higher order polynomials a(x) and b(x). He concluded that “the deviations of individual extinction curves from the mean [RV-dependent extinction curve] are dominated by observational errors.”
A similar conclusion was reached by Valencic et al. (2004), who compared the FM88 and the CCM89 fits over the whole spectrum for 417 directions. Their main results are that the one-parameter (slightly improved) CCM89 function “accurately describes the diffuse Galactic ISM in virtually all cases [93%],” and that the CCM89 and FM88 fits remain within 5% of each other.
8.2. The Problem of the 2200 Å Bump
A weakness of CCM89-like RV-dependent fits lies in the one-to-one correspondence they establish between the 2200 Å bump and E(B − V) (no bump implies E(B − V) = 0). This correspondence conflicts with true variations of Abump/E(B − V) (Section 2). It also means that CCM89-like fits only apply to curves with a bump, whereas the existence of extinction curves that are linear to the bump region and sometimes over the full ultraviolet spectrum, as in the Magellanic Clouds, is well documented (Section 3).
This weakness can in part be overcome if the extinction in any direction is separated into a CCM89-like component and a component that is linear over the whole ultraviolet spectrum (Zagury 2007). CCM89-like extinction curves are most common in the Galaxy, whereas the linear extinction component appears more obviously in the Magellanic Clouds.
The resulting fit does not increase the number of independent parameters. It clearly encompasses the Valencic et al. (2004) directions, being even more precise, and now includes extinction curves that are linear over the whole spectrum. The peculiar extinction curve of HD 204827, which resembles Magellanic extinction curves and deviates from Equation (6) (Savage et al. 1985; Valencic et al. 2004), can be well reproduced with this extension of the CCM89 fit (Figure 9 in Zagury 2007).
Two key implications follow: Magellanic and Galactic extinctions are essentially the same; and the normalization process (by E(B − V) or AV), blindly applied in FM88 and in CCM89, is questionable. If two types of extinction can be distinguished on the same line of sight, normalization by the total quantity of matter on the line of sight works only insofar as one or the other type dominates.
9. Misinterpretations of CCM89
As noted in Section 5, over the past 30 years the CCM89 relationships have been verified by different groups working with larger databases (see also Section 11). In Section 8, improved one-parameter fits have been shown to rival in precision with the multiparameter FM fits. Yet no attempt has been made to understand the significance of these achievements. Instead some authors simply deny the relationships shown in Figure 4, while others have sought to present CCM89 as an extension of Fitzpatrick & Massa’s work.
According to E. Fitzpatrick for instance,
“The essence of the CCM89 result is two correlations [between the coefficients of the linear background and 1/RV] involving the coefficients of the FM90 fitting function originally used to parameterize the extinction curves studied in CCM ...” (Fitzpatrick 1999, p. 66).
The textbook published by Draine (2011) likewise states that the CCM89 fit was obtained through transformations of the FM88 fit parameters. Both scholars suggest that the origin of the CCM88/CCM89 work is to be found in Fitzpatrick & Massa’s analysis of extinction curves. However, only CCM89’s departure in approach (see Section 4) enabled the discovery of the relationships demonstrated in Figure 4 and their approximate representation by Equation (6).
In Section 6.4 of FM07 (p. 337), the relationships highlighted in CCM89 are treated as the result of an interplay of errors inherent in CCM89's methodology. According to FM07 (p. 337), the errors all run in the same direction, yielding the impression of correlations where there are none:
“In the time since the original work, the perception of this [CCM89] relationship has evolved to the point where it is often referred as a “law,” and Galactic [normalized] extinction curves are often stated or assumed to be a one-parameter family (with R(V)−1 as the parameter). Recently, for example, Valencic et al. (2004) found that 93% of a large sample of Galactic extinction curves obey a modified form of this relation. In this section, we will show that the relationship in Equation (9) (Equation (6)) is partially illusory and that Galactic extinction curves are decidedly not a one-parameter family in R(V)−1. ... Ironically, because of the normalization and the resultant error correlations, the appearance of correlations in Figure 18 [Figure 7, this paper] is actually enhanced by uncertainties in R(V). ... Although there is a relationship in the sense that large-R(V) curves (i.e., R(V) ≥ 4.0) differ systematically from low-R(V) curves, UV extinction properties cannot be expressed as a one-parameter family in R(V) at anywhere near the level of observational accuracy.”
Neither the CCM89 nor the FM88 fits are laws: they are empirical functions with no physical meaning. The view, suggested in the first sentence of this quotation, that CCM89 did not grasp the significance of their findings is not acceptable (see Sections 4 and 6). The relationships they discovered and the one-parameter dependency of normalized extinction curves they deduced are not only strongly affirmed as facts in CCM89, they constitute a major result and a key contribution to the study of interstellar extinction.
The CCM89 correlations mentioned next in the quotation, which have already been verified independently (Section 5), can in fact be tested on a large sample of stars from FM07's own database. For all ultraviolet wavelengths, extinction curves reconstructed from the database parameters (x0, γ, c1−c5) follow the linear E(λ − V) versus E(B − V) correlations of Bondar et al. (2006, Figure 6). The correlations are also manifest on Aλ/AV versus 1/RV plots (Figure 7), although with more dispersion because of the additional uncertainties on RV and on absolute magnitudes. As in any scientific context, the effect of these uncertainties is to blur the correlations and not to enhance them, contrary to what the quotation suggests (Figure 7 corresponds to Figure 18 in FM07).
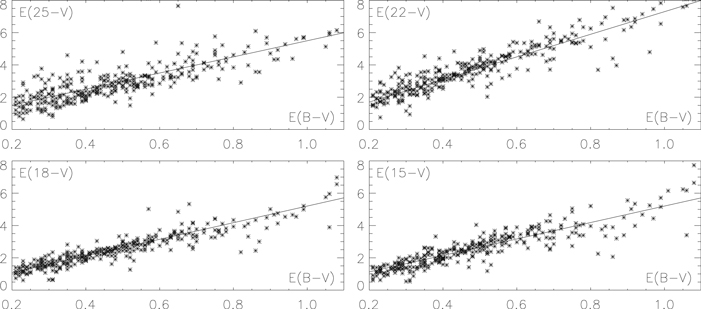
Figure 6. E(λ − V) (λ = 2500, 2200, 1800, 1500 Å) vs. E(B − V) for the 328 directions of the FM07 database. The FM07 fit stands in place of the observed ultraviolet extinction curves and provides E(λ − V). Correlations are especially tight for λ = 1800 and 1500 Å at not too high a reddening. Departures from a mean relationship increase in the bump region (two top plots, λ = 2500 and 2200 Å) and for E(B − V) > 0.8 mag, that is when the extinction is high (see Section 11).
Download figure:
Standard image High-resolution image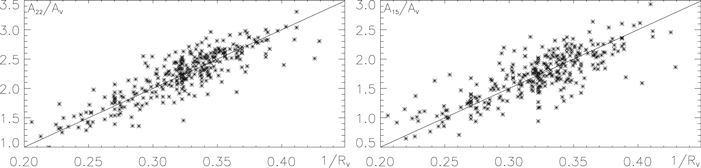
Figure 7. Aλ/AV vs. 1/RV for λ = 2200, 1500 Å, from FM07 data. Introduction of AV and RV calls for another set of near-infrared/visible data, which increases the error margin and the scatter on the plots compared to Figure 6.
Download figure:
Standard image High-resolution image“That Galactic [normalized] extinction curves are decidedly not a one-parameter family in R(V)−1” or that the “UV extinction properties cannot be expressed as a one-parameter family in R(V) at anywhere near the level of observational accuracy” are therefore unsupported statements. They also contradict the acknowledgment, in the same quotation, that “Valencic et al. (2004) found that 93% of a large sample of Galactic extinction curves obey a modified form” of the CCM89 relationship. Further, Figure 5 shows that for the ultraviolet spectrum the CCM89 fit comes very close to the “level of observational accuracy.”
What can be retained from Fitzpatrick & Massa’s criticism is the point that RV may not be the appropriate free parameter of normalized extinction curves, an issue that CCM89 recognized (see Section 7).
10. Relationships Between the FM Fit Parameters: From the FM Fit to CCM89's Conclusion
As the second quotation of Section 9 recalls, the only information a one-to-one comparison of the FM07 parameters seems to capture is that large-RV curves differ systematically from low-RV curves. This result is poor, considering the tight constraints the CCM89 relationships, verified by FM07's own data, impose on extinction curves.
The general purpose of the successive FM fits was never to investigate the degrees of freedom of interstellar extinction curves, but to reproduce as closely as possible normalized observed interstellar extinction curves according to an arbitrary analytical scheme.3 Fitzpatrick & Massa did not limit the number of parameters, which can be eight in FM05 or nine in FM07. The resulting fits are flexible, capable of absorbing even uncertainties on the curves,4 which a one-parameter fit cannot do so easily.
Relationships among the parameters nevertheless exist. Ultraviolet linear background coefficients c1 and c2, correlate extremely well (Figure 4 in FM88, Figure 13 in FM07). They satisfy c1 ∼ −3c2 + 2.04 in the first Fitzpatrick & Massa fit and a slightly different relationship in the last FM07 version. To a much lesser extent, Figure 5 in Fitzpatrick (1999) shows some correlation between c2 and  .
.
Whether the variations in the bump’s central value x0 = 4.6 μm−1 are real or a consequence of the fit’s presupposed assumptions on the decomposition of the curves is also unclear. Valencic et al. (2004) found no reason to question the constancy of x0.
These relations are the only immediate properties the FM88–FM07 parameters exhibit. Trends, such as c3 with γ and c4, are also documented in FM88 [Figure 6] but are judged “ill-defined—although, I believe, undoubtedly real” by Fitzpatrick (2004). How trends can be “ill-defined” but “undoubtedly real” is, mathematically speaking, unclear.
A more sophisticated relationship between the FM88 coefficients can be deduced from CCM89's Figure 8 comparison of the theoretical value of the strength of the 2200 Å bump above the linear ultraviolet background, c3/γ2, and an estimated value E(22 − V)/E(B − V) − 0.5E(15 − V)/E(B − V) − 0.62. Figure 8 verifies this relationship for the 328 reconstructed extinction curves of the FM07 sample. The plot expresses a tight correlation between c3/γ2 and  , that is, between the different parameters of the fit.
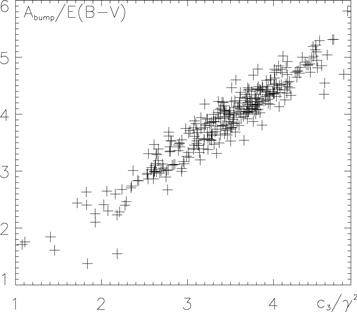
Figure 8. Verification of the relationship that CCM89 found between c3/γ2 and the strength of the bump, Abump = FM(x0) − FM(6.67)/2.
Download figure:
Standard image High-resolution imageSimilar nontrivial links between the FM07 coefficients can be expected from the plots of Figure 6, which can be repeated at any ultraviolet wavelength. It follows that the FM07 parameters comply with relationships that deny the lack of apparent correlations between them.
The plots of Figure 6 suggest that the extinction at any two wavelengths taken from the optical5 to the far-ultraviolet spectrum correlate. For a given AV, a variation of the extinction at any ultraviolet wavelength modifies the extinction at all other wavelengths, thus the entire ultraviolet extinction curve. This was the substance of CCM89's conclusion. In short, the parameterization introduced by FM88 ends up giving weight to CCM89's major claim.
11. The 2012 Krelowski & Strobel Database
To avoid any possible doubt on the implication of Figure 6 and the soundness of the CCM89 relationships, Figure 9 reproduces the same plots as in Figure 6 but from the Krelowski & Strobel (2012) photometric database.6 This database, already mentioned in the Introduction and in Section 5, includes the photometric magnitudes of over 560 stars (3/4 more directions than in the FM07 sample) distributed among six spectral types, in the five ultraviolet bands (λλ1500, 1800, 2200, 2500, 3300 Å) of the Astronomical Netherlands Satellite in the B and V optical bands, and in the J, H, K Two Micron All Sky Survey (2MASS) infrared bands. Figure 9 combines E(λ − V) versus E(B − V) for the six spectral types, yielding final E(λ − V) versus E(B − V) plots for the whole data set and for the same four ultraviolet wavelengths as in Figure 6.
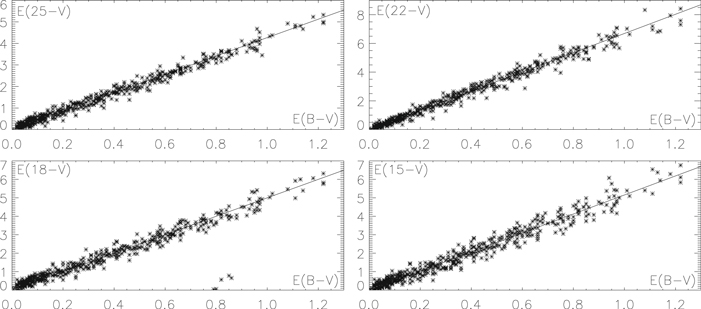
Figure 9. Same as Figure 6 but with the ∼560 directions of the Krelowski & Strobel (2012) database, all spectral types (O9V, B0V, B1V, B1Ve, B2V, and B3V) included. For each spectral type, E(B − V) values were deduced from the spectral type’s (B − V)0 color. For a given spectral type, the E(λ − V) vs. E(B − V) plot was then obtained by shifting vertically the linear λ − V vs. E(B − V) relationship in such a way that E(λ − V) = 0 when E(B − V) = 0. The plots, with 75% more data-points than FM07, confirm with even greater precision Figure 6's relationships and the connection among the extinction at different wavelengths, from the near-infrared (Figure 10) to the far-ultraviolet, that CCM89 argued for. Further comparison with Figure 6 confirms that the larger-than-average scatter from the mean in the bump region and at high reddening on Figure 6's plots is due to uncertainties. The plots show no evidence for the Krelowski & Strodel claim that 25% of the directions have a peculiar extinction.
Download figure:
Standard image High-resolution imageFigure 9 supports with even better precision what Figure 6 anticipated and again confirms the reliability of CCM89's relationships (Figure 4) for the ultraviolet wavelengths. Analogous plots for the J, H, K 2MASS bands verify similar relationships for the near-infrared spectrum for the same large sample of stars (Figure 10). These—already impressive—correlations could be improved by a star by star analysis, as Bondar et al. (2006) have done. This could justify five particularly discrepant directions (HD 198331, HD 230579, HD 250163, HD 251726, and HD 259597) in the E(18 − V) plot.
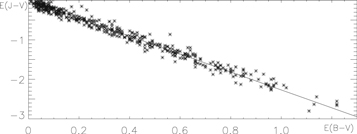
Figure 10. Correlation between E(B − V) and the infrared (J, H, K) bands of the Krelowski & Strobel (2012) data set. Only the E(J − V) vs. E(B − V) plot is represented here, the H and K band plots being similar. The infrared extinction correlates well with E(B − V), and therefore with the extinction in the ultraviolet (Figure 9). FM07's assertion that “the UV and IR portions of Galactic extinction curves are not correlated with each other” is thus unfounded.
Download figure:
Standard image High-resolution imageFigure 9 also confirms that the scatter of points observed on the plots of Figure 6 at high reddening (E(B − V) > 0.8 mag) or in the bump region (E(25 − V) and E(22 − V) plots), which both correspond to enhanced extinction and thus lower precision, are most likely due to the addition of error margins from the data and from the replacement of the observed extinction curves by the FM07 fits.
From a limited subset of the data used in Figure 9, Bondar et al. (2006) concluded that “the small scatter seen in our two-color diagrams reveals that the extinction law does not change at least in the radius of about 2 kpc.” In contrast, the Krelowski & Strobel (2012) discussion that follows their own analyses of the whole data set is confusing. On the one hand, like Bondar et al. (2006) the authors acknowledge the strong homogeneity of interstellar extinction observations, while, on the other hand, from considerations that are not related to the database (the shape of a few extinction curves in so-called σ- and ζ-clouds), they conclude that some 25% of extinction curves should be peculiar.
But sure enough, these 25% of directions thought to deviate from the mean do not show up at any level of significance on Figures 9 and 10. As to their stated intention to reconcile their results with FM07, Krelowski & Strobel manifestly misunderstand Fitzpatrick & Massa’s approach to interstellar extinction observations. As discussed in Section 9, and as is clear from the very beginning of FM07,7 Fitzpatrick & Massa argue for a high degree of spatial variability of interstellar extinction and deny correlations among the extinction in different wavelength ranges. This is obviously not the conclusions that Krelowski & Strobel (and Bondar et al. 2006) have reached from their data.
Even though a normalized extinction curve may strongly differ from the mean Galactic extinction curve because of a steep far-ultraviolet rise or an abnormally weak bump, the extinction curve will nevertheless follow the same E(λ − V) versus E(B − V) relationships as other directions. To put it differently, some directions can strongly depart from an average extinction law that depends on the reddening only, but still comply with the two-parameter dependency of the extinction suggested by Figures 6, 9, and 10, and claimed in the first place by CCM89.
12. Consequences of Figures 6, 9, and 10 for Interstellar Dust Modeling
12.1. Mathematical Insight
In mathematical terms ultraviolet extinction curves can be assimilated to a set of functions which, according to FM88/FM07, can be generated using eight parameters at most (E(B − V) included). In other words they are included in a space of finite dimension less than or equal to eight. Mathematically this implies that any other generic analytical representation of the curves, such as those provided by interstellar dust models, must involve at most eight independent parameters. If it is agreed that Figures 6 and 9 demonstrate the CCM89 claim that ultraviolet extinction curves depend on a single parameter in addition to E(B − V), this number drops to two. The dimension of the space generated by ultraviolet extinction curves is then two: a physical model that intends to reproduce interstellar extinction curves should be able to reduce its number of free parameters to E(B − V) and a single additional parameter.
The number of free parameters an interstellar dust model introduces should fall between two and eight, depending on the significance given to Figures 6, 9 and 10.
12.2. Constraints on Interstellar Dust Models Imposed by the Number of Free Parameters Ruling Interstellar Extinction Curves
It follows that the number of free parameters used in an interstellar dust model is an indication of the model’s reliability. The 225 independent parameters required by the Mulas et al. (2013) PAH-model for instance, makes the model, in its original state, improbable. The authors mentioned that this number should eventually be reduced, but no progress has yet been made in that direction.
Most models that consider optical/ultraviolet extinction curves as the superposition of several extinction laws are constructed on the basis of seven parameters, in agreement with FM88. These models generally limit the size distribution of large interstellar grains (e.g., silicates) toward the short sizes in order to account for the flattening of the extinction in the near-ultraviolet. They introduce carbonaceous particles such as PAHs and/or small silicates for the 2200 Å bump and for the far-ultraviolet rise (Désert et al. 1990; Mishra & Li 2017; Siebenmorgen et al. 2017).
A dependency among these various model-dependent parameters is difficult to accept on physical grounds. It is, for instance, hardly conceivable that the lower limit of the size distribution of large silicates governs, along with E(B − V), the proportion of silicates and of PAHs. However, since these models provide excellent fits for observed extinction curves, they also comply with the relationships exemplified by Figures 6 and 9. Their parameters are thus likely to be related to some degree. The question arises of whether and how this can be. Mishra & Li (2017) acknowledge the CCM89 relationships (see Section 5) as a fact but draw no inferences from these relationships for their seven (E(B − V) included) free parameter interstellar dust model.
No model has yet dealt with and been able to resolve this ambiguity between theory and observation. The number of free parameters of observed extinction curves should constrain the foundation of a model and, regardless of the physics behind the extinction, provide a powerful test for its credibility.
13. Conclusion
The quantity of matter on the line of sight, quantified by the reddening E(B − V), is not enough to account for the observed variations of ultraviolet extinction curves. With one additional free parameter only, CCM89-like fits of ultraviolet extinction curves are reasonably accurate in most circumstances. These fits raise important questions about several aspects of interstellar extinction curves: the relationship between the extinction in different parts of the spectrum; the relevance of normalizing extinction curves (Section 8); the exact nature of the free parameter that, along with E(B − V), may rule the shape of extinction curves; and how this can occur. They also suggest that Galactic and Magellanic extinction laws are identical. The primary reason for failures or imprecisions of one-parameter fits of normalized extinction curves can be assumed to arise from their empirical nature.
The FM88 fit is basically a by-product of the Greenberg & Chlewicki (1983) three-modal decomposition of extinction curves. The FM88/FM07 fits succeed remarkably in fitting the curves under such a decomposition scheme, but they do not have the same informative power as the CCM89 representation (in particular, regarding the degrees of freedom of observed extinction curves). The difference is that between a preconceived idea of how ultraviolet observations should be interpreted, as represented by Greenberg & Chlewicki’s Figure 1 (here Figure 1), and the pragmatic search for links among the extinctions in different parts of the spectrum that CCM89's Figure 1 (Figure 4) was first to illustrate.
As I have shown, the FM07 database can be used to validate the CCM88/CCM89 relationships over a large sample of extinction curves (Figure 6). The FM07 claim that extinctions at different wavelengths do not correlate is thus, today, not acceptable. It is manifestly contradicted by the authors’ own work and is discredited by the larger and more accurate 2012 data set of Krelowski & Strobel (Figures 9 and 10).
The Bondar et al. (2006) and Krelowski & Strobel (2012) correlation plots, here illustrated by Figures 9 and 10, provide a simple and elegant demonstration that knowledge of the extinction at two wavelengths, as provided for instance by AV and E(B − V), determines the extinction at all wavelengths within the near-infrared to the far-ultraviolet spectrum. Whatever the level of confidence one has in these relationships, the number of independent parameters needed to reproduce observed interstellar extinction curves should be closer to two than it is to seven.
None of the existing interstellar dust models based on a decomposition of extinction curves similar to that proposed in Greenberg & Chlewicki (1983) use fewer than seven physical parameters (including E(B − V)). Up to now these models have either ignored or been unable to integrate and justify the correlations among the extinctions at all wavelengths.
The number and nature of the independent parameters that rule interstellar extinction curves thus appear to be fundamental issues for the reliability of interstellar dust models. In particular, the number of independent parameters provides constraints on models that do not depend on the physics behind the extinction of starlight. These issues should have a central place in any further discussion of interstellar extinction and interstellar dust models.
I thank the anonymous referee for helpful comments and suggestions.
This research has made use of the VizieR catalog access tool, CDS, Strasbourg, France (doi:10.26093/cds/vizier).
Footnotes
- 1
http://vizier.u-strasbg.fr/viz-bin/VizieR, J/ApJ/663/320.
- 2
Since the stars are of the same spectral type, the authors used mλ − mV and
 instead of E(λ − V) and E(B − V). A linear relationship between E(λ − V) and E(B − V) implies that Aλ/AV also depends linearly on 1/RV.
 - 3
As noted in FM88, p. 744, “[u]nfortunately, all analyses like the one presented here are necessarily ambiguous and strongly depend upon the adopted set of fitting functions.”
- 4
Atomic absorption lines in the bump region, the scaling between the LWR/LWP and SWP IUE data, and a slight reddening of the reference star, can all substantially modify the appearance of an extinction curve.
- 5
E(B − V) determines the optical extinction (Section 2).
- 6
Available at https://vizier.u-strasbg.fr/viz-bin/VizieR-4, J/AN/333/60.
- 7
The abstract of FM07 advances the following claims: “the UV and IR portions of Galactic extinction curves are not correlated with each other”; and “...the observed large sight line-to-sight line variations, and the lack of correlation among the various features of the curves, make it difficult to meaningfully characterize average extinction properties...” Concerning the alleged absence of any correlation between the UV and IR portions of extinction curves, see Figure 10.