Abstract
We present 2MASS J11151597+1937266, a recently identified low-surface-gravity L dwarf, classified as an L2γ based on Sloan Digital Sky Survey optical spectroscopy. We confirm this spectral type with near-infrared spectroscopy, which provides further evidence that 2MASS J11151597+1937266 is a low-surface-gravity L dwarf. This object also shows significant excess mid-infrared flux, indicative of circumstellar material; and its strong Hα emission (EWHα = 560 ± 82 Å) is an indicator of enhanced magnetic activity or weak accretion. Comparison of its spectral energy distribution to model photospheres yields an effective temperature of  . We also provide a revised distance estimate of 37 ± 6 pc using a spectral type–luminosity relationship for low-surface-gravity objects. The three-dimensional galactic velocities and positions of 2MASS J11151597+1937266 do not match any known young association or moving group. Assuming a probable age in the range of 5–45 Myr, the model-dependent estimated mass of this object is between 7 and 21 MJup, making it a potentially isolated planetary-mass object. We also identify a candidate co-moving, young stellar companion, 2MASS J11131089+2110086.
1. Introduction
Young associations, such as nearby young moving groups (NYMGs) and open clusters, provide important benchmarks for testing stellar and brown dwarf evolutionary models (Zuckerman & Song 2004). There are a growing number of low-mass stars and brown dwarfs that show signatures of low surface gravity and youth (ages <100 Myr), but are not associated with any currently known groups of young objects (e.g., Gagné et al. 2015). These very-low-mass isolated objects are challenging to characterize due to the difficulty in precisely constraining their ages, a necessary step to break the mass-age-temperature degeneracy for brown dwarfs. They may indicate new associations still awaiting discovery, or evidence of brown dwarf ejection from clusters (Boss 2001; Hoogerwerf et al. 2001; Reipurth & Clarke 2001; Bate et al. 2002).
Theissen et al. (2017) recently identified 2MASS J11151597+1937266 (hereafter 2MASS J1115+1937) in the Late-Type Extension to the Motion Verified Red Stars catalog (LaTE-MoVeRS) as a very-low-mass, ultracool object (spectral type L2; Teff ≈ 1700 K), with signatures of either accretion or a flaring event based on strong H and He optical line emission. 2MASS J1115+1937 also shows significant excess mid-infrared (MIR) flux, which may be indicative of primordial circumstellar material (e.g., Faherty et al. 2013). In this study, we present evidence that 2MASS J1115+1937 is likely a young (≲45 Myr), potentially planetary-mass object (≲13 MJup), whose kinematics are inconsistent with any known young association. We also discuss a candidate co-moving stellar companion that also shows signatures of youth, 2MASS J11131089+2110086 (hereafter 2MASS J1113+2110).
2. Characterization of 2MASS J1115+1937
2.1. Spectral Typing
Theissen et al. (2017) used the optical spectrum from the Sloan Digital Sky Survey (SDSS; York et al. 2000) Baryon Oscillation Spectroscopic Survey (BOSS; Dawson et al. 2013) to spectrally type 2MASS J1115+1937 as L2 (see Figure 1 below and Figure 14 from Theissen et al. 2017). However, the significant veiling in the continuum, possibly due to accretion (White & Basri 2003) or a flaring event (Kowalski et al. 2013), made optical spectral typing difficult. The best visual match to the optical spectrum was found to be the low-surface-gravity L2 dwarf 2MASS J23225299−6151275 (Cruz et al. 2009), particularly at the redder end of the spectrum (>8000 Å). We measured a radial velocity (RV) for 2MASS J1115+1937 of −14 ± 7 km s−1 by simultaneously fitting Gaussian functions to all of the hydrogen lines with a Markov Chain Monte Carlo method built using the emcee code (Foreman-Mackey et al. 2013).
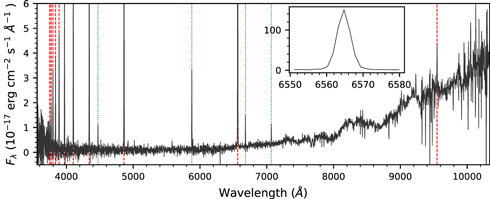
Figure 1. SDSS spectrum of 2MASS J1115+1937. The red dashed lines denote hydrogen transitions, and the green dotted lines denote helium transitions. The y-scale has been truncated to show more spectral features, thus clipping many of the hydrogen emission lines. The inset plot shows the Hα emission line.
Download figure:
Standard image High-resolution imageWe obtained a low-resolution near-infrared (NIR) spectrum of 2MASS J1115+1937 using the prism-dispersed mode of the SpeX spectrograph (Rayner et al. 2003) on the NASA Infrared Research Telescope Facility (IRTF) on 2017 May 6 (UT). Using the 05 slit, we obtained spectra with a resolution of ≈120 over a wavelength range of 0.8–2.5 μm. The SpeX data were reduced using the SpeXtool package (Vacca et al. 2003; Cushing et al. 2004) following standard procedures. The resulting spectrum was analyzed using the SpeX Prism Library Analysis Toolkit8
(SPLAT; Burgasser & the SPLAT Development Team 2017) and spectral templates from the SpeX Prism Library (SPL; Burgasser 2014).
Figure 2 shows the best-fit comparisons to spectral standards among field dwarfs, intermediate surface gravity dwarfs (β), very-low-surface-gravity dwarfs (γ), and extremely-low-surface gravity dwarfs (δ), proposed in Kirkpatrick (2005) with templates defined in Cruz et al. (2009). These gravity classifications, β, γ, and δ, roughly coincide with  ranges of 4–4.5, 3.5–4, and 3–3.5 (cgs), respectively, although Allers & Liu (2013), Gagné et al. (2015), and Martin et al. (2017) have shown that gravity classifications have considerable scatter with respect to cluster ages, which in turn impacts the parameters inferred from model atmosphere fits. These gravity classifications are useful only as relative measures of age/gravity within a spectral type.
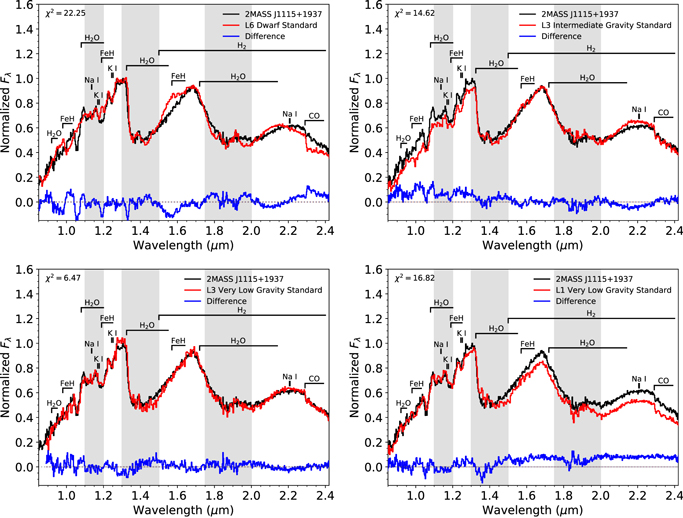
Figure 2. Comparisons between 2MASS J1115+1937 (black lines) and the best-fit spectral standards at various gravities (red lines). The difference spectra are shown in blue. The gray dotted horizontal line indicates a difference of zero. The gray shaded areas indicate telluric regions, and absorption features are labeled. Top left: comparison to the L6 (field gravity) standard 2MASS J1010148−0406499 (data from Reid et al. 2006). Top right: comparison to the L3β standard 2MASS J1726000+1538190 (data from Allers & Liu 2013) Bottom left: comparison to the L3γ 2MASS J22081363+2921215 (data from Allers & Liu 2013), a field object with an estimated age of 20–26 Myr (Gagné et al. 2015). Bottom right: comparison to the L1γ 2MASS J05184616−2756457 (data from Allers & Liu 2013). This object represents the closest NIR spectral type using the spectral-typing schemas of Allers & Liu (2013) and Cruz et al. (2017). This final comparison was done using only the 0.9–1.4 μm region (Kirkpatrick et al. 2010). The overall best statistical fit to 2MASS J1115+1937 using the entire spectrum is 2MASS J22081363+2921215. The data used to create this figure are available.
Download figure:
Standard image High-resolution imageThe best match to a sample of field objects is the L6 dwarf standard 2MASS J1010148−0406499, which is a considerably later type than the optical classification. The best statistical fit using a broader template catalog (using the χ2 method described in Bardalez Gagliuffi et al. 2014) is to L3γ 2MASS J22081363+2921215 (Allers & Liu 2013), which is a member of the 20–26 Myr old β Pictoris group (Gagné et al. 2015).
Using the index-based classification scheme from Allers & Liu (2013), we obtained a NIR spectral type of L1 and a gravity classification of very low gravity (VL-G, equivalent to γ) based on the FeH and VO band strengths, alkali line depths, and triangular shape of the H-band continuum. A comparison to the L1γ standard 2MASS J05184616−2756457 (Allers & Liu 2013) is shown in Figure 2. A spectral type of L1γ was also found using the method of normalizing and comparing the NIR spectrum band-by-band (zJ/H/K; Cruz et al. 2017). Combining these analyses, we adopt a mean NIR spectral type of L2γ (±1), which is consistent with the optical classification.
2.2. Constructing the Spectral Energy Distribution (SED)
Broadband SEDs can constrain the effective temperatures of very-low-mass dwarfs and reveal evidence of MIR excesses. Photometry from SDSS, 2MASS, and WISE for 2MASS J1115+1937 is shown in Figure 3. We re-fit the  photometry to the BT-Settl model photospheres (Allard et al. 2012, 2013) using a Markov Chain Monte Carlo (MCMC) routine described in Theissen et al. (2017) and Theissen & West (2017). The reconstructed SED is shown in Figure 3, and the photometry and model values are listed in Table 1. We include the forced WISE photometry measurements (photometry forced at the SDSS source position within the WISE images) from the unWISE coadds (Lang 2014), which typically have better noise estimates than conventional WISE photometry (Lang 2014; Lang et al. 2016).
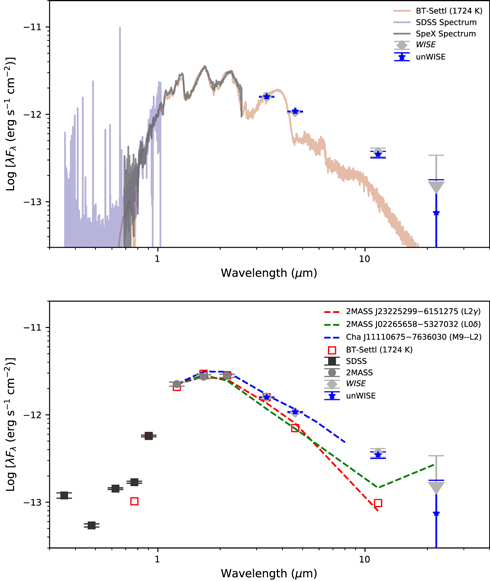
Figure 3. SEDs for 2MASS J1115+1937. Top: spectra from SDSS (blue line) and SpeX (gray line) along with the best-fit BT-Settl model (red line). Measurements from AllWISE (light gray diamonds; arrows indicate upper limits) and unWISE (blue stars) are also shown. Bottom: measurements from SDSS (black squares) and 2MASS (gray circles). Expected bandpass-integrated fluxes from the best-fit BT-Settl model are shown as red squares. The SEDs for 2MASS J02265658−5327032 (green dashed line) and 2MASS J22081363+2921215 (red dashed line) are shown to highlight the excess MIR flux of 2MASS J1115+1937. Also shown is the young (1–3 Myr) brown dwarf Cha J11110675−7636030 (blue dashed line), which has been shown to exhibit an MIR excess (Esplin et al. 2017).
Download figure:
Standard image High-resolution imageTable 1. Object Properties
| Parameter | 2MASS J1115+1937 | 2MASS J1113+2110 |
|---|---|---|
| SDSS DR8+ objID | 1237667915950588237 | 1237667734502047961 |
| R.A. (deg.) | 168.816447 | 168.295285 |
| Decl. (deg.) | 19.624012 | 21.169016 |
| Spectral type (±1) | L2γ (optical) | M6 (optical) |
| L2γ (NIR) | M7 (NIR) | |
| Teff (K) |

|

|
| dphot (pc) | 37 ± 6 (48 ± 6)a | 54 ± 9 |
| RV (km s−1) | −14 ± 7 | −10.1 ± 0.3 |
 (km s−1) (km s−1) |
… | 15.2 ± 1.3 |
| μα cos δ (mas yr−1)b | −57 ± 13 | −67 ± 8 |
| μδ (mas yr−1)b | −25 ± 8 | −14 ± 11 |
| U (km s−1)c,d | −3 ± 3 | −10 ± 3 |
| V (km s−1)d | −3 ± 3 | −6 ± 2 |
| W (kms−1)d | −17 ± 7 | −16 ± 1 |
| X (pc) | −10 ± 2 | −16 ± 3 |
| Y (pc) | −11 ± 2 | −14 ± 2 |
| Z (pc) | 34 ± 6 | 50 ± 8 |
| Radius (R⊙)e | 0.13 ± 0.02 | 0.14 ± 0.02 |
| J (2MASS) | 15.56 ± 0.06 | 13.87 ± 0.02 |
| H (2MASS) | 14.57 ± 0.06 | 13.24 ± 0.03 |
| Ks (2MASS) | 13.80 ± 0.05 | 12.89 ± 0.03 |
| W1 (AllWISE) | 13.09 ± 0.02 | 12.65 ± 0.02 |
| W2 (AllWISE) | 12.55 ± 0.03 | 12.45 ± 0.03 |
| W3 (AllWISE) | 10.77 ± 0.12 | 12.23 ± 0.41 |
| W4 (AllWISE) | >8.68 | >8.42 |
| W1 (unWISE) | 13.095 ± 0.003 | 12.654 ± 0.002 |
| W2 (unWISE) | 12.533 ± 0.007 | 12.437 ± 0.006 |
| W3 (unWISE) | 10.840 ± 0.093 | 12.286 ± 0.352 |
| W4 (unWISE) | 10.330 ± 1.509 | 10.490 ± 1.731 |
| EWHα (Å)f | 560 ± 82 | 30 ± 2 |

|
−2.9 ± 0.1 | −3.27 ± 0.03 |
| MJ | 12.75 ± 0.36g | 10.20 ± 0.36 |
| MH | 11.73 ± 0.36g | 9.58 ± 0.36 |

|
10.96 ± 0.36g | 9.22 ± 0.36 |
| Age (Myr) | 5–45 | ∼100? |
| Mass (M⊙) | 0.007–0.021 | 0.043–0.072h |

|
−3.82 ± 0.12 | −2.97 ± 0.08 |
Notes.
aOriginal distance value from Theissen et al. (2017). bThese values come from the LaTE-MoVeRS catalog. cPositive values indicate motion toward the Galactic center, ensuring that the UVW frame of reference is a right-handed coordinate system. dThese values have not been corrected for solar motion. eBased on the photometric distance value and best-fit BT-Settl model. fPositive values indicate Hα emission. gBased on the “young” calibration from Faherty et al.’s (2016) Table 19 and optical spectral types. hAssuming an age range of 45–100 Myr.Download table as: ASCIITypeset image
The SED of 2MASS J1115+1937 shows elevated fluxes in the near-UV/optical (SDSS-bands) and the MIR. The higher levels of MIR flux may be due to dust in the system, similar to what Boucher et al. (2016) discovered for 2MASS J02265658−5327032, an L0δ dwarf and possible member of the ∼40 Myr Tucana–Horologium association (Kraus et al. 2014). As previously noted, the elevated near-UV and optical flux levels, and optical line emission, may be signs of accretion or flaring. These elevated flux levels are persistent, as they are present in SDSS photometry and spectroscopy taken at different epochs.
We made comparisons to known, young brown dwarfs (Figure 3), all scaled to the 2MASS J1115+1937 J-band flux. 2MASS J02265658−5327032 (L0δ; Gagné et al. 2015) and 2MASS J23225299−6151275 (L2γ; Cruz et al. 2009) are both low-surface gravity dwarfs with age estimates <50 Myr (Gagné et al. 2015). 2MASS J02265658−5327032 is one of the oldest and lowest-mass objects known to still harbor a primordial disk based on excess MIR flux beyond 10 μm (WISE W3 and W4). Figure 3 (bottom) also shows the SED for Cha J11110675−7636030, a potential planetary-mass object (3–10 MJup) in the 1–3 Myr Chamaeleon I star-forming region (Esplin et al. 2017). Cha J11110675−7636030 has the most similar SED to 2MASS J1115+1937, possibly indicating that 2MASS J1115+1937 is also extremely young.
Esplin et al. (2017) discussed the potential for Cha J11110675−7636030 to be the least massive known brown dwarf (3–6 MJup) hosting a primordial circumstellar disk, although further additional data are needed to confirm the MIR excess arises from a circumstellar disk. Although there is not enough evidence to support 2MASS J1115+1937 having an age between 1 and 3 Myr, we can assume a lower age limit of 5 Myr, coinciding with the end of the accretion phase for brown dwarfs through observations of hydrogen and helium emission (Mohanty et al. 2005). We can also assume an upper age limit of 45 Myr, which corresponds to the oldest known objects harboring primordial circumstellar material and potentially accreting (Boucher et al. 2016; Murphy et al. 2017).
2.3. Accretion or Flare?: Persistent Hydrogen Emission
Extremely young (≲1 Myr), accreting objects have persistent (but variable) hydrogen emission (variability on the order of days; Dupree et al. 2012), and broad emission lines (e.g., White & Basri 2003). Flaring events produce narrow-line hydrogen emission with fluxes that evolve in a well-defined pattern (e.g., Hilton et al. 2010; Kowalski et al. 2013). The SDSS spectrum is a co-added spectrum of four different spectra taken over a ∼50-minute period, as is shown in Figure 4. From Kowalski et al. (2013), we can surmise that a flare observed close to peak emission will have an Hα line flux that increases or decreases by about a factor of two over this time frame. This is not seen in Figure 4. Comparison to a known accreting ∼1 Myr M4 dwarf in Orion (2MASS J05321559−0039001) shows a significantly narrower line profile than that expected from an accreting object. Comparison to the active field M9 dwarf SDSS J075825.86+331918.1 shows a similar line profile, with marginally broader wings for 2MASS J1115+1937. Jayawardhana et al. (2003) noted that very-low-mass accreting objects tend to have narrower line profiles as compared to low-mass stars. 2MASS J1115+1937 does not appear to be strongly accreting, nor is the hydrogen emission likely related to a flaring event.
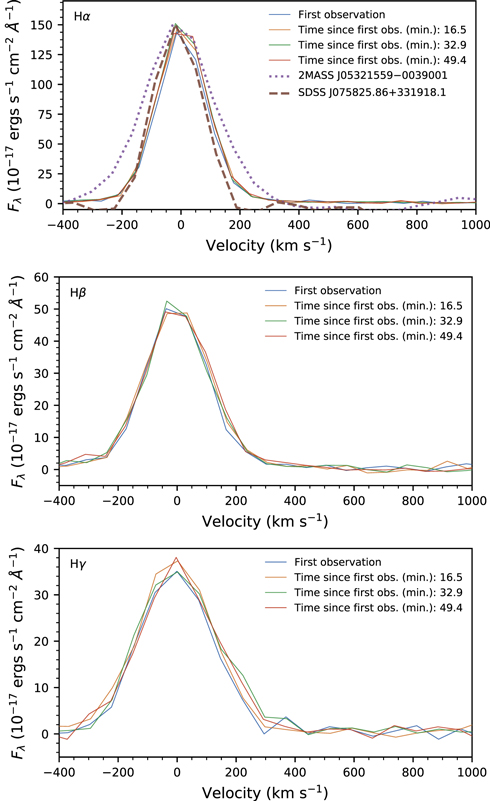
Figure 4. Hydrogen emission line profiles (Hα, Hβ and Hγ) for each single SDSS observation of 2MASS J1115+1937. There is no apparent increase or decrease in the line emission over the ∼50-minute period between the first and last observations. We show the scaled Hα line profile for 2MASS J05321559−0039001 (dotted line), a young (≲1 Myr) M4 dwarf in Orion with signs of accretion. We also show the scaled Hα line profile for SDSS J075825.86+331918.1 (dashed line), an active (EWHα = 40 ± 9 Å) field M9 dwarf. The line profile for 2MASS J1115+1937 is more similar to the field dwarf than the accreting object, likely indicating that the emission from 2MASS J1115+1937 is not due to strong accretion.
Download figure:
Standard image High-resolution image2MASS J1115+1937 also shows He i (6678 Å) emission (EWHe i = 25 ± 10 Å), another signature of accretion (Mohanty et al. 2005). We deduce that the hydrogen emission is due to persistent, enhanced magnetic activity (West et al. 2015) and/or weak accretion (Mohanty et al. 2005), both signatures of youth. Using the temperature range from the MCMC (1686–1908 K) and assuming an age range of 5–45 Myr, we infer a mass range between 7 and 21 MJup, estimated using the minimum and maximum ranges of the evolutionary models of Burrows et al. (2001), Baraffe et al. (2003, 2015), and Saumon & Marley (2008).
2.4. Revising the Distance
Theissen et al. (2017) estimated a distance of 48 ± 6 pc for 2MASS J1115+1937 using the photometric distance relationships from S. J. Schmidt et al. (2018, in preparation). These relationships were calibrated using field objects from SDSS, and contain very few young/low-surface gravity objects. We revised the distance estimate using the absolute magnitude–spectral type relationships for “young” objects from Faherty et al.’s (2016) Table 19, which use optical spectral types. For an adopted (optical) spectral type of L2, we obtained photometric distances 40 ± 12 pc, 38 ± 11 pc, 35 ± 10 pc using the J, H, and Ks magnitudes, respectively, for an uncertainty-weighted average distance of 37 ± 6 pc. This is 1.5σ closer than the previously estimated distance, and assumes 2MASS J1115+1937 is a single object.
Using a distance of 37 ± 6 pc gives a luminosity estimate of  . This luminosity is more consistent with the expected value for a field L2 dwarf than a low-gravity L2 dwarf (see Figure 32 from Faherty et al. 2016). If we use the “young” calibration from Faherty et al. (2016), we obtain an expected value of
  for a low-gravity L2 dwarf. The distance value of 48 ± 6 pc from Theissen et al. (2017) gives a luminosity of
  , which is within the spread for “young” L2 dwarfs (Faherty et al. 2016). This could indicate that the true distance to 2MASS J1115+1937 is closer to the field calibration than the young calibration.
Unfortunately, 2MASS J1115+1937 is not contained within Gaia Data Release 1 (DR1; Gaia Collaboration et al. 2016), and will require future ground- or space-based observations to obtain a trigonometric parallax measurement to determine the true distance and luminosity of 2MASS J1115+1937. In light of the numerous signatures of youth for 2MASS J1115+1937, for the remainder of this study we assume a distance of 37 ± 6 pc.
3. 2MASS J11131089+2110086: A Potentially Co-moving Star?
We searched the LaTE-MoVeRS, MoVeRS (Theissen et al. 2016), and Gaia DR1 catalogs for nearby, low-mass companions (that could be part of a new association) within 2° of 2MASS J1115+1937 that exhibited similar proper motions and distances. The proper motion information listed in Table 1 for 2MASS J1115+1937 comes from the LaTE-MoVeRS catalog. We found a potential co-moving star, 2MASS J1113+2110, at an angular separation of 162 (corresponding to a physical separation of 1.05 pc at a distance of 37 pc). We obtained a moderate-resolution optical spectrum of this source using the DeVeny spectrograph (λ/Δλ ≈ 2800; Bida et al. 2014) on the 4.3 m Discovery Channel Telescope on 2017 April 25 (UT), a low-resolution NIR spectrum using SpeX on 2017 May 6 (UT), and a high-resolution NIR spectrum (λ/Δλ ≈ 20,000) on the Keck II 10 m telescope using the Near InfraRed Spectrometer (NIRSPEC; McLean et al. 2000) on 2017 May 5 (UT).
The optical and NIR spectra are consistent with an M6 dwarf, albeit with a slightly redder NIR SED. As shown in Figure 5, these data are particularly well-matched to data for the M6 dwarf LHS 2034 (Shkolnik et al. 2009; Bardalez Gagliuffi et al. 2014; Newton et al. 2014). Although there are no obvious signatures of low surface gravity in the NIR spectrum of 2MASS J1113+2110 or LHS 2034, LHS 2034 has been previously proposed as a young star with an estimated age of ∼100 Myr based on He i (6678 Å) emission and variable, strong Hα emission (EWHα = 22. 68 Å, ΔEWHα ≈ 10 Å; Shkolnik et al. 2009).
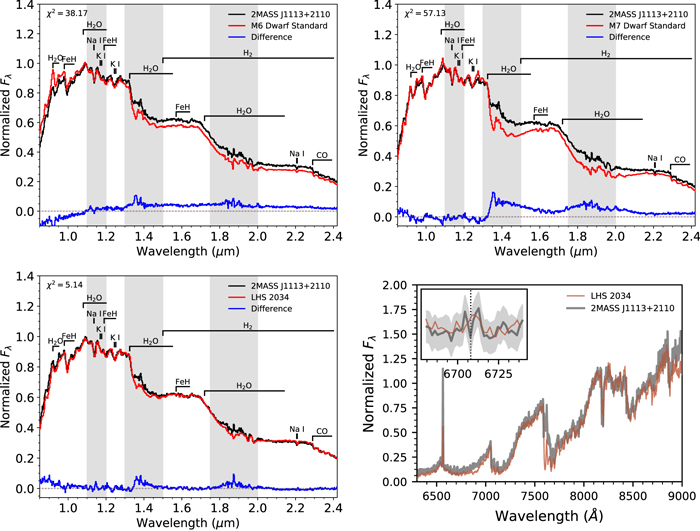
Figure 5. Comparison spectra to 2MASS J1113+2110 (black line), similar to Figure 2. Top: comparisons to the field M6 (left) and M7 (right) standards from Kirkpatrick et al. (2010), fitting to only the 0.9–1.4 μm region. Bottom left: NIR comparison to LHS 2034, using spectra from Bardalez Gagliuffi et al. (2014). Bottom right: optical comparison to LHS 2034, using spectra from Reid et al. (2007). The inset plot shows the location of the Li i feature (6708 Å; black dotted line) and flux uncertainty (gray shaded region). The data used to create this figure are available.
Download figure:
Standard image High-resolution imageThe Hα equivalent width (EWHα = 30 ± 2 Å) of 2MASS J1113+2110, is larger than 99.8% of measured Hα EWs from field M6 dwarfs in the SDSS spectroscopic M dwarf sample (West et al. 2011), indicating that 2MASS J1113+2110 is likely younger than average field objects. Only M6 dwarfs with ages ≲100 Myr tend to have such large Hα EWs (Shkolnik et al. 2009). We searched for Li i (6708 Å) absorption in the moderate-resolution spectrum (Figure 5), but the signal-to-noise ratio was too low to assert a robust detection.
We report the field-based photometric distance for 2MASS J1113+2110 (54 ± 9 pc; Theissen et al. 2017) and radius (0.140 ± 0.016 R⊙). This is primarily due to the “young” calibration from Filippazzo et al. (2015) giving an estimate of Teff ≈ 2298 K, which is inconsistent with our MCMC value of  K. The field calibration from Filippazzo et al. (2015) and Faherty et al. (2016) gives Teff ≈ 2771 K, which is more consistent with our value. Measured properties are reported in Table 1.
Cook et al. (2016) flagged 2MASS J1113+2110 as a potentially unresolved binary composed of an M dwarf and a lower-mass companion. The SpeX spectrum does not show evidence for a spectral binary (Bardalez Gagliuffi et al. 2014), although since such sources generally have a T dwarf secondary, we cannot rule out a late-M or L dwarf companion. Additionally, the high-res NIRSPEC spectrum rules out a very close (≲0.1 au), double-lined spectroscopic binary. We obtained adaptive optics (AO) imaging of this object using the Near-infraRed Camera 2 (NIRC2) and laser guide star (LGS) AO system (van Dam et al. 2006; Wizinowich et al. 2006) on the Keck II 10 m Telescope on 2017 May 4 (UT). These data rule out companions more widely separated than ≳01 (projected separation ≳3 au) and brighter than H ≈ 15.2 (Bardalez Gagliuffi et al. 2015). While there is a small chance of a companion existing between these limits, it is unlikely that 2MASS J1113+2110 is a close binary system.
The spatial proximity, similar space motion, and evidence of youth in these two sources suggest a physical association even if not gravitationally bound. However, the large space density of low-mass stars and wide separation of the pair necessitate an investigation of the probability that these two objects are simply chance alignments with similar positions and kinematics. We assess the probability for a chance alignment using a method similar to Dhital et al. (2010), who simulated low-mass stellar populations and kinematics along a line of sight through the Galaxy to confirm wide, co-moving pairs.
To simulate star counts and kinematics along the line of sight of the binary, we used the Low-mass Kinematics model (LoKi; Theissen & West 2017), which builds stellar populations using an empirical luminosity function and empirical kinematic dispersions. We ran 106 simulations using a 3° field along the line of sight, integrated between 0 and 2500 pc, counting every simulation in which at least two stars were found within the projected separation of the candidate pair, and the distances and kinematics (proper motions and RVs) of the simulated stars were within the 1σ ranges for 2MASS J1115+1937 and 2MASS J1113+2110. We find the probability of chance alignment to be 1.8%, making this a possible, but low-probability, chance alignment.
To further assess the physical association of this visual pair, we estimated the disruption timescale for a binary of this combined mass and separation as it orbits through the Galaxy. We estimated the average time for a binary with semimajor axis a to be disrupted using Equation (18) from (Dhital et al. 2010, based on the work of Weinberg et al. 1987 and Close et al. 2007),

where a is the semimajor axis in pc, t* is the average lifetime of the binary in Gyr, and Mtot is the total mass of the binary in solar units. This equation assumes an average Galactic mass density of 0.11 M⊙ pc−3, and an average perturber with Vrel = 20 km s−1, M = 0.7 M⊙ (the average mass of a perturber), and a Coulomb logarithm of unity, Λ = 1. To approximate the true semimajor axis, we used the statistical correction that accounts for the eccentricity and inclination angle of the binary orbit (Equation (7) from Fischer & Marcy 1992) to convert projected separation (s) into true separation (a),

where d is the distance to the binary, and Δθ is the angular separation in radians. Using the uncertainty-weighted average distance of the candidate pair (d = 47 ± 5 pc), an uncertainty in Δθ of one-tenth of an SDSS pixel9
(∼004), and Equation (2), we estimated a = 1.7 ± 0.2 pc. Using the maximum and minimum value for a and the mass ranges from Table 1 in Equation (1) gave us a survival time between 32 and 75 Myr for this candidate pair. This indicates that its survival time may be on the order of the ages of the system components. If the co-moving nature of this system is confirmed in the future through more precise proper motion measurements and a precise RV measurement for 2MASS J1115+1937, this may be an example of a co-ejected wide pair that has not had time to be dynamically dissolved through encounters in the Galactic field population (e.g., Caballero 2010; Oelkers et al. 2017; Oh et al. 2017; Price-Whelan et al. 2017).
4. Assessing Kinematic Membership
There are a number of known NYMGs with estimated distances similar to those of 2MASS J1115+1937 and 2MASS J1113+2110 (for a detailed review see Mamajek 2016). Several tools exist to assess membership in these NYMGs and include, but are not limited to, the Bayesian Analysis for Nearby Young AssociatioNs (BANYAN) I (Malo et al. 2013), II (Gagné et al. 2014), and Σ (Gagné et al. 2017), the LocAting Constituent mEmbers In Nearby Groups (LACEwING) (Riedel et al. 2017), and the convergent point analysis tool of Rodriguez et al. (2013).
The convergent point analysis tool uses positions and proper motions to trace back the tangential motions and match to the convergent point of a kinematic group. Using the analysis tool of Rodriguez et al. (2013), we find that there is a high probability that 2MASS J1115+1937 and 2MASS J1113+2110 could be members of multiple NYMGs, but with drastically different target RVs and distances. The BANYAN I, II, and Σ tools and LACEwING use positions, proper motions, RVs, and distances to accurately calculate 3D kinematics and better assess group membership. The RV for 2MASS J1113+2110 was measured using the NIRSPEC data and the forward-modeling method described in Burgasser et al. (2015) and Blake et al. (2010). All four methods give <0.001% probability that either 2MASS J1115+1937 or 2MASS J1113+2110 are members of any of the NYMGs tested in these tools.10
5. Discussion
2MASS J1115+1937 joins a growing group of young, isolated low-mass stars and brown dwarfs (e.g., Cruz et al. 2009; Gagné et al. 2015; Faherty et al. 2016). Although Allers & Liu (2013) show that low-gravity classification and redness (using NIR colors) for an object do not necessarily prove youth, the elevated near-UV continuum, hydrogen and helium emission, and MIR excess of 2MASS J1115+1937 are all consistent with an age younger than 45 Myr. 2MASS J1115+1937 may be a member of a kinematic association awaiting discovery, or the result of an ejection from a young association. This potentially makes 2MASS J1115+1937 a very important benchmark for brown dwarf formation scenarios, and possibly a new optical, spectroscopic standard.
2MASS J1113+2110 may be associated with 2MASS J1115+1937. The strong Hα emission is consistent with a relatively young field star (≲100 Myr). While the NIR spectrum of 2MASS J1113+2110 is not classified as low-gravity, it falls within a spectral type regime where gravity classifications converge (e.g., see Figures 20, 22, and 24 from Allers & Liu 2013). A trigonometric parallax measurement would help associate or dissociate 2MASS J1113+2110 with 2MASS J1115+1937. Unfortunately, both sources are too faint to be detected by Gaia, and must wait for a future astrometric measurement. Detection of Li i with a high-resolution optical spectrum would also constrain the mass to <0.6 M⊙, and the age to <100 Myr, providing an independent check on the age of 2MASS J1115+1937.
The authors would like to thank the helpful suggestions from the anonymous referee, which contributed greatly to the quality of this manuscript. A.J.B. acknowledges funding support from the NSF under award No. AST-1517177 and the US-UK Fulbright Commission. This material is based upon work supported by NASA under grant No. NNX15AI75G and grant No. NNX16AF47G issued through the Astrophysics Data Analysis Program.
The authors recognize and acknowledge the very significant cultural role and reverence that the summit of Maunakea has always had within the indigenous Hawaiian community. We are most fortunate and grateful to have the opportunity to conduct observations from this mountain.
Funding for SDSS-IV has been provided by the Alfred P. Sloan Foundation, the U.S. Department of Energy Office of Science, and the Participating Institutions. SDSS-IV acknowledges support and resources from the Center for High-Performance Computing at the University of Utah. The SDSS web site is http://www.sdss.org.
SDSS-IV is managed by the Astrophysical Research Consortium for the Participating Institutions of the SDSS Collaboration including the Brazilian Participation Group, the Carnegie Institution for Science, Carnegie Mellon University, the Chilean Participation Group, the French Participation Group, Harvard-Smithsonian Center for Astrophysics, Instituto de Astrofísica de Canarias, The Johns Hopkins University, Kavli Institute for the Physics and Mathematics of the Universe (IPMU)/University of Tokyo, Lawrence Berkeley National Laboratory, Leibniz Institut für Astrophysik Potsdam (AIP), Max-Planck-Institut für Astronomie (MPIA Heidelberg), Max-Planck-Institut für Astrophysik (MPA Garching), Max-Planck-Institut für Extraterrestrische Physik (MPE), National Astronomical Observatory of China, New Mexico State University, New York University, University of Notre Dame, Observatário Nacional/MCTI, The Ohio State University, Pennsylvania State University, Shanghai Astronomical Observatory, United Kingdom Participation Group, Universidad Nacional Autónoma de México, University of Arizona, University of Colorado Boulder, University of Oxford, University of Portsmouth, University of Utah, University of Virginia, University of Washington, University of Wisconsin, Vanderbilt University, and Yale University.
This publication makes use of data products from 2MASS, which is a joint project of the University of Massachusetts and the IPAC/Caltech, funded by NASA and NSF. This publication also makes use of data products from the Wide-field Infrared Survey Explorer, which is a joint project of UCLA, and JPL/Caltech, funded by NASA.
This research has benefitted from the SpeX Prism Libraries, maintained by Adam Burgasser at http://pono.ucsd.edu/~adam/browndwarfs/spexprism; and the M, L, and T dwarf compendium housed at http://DwarfArchives.org and maintained by Chris Gelino, Davy Kirkpatrick, and Adam Burgasser. This research has also made use of the SIMBAD database and the VizieR catalog access tool, operated at CDS, Strasbourg, France; the NASA/ IPAC Infrared Science Archive, which is operated by the Jet Propulsion Laboratory, California Institute of Technology, under contract with the National Aeronautics and Space Administration; NASA’s Astrophysics Data System; and Astropy, a community-developed core Python package for Astronomy (Astropy Collaboration et al. 2013). Plots in this publication were made using Matplotlib (Hunter 2007). This research has made use of the SIMBAD database, operated at CDS, Strasbourg, France (Wenger et al. 2000).
Facilities: IRTF (SpeX) - Infrared Telescope Facility, Keck:II (NIRC2 - , NIRSPEC) - , DCT (DeVeny spectrograph) - , IRSA - , WISE - Wide-field Infrared Survey Explorer.
Software: SpeXtool (Vacca et al. 2003; Cushing et al. 2004), SPLAT (Burgasser & the SPLAT Development Team 2017), Astropy (Astropy Collaboration et al. 2013), Matplotlib (Hunter 2007), BANYAN Σ (Gagné et al. 2017), LACEwING (Riedel et al. 2017), BANYAN II (Gagné et al. 2014), BANYAN I (Malo et al. 2013), the convergent point tool (Rodriguez et al. 2013), emcee (Foreman-Mackey et al. 2013), LoKi (Theissen et al. 2016), Sublime Text.
Footnotes
- 8
- 9
- 10
(1)
Chamæleontis; (2) η Chamæleontis; (3) TW Hydrae; (4) β Pictoris; (5) 32 Orionis; (6) Octans; (7) Tucana–Horologium; (8) Columba; (9) Carina; (10) Argus; (11) AB Doradus; (12) Carina; (13) Carina-Near; (14) Coma Berenices; (15) Ursa Major; (16) χ01 Fornax; (17) Hyades; (18) 118 Tau; (19) Corona Australis; (20) Lower Centaurus–Crux; (21) Platais 8; (22) Pleiades; (23) ρ Ophiuci; (24) IC 2602; (25) IC 2391; (26) Upper Centaurus-Lupus; (27) Upper Corona Australis; and (28) Upper Scorpius.