Abstract
The soft X-ray excess and Fe Kα emission lines are widely observed in Seyfert galaxies, with their origin still in debate. We present a detailed spatially resolved image and spectral analysis of the Seyfert 2 galaxy NGC 1068 using high-resolution Chandra ACIS data. We find that the soft X-ray emission and iron emission show extended structures in the northeast and southwest directions. Especially, the soft X-ray extends predominantly in the 1″−15″ (∼72 pc–1 kpc) northeast sector with a distance of at least ∼10″ (∼700 pc), and its 0.5–3.0 keV flux is about ∼2/3 of that from the 1″ radius circular region centered on the core of NGC 1068. We fit the soft X-ray spectra from the core and two bright blobs (∼3″, S1 and ∼1 5, S2 from the nucleus) as a dual-temperature plasma with two APEC models. Our analysis suggests that the extended soft X-ray emission in NGC 1068, as well as contributions to Fe Kα emission from the extended region, likely originate from the interactions between the jet and the interstellar medium, offering further insights into the origin of soft X-ray excess and Fe Kα emission lines in similar Seyfert sources. However, extended X-ray emission outside the ionization cone might be influenced by additional processes; future multiwavelength observations will be needed to test these possibilities.
Original content from this work may be used under the terms of the Creative Commons Attribution 4.0 licence. Any further distribution of this work must maintain attribution to the author(s) and the title of the work, journal citation and DOI.
1. Introduction
First identified as a class by C. K. Seyfert (1943), Seyfert galaxies are a class of active galactic nuclei (AGN) characterized by extremely luminous emission cores powered by accretion of material onto supermassive black holes at the centers of distant galaxies. They are distinguished from other AGN by their visible-light emission line spectra, revealing high-ionization states and relatively narrow permitted and forbidden emission lines (D. E. Osterbrock 1989). Compared to quasars and blazars, Seyfert nuclei are fainter in luminosity (1043−1045 erg s–1) and thought to be powered by lower-mass massive black holes (∼106−107 M⊙) accreting at a lower rate. X-ray observations of Seyfert 1 galaxies over 0.1–100 keV by large area detectors on board satellites such as XMM-Newton and Suzaku have enabled detailed spectroscopic analysis, revealing distinct spectral components including a dominant power-law continuum, soft X-ray excess below 2 keV, a neutral Fe Kα line at ∼6.4 keV, and a reflect component with a Compton hump at ∼20−40 keV (I. M. George & A. C. Fabian 1991; K. Nandra & K. A. Pounds 1994).
Soft X-ray excess is widely observed in the X-ray spectra of Seyferts (T. J. Turner & K. A. Pounds 1989), yet its physical origin remains an open question. Previous studies have proposed various models, including relativistically blurred photoionized disk reflection (J. Crummy et al. 2006), warm Comptonization in an optically thick plasma (P. O. Petrucci et al. 2020), or an artifact of ionized absorption in a disk wind (M. Gierliński & C. Done 2004; M. Middleton et al. 2007). While these models have successfully explained soft excess in certain scenarios, they often focus on processes occurring near the central engine and may overlook contributions from larger-scale dynamics. The interpretation likely depends on whether the central engine is viewed directly, as in unobscured Seyfert 1s, or is heavily absorbed by gas and dust, as in Seyfert 2s. In unobscured AGN, the soft excess arises from the innermost relativistic regions of the accretion flow (B. Czerny et al. 2003; A. C. Fabian et al. 2004). The strength of blurred ionized reflection matches timing properties from reverberation mapping (E. Kara et al. 2019). Recent observations suggest that extended soft X-ray emission in obscured AGN, such as Seyfert 2 galaxies, could arise from diffuse thermal plasma or photoionized gas on kiloparsec scales (M. Guainazzi & S. Bianchi 2007; A. Marinucci et al. 2011). A significant portion of AGN soft X-ray spectra (0.2–3 keV) has been found to contain absorption components produced by partially ionized gas, referred to as warm absorbers (WAs), which may coincide with the soft X-ray excess (K. Nandra & K. A. Pounds 1994; J. S. Kaastra et al. 2000). Y. Mochizuki et al. (2023) successfully modeled the X-ray spectrum of Mrk 766 using multiple similar partially ionized absorption components, demonstrating the connection between WAs and outflows or winds. Currently, the specific mechanisms for generating such extended structures with X-ray emitting gas and WAs remain unclear. In particular, the role of AGN-driven jets in heating the interstellar medium (ISM) to X-ray emitting temperatures has not been systematically investigated in the context of soft excess.
The neutral Fe Kα fluorescence line at 6.4 keV, first observed in Seyfert galaxies by ASCA (Y. Tanaka et al. 1995), contains both a broad variable component produced in the inner accretion disk and a narrow constant core. In the past decades, Chandra and XMM-Newton have resolved this narrow-line core as significantly extended over distances of hundreds of parsecs in several nearby Seyferts, e.g., NGC 1068 (A. J. Young et al. 2001; G. Matt et al. 2004), Mrk 3 (S. Bianchi et al. 2005), and the Circinus galaxy (A. Marinucci et al. 2013). M. Masterson & C. S. Reynolds (2022) found the Fe Kα emission is extended to a distance of ∼5−100 pc from the galaxy center using their sample of seven sources. Importantly, C. Andonie et al. (2022) pointed out that the observed iron emission extends to 95 ± 15 pc and 795 ± 176 pc in the Circinus galaxy and NGC 1068. R. Uematsu et al. (2021) reported that the relative contribution of this extended line emission to the total Fe Kα flux in the Circinus galaxy is ∼20%. This implies a substantial portion of the observed neutral iron line arises not from the immediate AGN environment, but from more distant reprocessors like the outer accretion disk, broad-line clouds, or obscuring torus, naturally producing Fe fluorescence when illuminated by the central engine.
With Chandra’s excellent angular resolution, several works on some nearby Seyfert galaxies have shown kiloparsec-scale cone-shaped structures extending outward from the galactic center (e.g., H. R. Schmitt et al. 2003), generally believed to originate from ionized gas produced by photoionization due to radiation from the central AGN. R. M. Sambruna et al. (2001) found the X-ray emission in the Circinus galaxy extended to the northwest, corresponding well with the [O III] emission region, and B. Mingo et al. (2012) suggested that such extended emission in the Circinus galaxy likely originates from jet-driven outflows, with gas shock heated and entrained into the halo. O. Gonzalez-Martin et al. (2010) discovered the < 2 keV soft X-ray emission in Mrk 573 extended from the core to about 12″ (∼4 kpc), correlating with [O III] emission. And they also fitted the soft X-ray spectra with a photoionization model. In the X-ray spectrum of NGC 5252, M. Dadina et al. (2010) found a soft X-ray excess below 1 keV, with XMM-Newton/Reflection Grating Spectrometer (RGS) revealing complex emission lines in the 0.2–1.5 keV band, suggesting a complex ionized gas environment within the galaxy. J. Wang et al. (2010) found a hot plasma with a temperature of kT ∼ 0.25 keV or a photoionization component is required to fit the ≃2 kpc soft X-ray emission in NGC 4151. They also pointed out that, besides photoionization, AGN outflows could heat the gas to temperatures sufficient for X-ray emission through mechanical heating, providing strong evidence of AGN feedback on a galactic scale. L. Di Gesu et al. (2017) found kiloparsec-scale [O III] outflows in the Seyfert 1 galaxy 1H 0419-577, suggesting these structures are also sources of WAs seen in UV/X-ray spectra. They proposed that this emission could be explained by either a hot plasma (Te ∼ 0.22 keV) or photoionized gas with nH ∼ 1022 cm−2 and  . They also noted that the absorption lines in the X-ray/UV band indicate the presence of cooler clumps within the warm outflows. The prevalence of the soft excess in obscured and unobscured AGN underscores its intimate connection to fundamental processes powering and regulating all accretion flows around supermassive black holes.
NGC 1068 is a nearby (D = 14 Mpc) Seyfert 2 galaxy that hosts an obscured AGN (R. R. J. Antonucci & J. S. Miller 1985). As one of the brightest and best-studied Seyfert galaxies, NGC 1068 has been extensively observed across the electromagnetic spectrum (A. Kinkhabwala et al. 2002; K. Pounds & S. Vaughan 2006; F. E. Bauer et al. 2015). In the X-ray band, it shows a rich complex of emission components, including a soft X-ray excess below 2 keV and a strong neutral Fe K-α line at 6.4 keV (A. J. Young et al. 2001; G. Matt et al. 2004). In NGC 1068, the soft X-ray excess has been suggested to arise from photoionized or collisionally ionized diffuse plasma (A. Kinkhabwala et al. 2002) and can be well modeled with several plasma components, with little variability in the spectral energy distribution (S. Grafton-Waters et al. 2021). However, the precise physical mechanisms responsible for the observed soft excess in Seyfert galaxies and its connection to the broader dynamics of the host galaxy remain unclear.
In this work, we provide a fresh perspective by exploring the potential origins of the soft excess in the extended regions of NGC 1068. Specifically, we investigate whether thermal emission from hot gases, possibly generated through interactions between AGN-driven jets and the ISM, can account for the observed soft X-ray excess. By leveraging the high spatial and spectral resolution capabilities of Chandra, we disentangle the various spectral components and analyze the physical properties of the emitting regions in unprecedented detail. This approach enables us to bridge the gap between previous spectral models and the complex dynamical processes occurring in the galaxy.
We first describe the observations and data reduction in Section 2, then conduct a detailed spectral and image analysis across different energy bands for NGC 1068 in Section 3. We further explore the origins of the soft X-ray and Fe line emissions in NGC 1068, and discuss the potential connection with the soft X-ray excess in Section 4. Our conclusions are summarized in Section 5. In this paper, we adopt H0 = 70 km s−1 Mpc−1, ΩΛ = 0.73, and ΩM = 0.27. All quoted errors are within the 90% confidence level unless otherwise noted.
2. Observations and Data Reduction
The Chandra X-ray Observatory (CXO) has performed several observations of NGC 1068 over the past few decades using its Advanced CCD Imaging Spectrometer (ACIS) and High Energy Transmission Grating (HETG). For this analysis, we selected seven Chandra observations with the ACIS-S/HETG detector (Table 1), which provides subarcsecond angular resolution (<0 5 FWHM) and moderate spectral resolution (FWHM ∼ 95 eV at 1.49 keV and FWHM ∼ 150 eV at 5.9 keV for ACIS-S). Our work focuses exclusively on the zeroth-order imaging and spectral data and does not include analysis of dispersed spectra (e.g., first or second order) in order to concentrate on the physical shape of the central region of NGC 1068. The zeroth-order data were chosen because the HETG disperses higher-energy photons into dispersed orders, reducing the photon flux in the zeroth-order image, which effectively mitigates pileup effects that are prominent in observations without gratings. Additionally, the first- and second-order spectra encompass the emission from the entire NGC 1068, making it difficult to spatially resolve the emission features. However, it is important to note that the zeroth-order data can still be affected by pileup. We listed the estimated pileup fraction from R. Nakata et al. (2021) in Table 1.
Table 1. Chandra ACIS/HETG Observations Used in This Work
| Observations | Date | Exposure Time | Pileup Fractiona | Δxb | Δyb |
|---|---|---|---|---|---|
| (ks) | (%) | (pixel) | (pixel) | ||
| 9148 | 2008-12-05 | 80 | 11.1 | −0.625 | –0.295 |
| 9149 | 2008-11-19 | 89 | 11.2 | ref | ref |
| 9150 | 2008-11-27 | 41 | 10.7 | −0.175 | 0.171 |
| 10815 | 2008-11-20 | 19 | 10.7 | 0.147 | 0.208 |
| 10817 | 2008-11-22 | 33 | 11.2 | −0.500 | –0.198 |
| 10829 | 2008-11-30 | 38 | 10.6 | −0.233 | –0.454 |
| 10830 | 2008-12-03 | 43 | 10.7 | −0.543 | –0.470 |
Notes.
aThe central pileup fraction is collected from R. Nakata et al. (2021), with 2.5 s frame times for all seven observations used in this work. bThe shifts in X- and Y-direction between each observation and the reference data set.Download table as: ASCIITypeset image
We utilized the zeroth-order data from the seven observations, which were reduced using the Chandra Interactive Analysis of Observations (CIAO) software package (v4.13; A. Fruscione et al. 2006) and the Chandra Calibration Database (CALDB v4.10). The individual observations were reprocessed with the chandra_repro script with pix_adj = edser to apply subpixel event resolution. To reach a higher signal-to-noise value, the output event files were combined into a single image using merge_obs.
Before merging the event files, we applied a relative astrometric correction between the seven observations. We chose observation 9149 as the reference data set since it has the longest exposure time (∼89 ks) of the seven observations. We first used wavdetect to generate source lists for the seven observations, and the transformation matrices used to match the observations were computed with wcs_math. Then, the aspect solution file and event file world coordinate system parameters are updated by wcs_updated. We also updated the ASOLFILE keyword in the updated files with dmhedit, and all the event files were reprojected using reproject_events. The shifts between the six observations and 9149 in X- and Y-directions are shown in Table 1.
As the combined event file is not recommended for spectral extraction in the standard CIAO pipeline, we only used this combined file for image analysis. In order to examine the geometric connections between different emission components, we extracted the spectra and associated response files (redistribution matrix files and ancillary response files) for the central core and two bright blobs (See Section 3.1 for detailed information.) using specextract with correctpsf = no. The X-ray spectra were first extracted separately for all observations, and then stacked into a single spectrum with the CIAO task combine_spectra. The core spectrum was extracted from a circular region with a radius of 0 6, centered on the AGN location, to encompass the majority of the emission from the nuclear region while minimizing contamination from nearby structures. For the two blobs, which exhibit irregular shapes distinct from point sources, we defined extraction regions using bounding boxes tailored to their specific features. Specifically, the spectrum of the S1 blob was extracted from a box region of approximately 1
 8 × 1
8 × 1 5, and the spectrum of the S2 blob from a box region of approximately 1
 0 × 0
0 × 0 8. These dimensions were chosen to maximize the inclusion of the emission from each blob while avoiding overlap with unrelated structures or background features. The X-ray background was measured from a source-free 40
 0 radius circular region on the same CCD chip. A pileup model in Xspec was applied to account for the pileup effect on these regions while fitting their spectrum. A detailed description is provided in Section 3.2.
Following C. Andonie et al. (2022), considering the Chandra point-spread function (PSF) wings may exhibit potential underestimations due to the effect of pileup, we adopt the radial profile of the X-ray binary (XRB) Her X-1. This radial profile was then used to characterize the actual PSF, which provides a more accurate representation of the observed point source under real observational conditions. The following six observations of Her X-1 were used in this work: 2749, 3821, 3822, 4585, 6149, and 6150. To improve the signal-to-noise ratio, we first combined these observations after applying the relative astrometry correction, with the specific merging procedure outlined previously in this paper. We then employed the dmextract tool to extract the radial profile of the Her X-1.
3. Data Analysis and Results
3.1. Image Analysis
We first extracted the 0.5–10.0 keV X-ray image of NGC 1068 from the combined Chandra events file using the fluximage tool, and we applied the Energy-Dependent Subpixel Event Repositioning (EDSER) algorithm (J. Li et al. 2004) to achieve a higher resolution of 1/8 subpixel (∼0 06). The 0.5–10.0 keV X-ray image was presented in Figure 1(a). However, it is important to note that while EDSER refines photon localization, the HRMA mirrors are not fully calibrated at subpixel scales, as stated in the Chandra technical documentation. The PSF anomaly known as the “hook,” which is caused by misaligned mirrors, introduces a localized enhancement at approximately 0
 8. To account for this effect, we adjusted the extraction regions in different analyses. For the radial profile analysis, we used a circular region with a radius of 1″ to extract the central flux, instead of the 0
 6 radius employed for spectral extraction. This adjustment minimizes the contamination from the hook anomaly and ensures a more accurate characterization of the radial distribution of the flux. For spectral analysis, the 0
 6 radius circular region was chosen to better isolate the nuclear emission while reducing the contribution from extended structures.
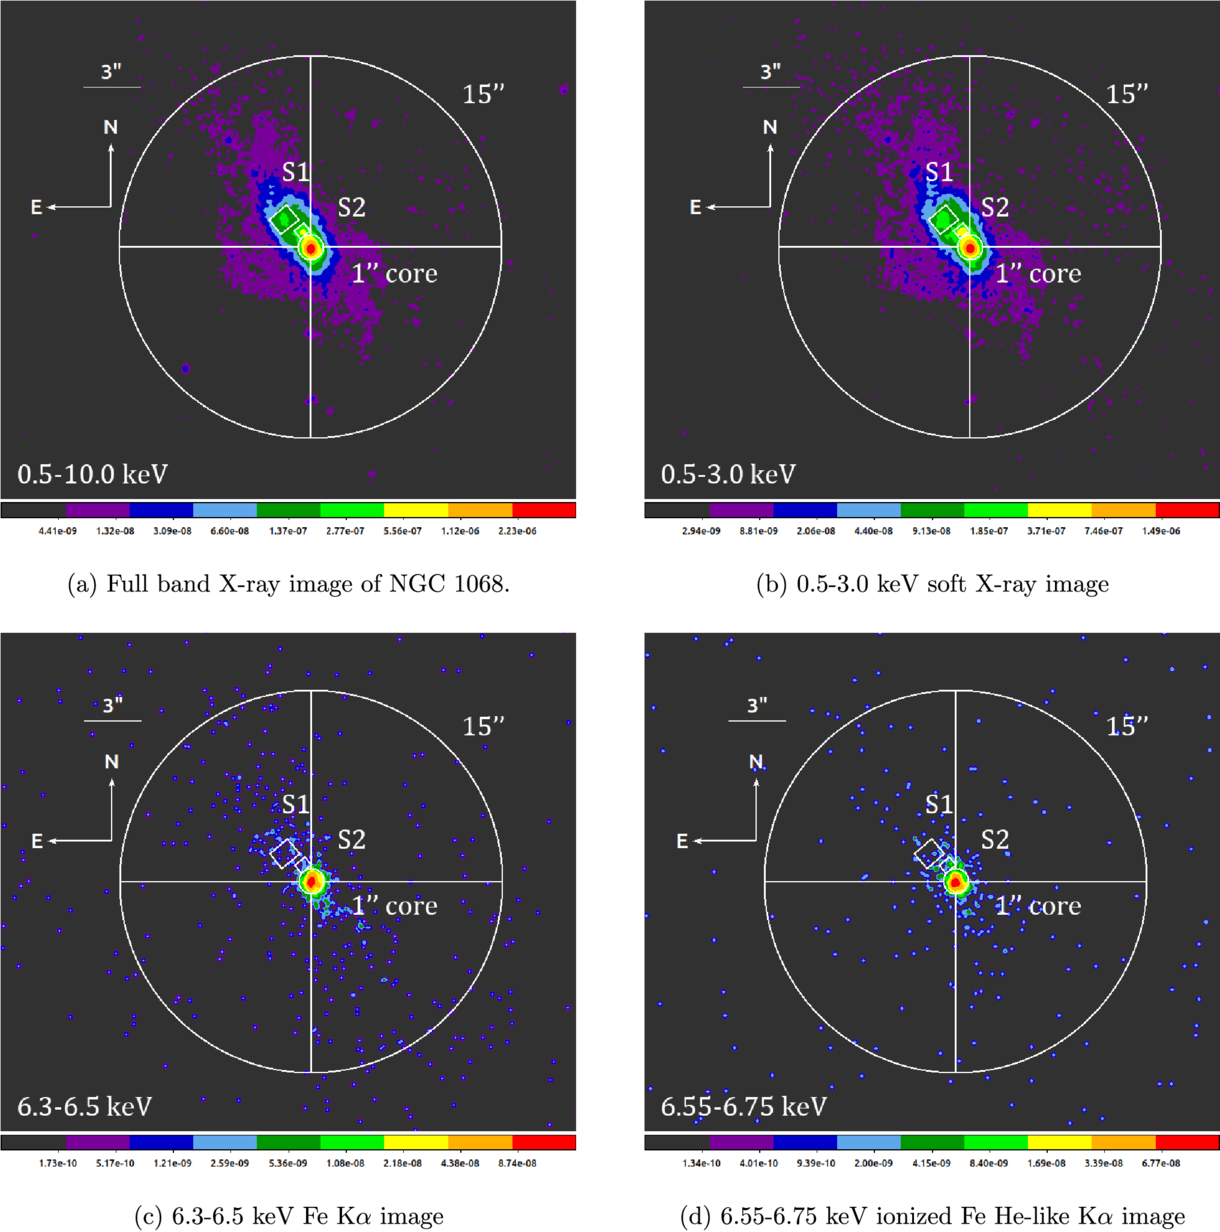
Figure 1. The full band and 0.5–3.0, 6.3–6.5, and 6.55–6.75 keV Chandra ACIS image. The large white circle in the image represents the 15″ region centered on the nuclei, and the small 1″ region highlights the position of AGN. The region was divided into four quadrants (NE, NW, SE, and SW). The two box regions represent the region used to extract the S1 and S2 blob spectra. The images were smoothed using a Gaussian function with a radius of 3 pixels and σ = 1.5 with ds9, and displayed with a logarithmic scale and color map aips0.
Download figure:
Standard image High-resolution imageThe image shows a unique extended shape of the X-ray emissions, showing an extended emission region originating from the galactic center ( ) with two brighter blobs (hereafter S1 and S2) ∼3″ (S1) and ∼1
 5 (S2) from the nucleus.
The X-ray emission was found to extend to a distance of ∼15″ from the galactic center. Two pointlike sources (R.A.1 =2h42m41 37, decl.1 = −0h0m57
 17; R.A.2 = 2h42m40
 71, decl.2 = −0h0m59
 60) located in the circular region of 15″ radius centered on the galaxy core were removed from the merged event files using a mask of 1″ radius circle with dmcopy to reduce their influence in our analysis. We then filled the holes using dmfilth with the POISSON method. Two annulus regions with 1
 0 inner radius and 1
 5 outer radius centered on the two point sources were used as their background region while running the dmfilth tool.
Inspired by recent studies in NGC 5728 (A. Trindade Falcao et al. 2023) and NGC 7212 (M. L. Jones et al. 2020), we divided the X-ray image into four 90∘ sectors extending from 1″ to 15″ (as shown in Figure 1) centered on the galactic core—northeast (NE), northwest (NW), southeast (SE), and southwest (SW), to better examine the extended X-ray emission. To illustrate this extent structure at different energies, we then extracted X-ray images in three distinct energy bands from the combined Chandra events file using the fluximage tool, and present our result in Figures 1(b), (c), and (d). Figure 1(b) illustrates the 0.5−3.0 keV soft X-ray emission, while the two narrow bands (Figures 1(c), and (d)) highlight significant emission lines seen in the spectra—the 6.3−6.5 keV band contains the neutral 6.4 keV Fe Kα line and the 6.55−6.75 keV band contains the ionized 6.67 keV Fe He-like K line. The images were smoothed using a Gaussian function with a radius of 3 pixels and σ = 1.5 with ds9, to better show the structure.
Considering that the 6.3−6.5 and 6.55−6.75 keV bands also contain continuum emission, we extracted the 5.0−9.0 keV spectrum (which avoids the soft emission and simplifies the spectral model) for the NE, NW, SE, SW, and central regions to account for the fraction of the continuum flux in the total flux of these bands. The spectrum was fitted with a simple power-law model and two Gaussian line models. The flux for each component in the 6.3−6.5 and 6.55–6.75 keV bands was extracted using cflux. Our results show that, within the 6.3− 6.5 and 6.55−6.75 keV bands, the line flux is at least 7 times greater than the continuum flux in these narrow energy ranges, based on the power-law continuum estimated from the 5.0− 9.0 keV spectrum. Therefore, we consider the 6.3−6.5 and 6.55−6.75 keV band images as representative of the line emission behavior.
Our soft X-ray (0.5–3 keV) image is shown in Figure 1(b). Similar to the broadband image of 0.5−10 keV, the soft X-ray image reveals similar extended structures and bright spots. Figure 2 shows the image of the [O III] band taken by the Hubble Space Telescope (HST)/WFPC2 with the F502N narrowband filter; the data was obtained via STScI (2016), with [O III] band contour map overlaid on the X-ray image taken by Chandra. The original HST/WFPC2 image (color map bb) and the 1/8 subpixel resolution Chandra image (color map aips0) were smoothed using a Gaussian function with a radius of 1 pixel and σ = 0.5 and shown in logarithmic scale with ds9. The contour map was generated by ds9, with level = 5, smooth = 4. It is noteworthy that the bright blobs S1 and S2 in the extended soft X-ray emission have shown possible correspondence to the bright regions shown in the [O III] band image. The positions of the two bright blobs in the X-ray band show a complex structure in the [O III] band image, characterized by intricate features such as extended or multicomponent structures within the S1 and S2 regions. This suggests that the emissions in both bands may originate from similar physical processes, potentially linked to phenomena such as outflows, shocks, or jet–ISM interactions (L. R. Holden & C. N. Tadhunter 2023). We also noticed that the extended X-ray emission region is aligned with the jet structure of NGC 1068 observed in the e-merlin 5 GHz radio band (I. M. Mutie et al. 2024), indicating this part of the extended soft X-ray emission might also be related to the jet–ISM interaction.
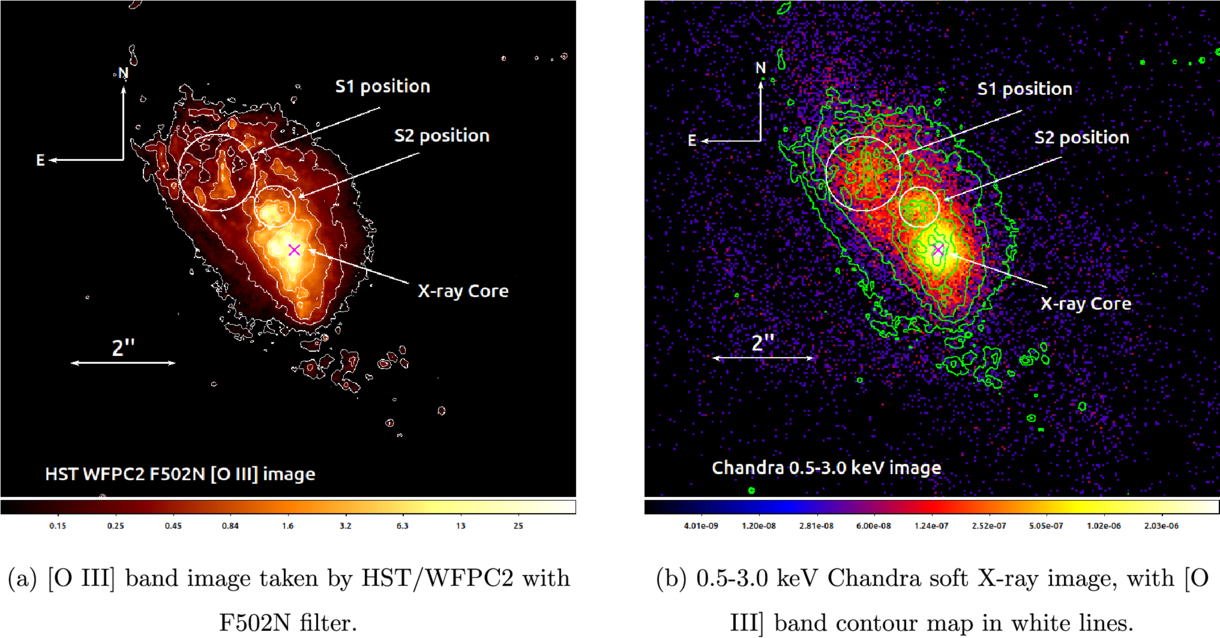
Figure 2. HST/WFPC2 [O III] band image and 0.5–3.0 keV Chandra soft X-ray image. The original HST/WFPC2 image (color map bb) and the 1/8 subpixel resolution Chandra image (color map aips0) were smoothed using a Gaussian function with a radius of 1 pixel and σ = 0.5 and shown in logarithmic scale. The contour map was generated by ds9, with level = 5, smooth = 4. The pink cross notes the position of the central AGN in the core region.
Download figure:
Standard image High-resolution imageFigure 1(c) illustrates that the 6.3–6.5 keV emission primarily originates from the core region. The production of the ionized iron Kα line requires higher temperatures, suggesting its distribution should be closer to the central region of the AGN, consistent with the results shown in Figure 1(d), showing a similar structure as the 6.3−6.5 keV image, with the emission concentrated within the central 1″ (∼72 pc) region. However, we did not find significant differences between Figures 1(c) and (d).
We then analyzed the radial profile of the extended emission in NGC 1068. As we introduced in Section 2, we considered the radial profile of Her X-1 as the PSF of a point source to compare with the radial profile of NGC 1068. To obtain the observed counts for NGC 1068 and Her X-1, we first used the flux_obs to generate the exposure map for each band (0.5–3.0, 6.3–6.5 and 6.55–6.75 keV) and calculated the net flux in photons s–1 cm−2 using a step of ∼0 7 in the four 90∘ sectors with 1″ inner radius and 15″ outer radius with dmextract, while the background counts were calculated from the 40″ radius source-free circular region located on the same CCD chip mentioned in Section 2.
As the NE sector shows least affection from the excess emission in all three bands of NGC 1068 observations, we normalized the radial profiles of NGC 1068 and Her X-1 based on the average count rate across bins 7–9 of the NW profile of NGC 1068, which correspond to radial distances of approximately 5 9−7
9−7 3. The resulting radial profiles are shown in Figure 3, while the 0.5–3 keV band traces the soft X-ray emission, the 6.3−6.5 keV band represents the neutral Fe Kα emission, and the 6.55−6.75 keV band represents the ionized Fe He-like Kα emission.
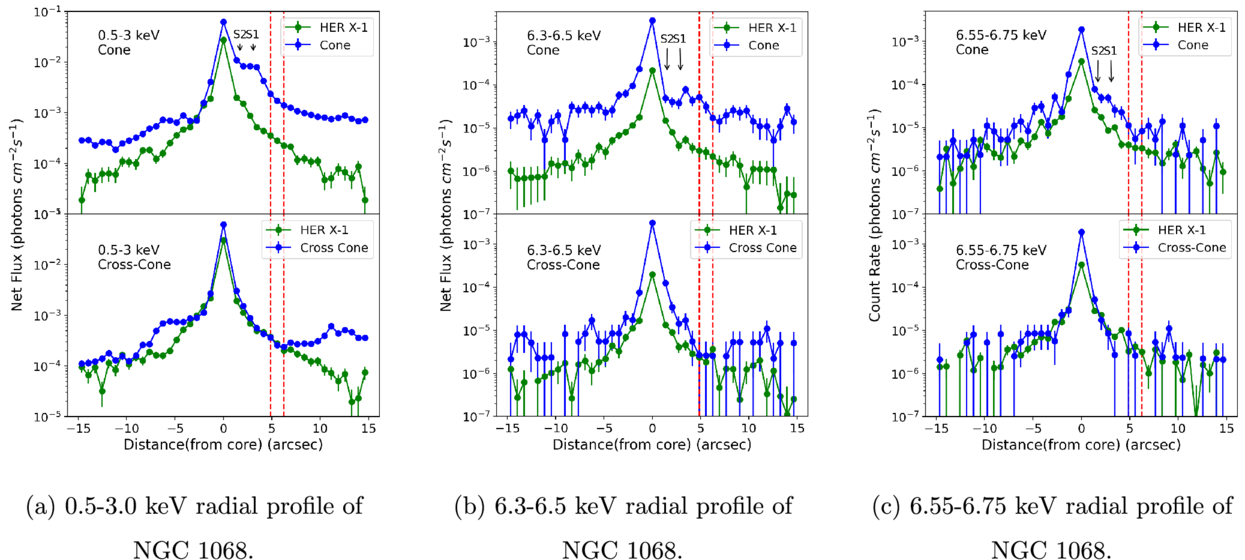
Figure 3. (a) 0.5–3.0 keV radial profile; (b) 6.3–6.5 keV radial profile; (c) 6.55–6.75 keV radial profile. Cone and cross cone demonstrate the radial profile of NE–SW and NW–SE directions. To compare with, we used Her X-1 (green line) to represent the radial profile of a point source, and its flux was normalized to NGC 1068 (blue line). The net flux was extracted using a step of ∼0 7 in the four 90∘ sectors with 1″ inner radius and 15″ outer radius with dmextract. The position of the S1 and S2 blobs was noted with arrows.
Download figure:
Standard image High-resolution imageFigures 1(b) demonstrate that the soft X-ray emission predominantly extends in the cone direction. Our radial profile in Figure 3(a) shows that the net flux of NGC 1068 remains significantly higher than Her X-1 in the 0.5–3.0 keV band in the two directions at greater distances (∼15″) from the source center. We noticed two bumps located at ∼3″−10″ in SE and >5″ in NW, while the radial profiles of NGC 1068 and Her X-1 were nearly the same inside the central 2 4 region in the cross cone. This excess emission in the cross cone is likely associated with the intrinsic X-ray emission from the spiral arm of NGC 1068, although contributions from systematic uncertainties and PSF wings may affect this interpretation. Consequently, the portion of the radial profile in the NE–SW region that exceeds its perpendicular direction likely reflects the extended nature of NGC 1068’s X-ray emission, as suggested by its alignment with the ionization cone. In the 0.5–3.0 keV band, the NE region displays higher X-ray flux, with a plateau observed at the positions of the S1 and S2 spots, consistent with previous results. Conversely, in the SE region, no obvious structure over the PSF was observed inside 4″, while a protruding structure was observed >5″ from the center, which may be related to the X-ray emission from the spiral arm, the same as the cross cone.
We did not find obvious differences between the radial profile of NGC 1068 and Her X-1 in 6.3–6.5 and 6.55–6.75 keV bands in Figures 3(b) and (c). In the 6.55–6.75 keV band, we also noticed a small bump at the position of S1 and S2, as we cannot rule out the influence of PSF and potential pileup effects, whether this bump is associated with the extended soft X-ray emission in the same direction needs to be further investigated using data with higher resolution.
We use the radial profile of HER X-1 as a PSF reference for qualitative comparison. Although the HER X-1 data may not have been obtained strictly on-axis, visual inspection reveals no significant asymmetry in Figure 3. Since this reference is used only for visual comparison with NGC 1068, whose extended emission exhibits strong directional variation, minor asymmetries in the HER X-1 profile are not expected to have a substantial impact on our interpretation.
To further examine the spatial distribution of flux, we divided the annular region extending 1″−15″ from the center of NGC 1068 into multiple 10∘ sectors and extracted the net flux of each sector with dmextract. Our result was presented in Figure 4. Colored dashed lines in Figure 4 indicate the angle direction of the two blobs identified within the image, which align with the direction of peak X-ray flux in the extended region in the 0.5–3.0 keV band. In the 0.5–3.0 keV band, the NE direction shows substantially higher flux compared to other regions. A prominent bump is observed in the opposite direction (SW) of the X-ray extended region, from 250∘ to 350∘, peaking at 300∘. This feature might align with the direction of a counterflow if the extended X-ray emission in the NE direction is interpreted as an outflow. However, the nature of the NE emission remains uncertain, and alternative explanations, such as localized density enhancements or the interaction between jet-driven shocks and surrounding structures, could also account for the observed features. Unlike the soft 0.5−3.0 keV band, the angle distribution of iron lines (6.3−6.5 and 6.55−6.75 keV bands) in Figures 4(b) and (c) showing a similar peak flux in NE and SW directions, while the emission in the SW direction seems to be slightly higher, convincing with our results in Figure 3 that the SW direction has more iron emission. The positions of the two bright spots, S1 and S2, correspond to the locations of two maxima at 80∘–150∘.
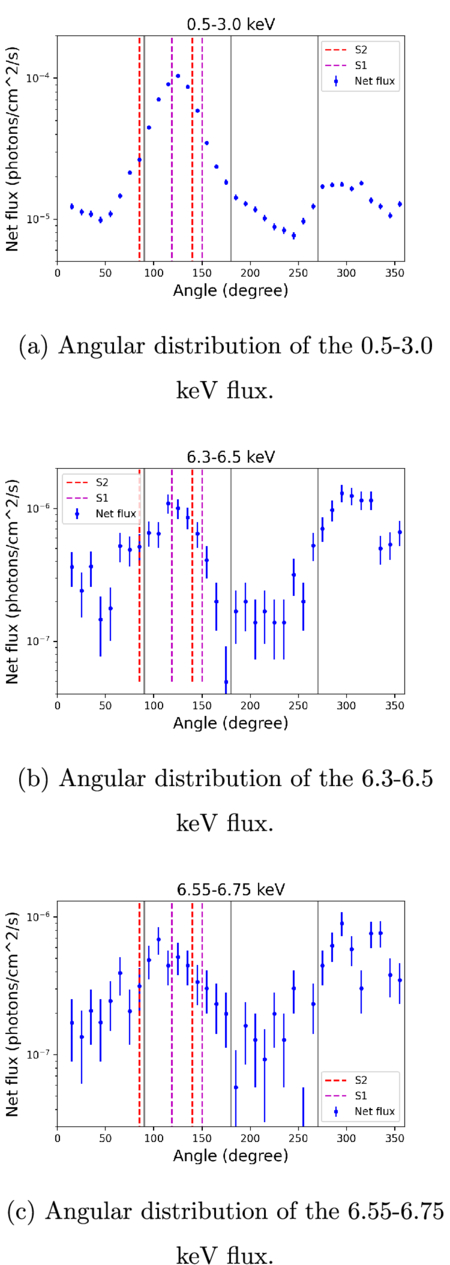
Figure 4. Angular distribution of the 0.5–3.0 keV flux (a), the 6.3–6.5 keV flux (b), and the 6.55–6.75 keV flux (c). The angle in the graph increases clockwise from 0∘ to 360∘ with a step of 10∘ (starting from the west). The dashed lines represent the angle position of S1 and S2 blobs, while the three solid lines divide the figure into the four directions (NW: 0∘−90∘, NE: 90∘−180∘, SE: 180∘−270∘, SW: 270∘−360∘). The flux was extracted from an annulus region centered on the X-ray core with 1″ inner radius and 15″ outer radius with dmextract.
Download figure:
Standard image High-resolution imageWe extracted the net flux from the 1″ radius circle region located at the center of the galaxy (core) and the annulus region with 1″ inner radius and 15″ outer radius (outer) as well as S1 and S2 blobs in three bands: 0.5−3.0, 6.3−6.5 keV (neutral Fe Kα) and 6.55−6.75 keV (ionized Fe Kα). The outer region was then divided into four 90∘ regions (NW: 0∘−90∘, NE: 90∘−180∘, SE: 180∘−270∘, SW: 270∘−360∘, starting from the west), to show the differences in directions. Our result was listed in Table 2.
Table 2. Net Flux for 0.5−3.0, 6.3−6.5, and 6.55–6.75 keV Band of the Regions
| Regiona | 0.5–3.0 keV | 6.3–6.5 keV | 6.55–6.75 keV |
|---|---|---|---|
| (×10−6 photons cm–2 s–1) | |||
| S1 | 107.3 ± 1.7 | 0.6 ± 0.1 | 0.3 ± 0.1 |
| S2 | 72.1 ± 1.4 | 0.2 ± 0.1 | 0.5 ± 0.1 |
| 1″Core | 599.0 ± 4.1 | 32.1 ± 1.0 | 23.4 ± 0.9 |
| 1″−15″ Outer | 908.5 ± 5.1 | 18.3 ± 0.8 | 11.1 ± 0.6 |
| NW | 111.0 ± 1.8 | 2.4 ± 0.3 | 1.4 ± 0.2 |
| NE | 562.7 ± 4.0 | 6.3 ± 0.4 | 3.9 ± 0.4 |
| SE | 110 ± 1.8 | 2.4 ± 0.3 | 1.7 ± 0.3 |
| SW | 120.0 ± 1.9 | 7.1 ± 0.5 | 4.0 ± 3.8 |
Note.
aWe used the same regions in Figure 1, with a 1″ radius circle region located at the center of the galaxy (core) and an annulus region with 1″ inner radius and 15″ outer radius (outer). All the flux of the regions was calculated with dmextract, with a background extracted from the 40″ radius circle region.Download table as: ASCIITypeset image
To illustrate the influence of Chandra PSF, we extract the flux of Her X-1 from 1″ radius circle and the annulus region with 1″ inner radius and 15″ outer radius using dmextract. We found that approximately 50% of the 0.5−3.0 keV flux within the 15″ radius circular region centered on Her X-1 originates from the outer region between 1″ and 15″ radius. While T. J. Gaetz et al. (2004) reported a pileup fraction of ∼5% for the zeroth-order image of Her X-1, the flux contribution from the annular region between 1″ and 15″ would then correspond to approximately 48.8% of the total flux within the 15″ radius circle. Notably, this value should still be considered an upper limit, since the actual pileup impact could be more complex than assumed.
Table 2 shows that in the 0.5−3.0 keV soft X-ray energy band, the soft flux from the external annular region of 1″−15″ radius was ∼1.5 times that of the 1″ radius core and the NE region flux accounts for approximately the same as the core region while the other three regions (NW, SE, SW) give lower flux, showing that most of the soft emission was from the core and NE region.
If we consider ∼10% pileup fraction inside the 1″ radius core of NGC 1068 according to R. Nakata et al. (2021), the original 0.5− 3.0 keV core flux should be ≃658.9 × 10⁻⁶ photons cm−2 s−1, and the NE flux should be 405.7 × 10⁻⁶ photons cm−2 s−1 if the whole outer region contains ∼48.8% PSF flux. Such a result indicates that the estimated soft flux from the NE direction was therefore ∼2/3 of the core flux. Although this value likely represents an upper limit due to potential pileup effects, it still suggests that a considerable portion of the soft X-ray emission in NGC 1068 originates from the extended region.
The emission of iron lines (6.4 keV iron Kα and 6.67 keV iron He-like Kα) is more concentrated in the central region; this is consistent with the spatial structures revealed by the radial profiles and angular distributions in Figure 3. The external region from 1″ to 15″ still contributes a flux ∼1/2 of that in the central 1″ region, as shown in Table 2, with most of this extended emission distributed along the NE–SW direction. However, such estimates are subject to uncertainties due to pileup and PSF scattering. In particular, we note that the reference PSF used in this study, derived from Her X-1, suffers from mild pileup in the central region, which may lead to an overestimation of the flux in the PSF wings.
According to the Chandra Proposer’s Observatory Guide (Chandra X-ray Center 2024), approximately 90% of the encircled energy lies within 1 0 at the ∼0.5−3.0 keV and 2
 5 at 6.4 keV, while our measurement from Her X-1 shows a significantly larger fraction (∼48.8%) beyond 1″ across 0.5−3.0 keV band, indicating a possible distortion due to pileup. This suggests that the flux fraction measured in the extended region based on the Her X-1 PSF may be underestimated. Consequently, the inferred contribution of emission from the external region of NGC 1068 likely represents a lower limit, and the actual extended emission could be even more significant.
3.2. Spectral Analysis
To characterize the X-ray emission, we performed 0.5−8 keV spectral fitting on the Chandra ACIS-S data. For each observation, we extracted a core spectrum using a 0 6 circular region (Section 2) centered on the galactic nucleus. Spectra were also extracted from two box regions (Section 2) shaped to enclose the prominent S1 and S2 blob features seen in the images (Section 3.1). The CIAO combine_spectra script was utilized to sum the individual source and background spectra over all observations, along with their associated response files, to improve the signal-to-noise ratio.
The combined core spectrum was binned to a minimum of 30 counts per channel, while the lower-count blob spectra were binned to two counts minimum to provide enough statistics for fitting. Spectral modeling was carried out with Xspec (v12.13.0), including neutral Galactic absorption with column density fixed at nH = 2.59 × 1020 cm−2 (HI4PI survey; HI4PI Collaboration et al. 2016) in all fits. The chi-square statistic (χ2) was used to determine the best-fitted parameters for the core spectrum with a 90% confidence range in Xspec (K. A. Arnaud 1996). And for the two-count binned spectrum, we used the Cash statistic (W. Cash 1979) instead, which provides a more accurate result for low count-rate spectra.
3.2.1. Core Spectra
Numerous studies over the past decade have examined the complex high-energy emission components of NGC 1068. The 0.5–8 keV spectrum exhibits signatures of both neutral and ionized reflection, along with prominent emission lines. The current consensus points out that the continuum includes two components (K. Iwasawa et al. 1997; K. Pounds & S. Vaughan 2006; F. E. Bauer et al. 2015):
Reflection from dense, neutral matter within the obscuring torus and a scattered component (e.g., H. Netzer & T. J. Turner 1997 and M. Guainazzi et al. 2000). These cold, Compton-thick clouds produce the strong narrow 6.4 keV Fe Kα line via fluorescence, along with the Compton hump peaking around 20–40 keV. The high column densities (nH > 1.5 × 1024 cm−2) require transmission through gas near the dust sublimation radius within the oriented AGN structure.
For our initial spectral analysis, we adopted a phenomenological model combining the former two continuum components. The cold, dense reflector was modeled with PEXRAV (P. Magdziarz & A. A. Zdziarski 1995), while the scattered primary X-ray emission was modeled with a simple power law. Additionally, we included several Gaussian emission lines to model the distinct Fe K features present between 6.0 and 7.0 keV. As the core spectrum likely suffers from pileup given the bright pointlike flux, we accounted for this distortion using the pileup model (J. E. Davis 2001). We fixed the fr_time parameter to 2.5 s and alpha to 0.25, following R. Nakata et al. (2021). The other parameters in the pileup model were kept to be the default value. We also included an intrinsic neutral absorber (zTbabs), allowing the column density to vary, representing the potential absorption in the galaxy itself. The cosmological redshift was fixed at 0.0038 for NGC 1068 based on the NASA/IPAC Extragalactic Database value. We tied the PhoIndex in power-law and PEXRAV together through our fitting. The cutoff energy was set to 300 keV, and the reflect fraction was set to −1 in the PEXRAV model. The angle of the line of sight was fixed to 63∘ (G. Matt et al. 2004) in our models. While we allowed the Fe_abund to vary, the overall abundance (abund) was held constant at 1, representing the solar abundance. To account for key spectral features, we incorporated four redshifted Gaussian lines to represent the 6.4 keV Fe Kα, 6.67 keV Fe He-like Kα, 6.97 keV Fe H-like Kα, and the 7.07 keV Fe Kβ lines. However, due to the low signal-to-noise ratios above 7 keV, we fixed the line center energies of the last two Gaussian lines, assigning them zero width.
NGC 1068 has a complex shape in its soft X-ray (<3 keV) band, and several studies have pointed out that it contains multiple components. R. Nakata et al. (2021) fitted the soft X-ray continuum with a phenomenological model using a 0.4 keV thermal bremsstrahlung zbremss plus several emission lines between 0.8 and 4 keV. Notably, S. Grafton-Waters et al. (2021) analyzed the 2000 and 2014 XMM-Newton/RGS spectra using four PION photoionized plasmas with varying  values, supplemented by a collisionally ionized component to account for additional emission lines. Inspired by these studies, we modeled the soft excess in NGC 1068 using two hot plasma (APEC) models with distinct temperatures, both set to solar abundance (fixed at 1).
Hence, our spectral model is
pileup × Tbabs × zTbabs × (APEC1 + APEC2 + powerlaw + PEXRAV + n × zgauss).
Figure 5 shows our best-fitted 0.5−8 keV spectrum. Our fit presents an acceptable result with χ2/degrees of freedom (d.o.f.) ∼ 1.33. We determined the best-fitted value of PhoIndex to be  and the Fe_abund to be
  , aligning convincingly with findings from previous studies. The best-fitting rest frame line center energies for the neutral Fe Kα and Fe He-like Kα line were found to be
  keV and
  keV, respectively. We did not include the ∼6.2 keV Fe Kα Compton-shoulder and the Ni Kα line, as identified in prior studies (e.g., I. Pal et al. 2022), due to significant noise at these energies. The line width of the neutral Fe Kα was found to be
  eV in our fitting result, and
  eV for the ionized Fe He-like Kα. Additionally, the extra absorption component was calculated to be 0.67 × 1022 cm−2.
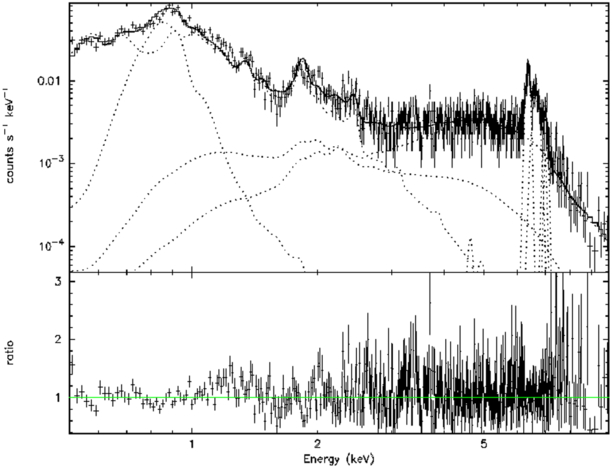
Figure 5. The 0.5−8 keV spectrum of the core region. Fitted with 2 APEC plus power-law plus PEXRAV and emission lines model.
Download figure:
Standard image High-resolution image3.2.2. Blob Spectra
Previous studies have confirmed that the outflow-shaped region presented in Chandra images coincides with the optical extended narrow-line region (ENLR), while A. J. Young et al. (2001) modeled the northeast region with two thermal bremsstrahlung components, combined with narrow lines. They got a good fitting result with the temperatures of the two components at 0.39 and 2.84 keV, and the hard X-ray emission was found to extend ∼20″ in the NE–SW direction. In this paper, we focus on S1 and S2 blobs (Section 3.1) observed in both optical and X-ray image observations.
To examine the influence of pileup, we first tried to fit the S2 spectrum with a single power-law model and a pileup power-law (pileup * powerlaw) model. The single power-law model returned C/d.o.f = 552.52/203, while the pileup model returned C/d.o.f = 555.67/202, with α ≃ 4 × 10⁻⁷, which represents the probability that a piled event is not treated as a bad event (J. E. Davis 2001), indicating that the pileup effect is not significant in the S2 region. Considering that the S1 region is much farther away from the core region compared with S2, and adding an extra pileup model did not improve the fit, we decided not to include the pileup model in the fit of the S1 and S2 spectra.
Our 0.5−8 keV X-ray spectrum fitting result of the two blobs is shown in Figure 6 and Table 3. Through the previous result, we noticed that the 6−7 keV Fe lines can be clearly identified in the spectrum. Hence, we first tried a single power-law model with two Gaussian lines to fit the spectrum. A zTbabs model was included to account for the potential absorption in NGC 1068. As the two blobs provide an inferior quality spectrum at hard energies, it seems difficult to get a reasonable fit to the Fe line widths, so we fixed the σ to zero for both neutral Fe Kα and ionized Fe He-like Kα, and only their center energy to vary during our fitting. We did not include other emission lines here due to the lack of data points above 7 keV. This model returned a result with C/d.o.f = 599.99/218 for S1 and C/d.o.f = 443.42/198 for S2, with a bad constraint on the continuum, indicating at least one more component is necessary to fit the continuum. We noticed that the 4−6 keV spectrum seems to be dominated by a series of narrow emissions. As our work focused on the softer 0.5−3.0 keV and iron lines, we decided not to fit these 4−6 keV complex lines to simplify our spectrum model. We noticed that due to the relatively poor quality of the spectral data, it is hard to distinguish the ionized Fe He-like Kα from the iron lines in S1 spectra; thus, we fixed the ionized Fe He-like Kα line to 6.67 keV for S1. We also found that the nH of ztbabs component of S1 was nearly 0 (≃2 × 10⁻¹⁸), so we decided to exclude the ztbabs component in the S1 model by fixing the nH of ztbabs at 0.
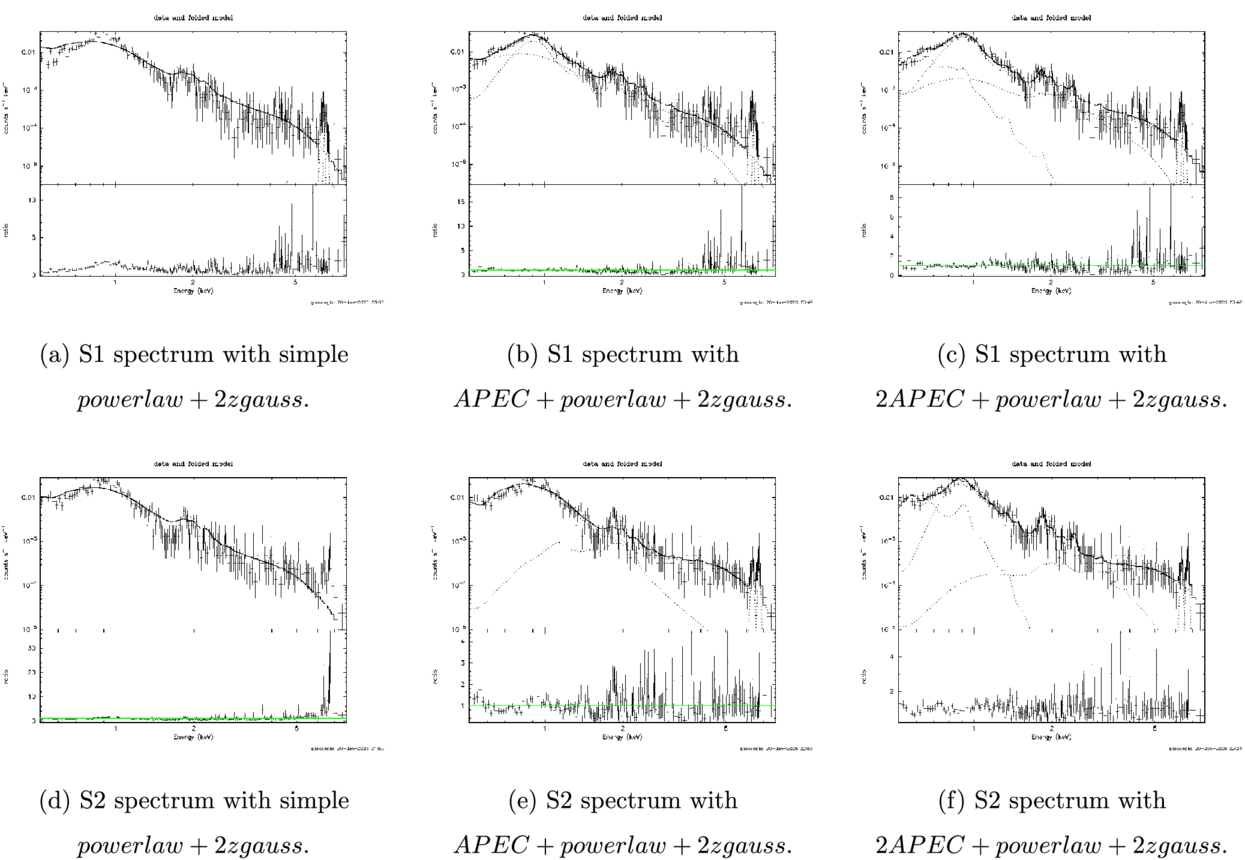
Figure 6. The 0.5–8 keV spectrum fitting result for S1 and S2 blobs.
Download figure:
Standard image High-resolution imageTable 3. Fitting Result for the Two Blobs
| Parameters | Unit | S1 | S2 |
|---|---|---|---|
| nH | 1022 cm−2 | 0a |

|

| keV |

|

|
 b
b
| cm−5 |

|

|

| keV |

|

|
 b
b
| cm−5 |

|

|
| PhoIndex | ... |

|

|
| Npowerlawb | keV−1 cm−2 s−1 |

|

|
| EFeKα | keV |

|

|
| NFeKαb | cm−2 s−1 |

|

|
| EionFeKα | keV | 6.67c |

|
| NionFeKαb | cm−2 s−1 |

|

|
| C/d.o.f. | ... | 292.42/216 | 244.94/194 |
Notes.
aThe ztbabs component is not included in the S1 model (nH fixed at 0); see Section 3.2.2 for further details. bN represents the normalization of each component. cThe line center of Fe He-like Kα was fixed at 6.67.Download table as: ASCIITypeset image
We further introduced one additional APEC plasma component to fit the soft X-ray band, and our results were C/d.o.f = 325.06/218 for S1 and C/d.o.f = 318.05/196 for S2. J. Wang et al. (2012) fitted the S2 blob (Cloud HST-G in their paper) spectrum, revealing a simple ionization component cannot provide a reasonable fit, indicating that additional two thermal plasma component may necessary to improve the fit. Following their result, we added another APEC plasma component to our model. The model for the two blobs is
Tbabs × zTbabs × (APEC1 + APEC2 + powerlaw + zgauss + zgauss).
Our final fitting yields improved statistics with C/d.o.f. = 292.42/216 for S1 and C/d.o.f. = 244.94/194 for S2. As shown in the residual plots, the most significant deviations are concentrated in the 4−6 keV band, where multiple spectral components overlap and model degeneracy may arise. While we adopt a single, self-consistent model across the entire 0.5−10 keV range without independently refitting the 4–6 keV region, we acknowledge that the residuals in this energy range highlight potential limitations in the current model. To assess whether these residuals might affect the interpretation of the soft X-ray spectrum, we attempted a Monte Carlo simulation to propagate uncertainties across bands. However, due to the limited signal-to-noise ratio and the number of free parameters, the simulation did not yield statistically meaningful constraints.
Nevertheless, the residuals in the 0.5−3.0 keV band—our primary focus—remain minimal and exhibit no systematic trends, suggesting that the conclusions we draw regarding the soft X-ray emission from S1 and S2 are not strongly biased by uncertainties in the higher-energy range. We have noted these modeling limitations and recommend future studies with deeper exposures or higher-resolution data to better constrain the broadband spectral structure.
The analysis reveals distinct hydrogen column densities for S2 ( ) and S1 (nH ≃ 0), indicating denser or more obscured material around S2. Both blobs exhibit dual-temperature structures in their thermal plasma components, with S1 showing temperatures of
  keV and
  keV, and S2 at
  keV and
  keV, indicating a complex, multiphase hot gas environment. We noticed that for S2, the neutral iron line is at 6.35 keV and the ionized iron He-like kα line at 6.71 keV, shifts with ΔEneutral ∼ −50 eV and ΔEionized ∼ +40 eV. Such shifts may arise from the Doppler motion of the blob, but due to the poor quality data in this band, we cannot give a precise conclusion.
The spectral indices are  for S1 and
  for S2. The lower spectral indices of S2 suggest that our initial model may have oversimplified the complex environment of the narrow-line region (NLR) or underestimated certain parameters, especially the absorption. The S2 spectrum may also contain a reflection component. Considering that S2 is close (∼1
 5) to the core, its spectrum may be heavily affected by the PSF wings of the central core; thus, the S2 spectrum may also contain a reflection component, which leads to a lower spectral index.
4. Discussion
4.1. The Soft X-Ray Emission of NGC 1068
The soft X-ray (0.5–3 keV) image reveals the emission extends at least 10″ in the NE direction (Figures 1(b) and 3(a)). Similar extended structures have also been observed in several nearby Seyfert galaxies. Notably, G. Grünwald et al. (2023) provide evidence for the existence of ionized outflows from several Rg to kiloparsec scales in several NLSy1s. Furthermore, J. Wang et al. (2012) highlighted that the presence of large-scale extended ionized gas in the NLR of NGC 1068 indicates the existence of jet/outflow–cloud interactions. In this process, shocks heat the NLR gas, producing X-ray radiation and various emission lines. M. L. Jones et al. (2020) studied the extended X-ray emission in the nearby Compton-thick Seyfert 2 galaxy NGC 7212, noting that the X-ray emission extends to kiloparsec scales (4.5 kpc). Their spectral model also shows the presence of high- and low-temperature thermal components, with associated shock velocities of ∼850 and ∼2400 km s−1. Similarly, A. Trindade Falcao et al. (2023) found comparable shock velocities in their study of NGC 5728, indicating consistent patterns of large-scale ionized gas and shock interactions in these galaxies.
Our fitting results for the S1 and S2 spectra indicate that the extended soft X-ray emission region encompasses a complex plasma environment. As the cooler 0.1−0.2 keV gas component likely originates from dense, cooler gas clouds and clumps surrounding the NLR, the ∼0.7−0.8 keV high-temperature plasma component may stem from diffuse gas outflows ionized by the direct radiation of the central AGN or collisional ionized plasma (i.e., the potential kT = 0.4−0.9 keV component in A. Kinkhabwala et al. 2002). M. L. Jones et al. (2020) estimated a corresponding ∼850 km s−1 shock velocity of ∼0.8 keV thermal emission in NGC 7212 by assuming  , where μ is the mean molecular mass of the plasma and k represents the Boltzmann constant. Using their method, we find the plasma temperatures of the S1 and S2 blobs in our work associated with shock velocities of approximately 400–800 km s−1, consistent with previous [O III] velocity measurements (J. Shin et al. 2021; L. R. Holden & C. N. Tadhunter 2023). Hence, we further suggest that the soft X-ray structure in S1 and S2 blobs is possibly associated with the interaction between large-scale X-ray outflows and the ISM, and the presence of a dual-temperature plasma component may likely suggest the existence of partially ionized gas produced by disk winds or jet–ISM interactions in the ENLR. Similarly, simulations by D. Mukherjee et al. (2021) report that the hot thermal component could be from the jet–ISM interactions, where the outflows of diffuse ionized gas with speeds of ∼1000 km s−1 may be from the interaction between the jet-driven shocks and the cold ISM.
For the <1″ core region, our results indicate the necessity of a set of hot plasma components to fit the soft X-ray spectrum. The fitting results for the two APEC plasma components in the core region spectrum show  keV and
  keV, with
  and
and  . The temperatures of the core spectrum are similar to those in the extended region containing S1 and S2, indicating these components from the three regions may have a potentially common origin. As our dual-temperature plasma model phenomenologically fits the soft X-ray spectrum of the core region, recent high-resolution images from satellites like the Chandra X-ray Observatory and the Hubble Space Telescope have revealed several clump structures within the central 1″ (<72 pc) region of NGC 1068 (J. Wang et al. 2012; T. C. Fischer et al. 2018; P. Vermot et al. 2023), indicating the core region has a similar complex environment to the ENLR outflow, which requires higher spectral and spatial resolution data for further analysis.
As described in Section 1, the reflection and warm corona model has successfully explained the soft X-ray excess in several sources, like Ark 120 (G. Matt et al. 2014), Mrk 478 (A. Zoghbi et al. 2008), and Mrk 335 (M. L. Parker et al. 2014). However, both explanations occur in regions very close to the central supermassive black hole and require the involvement of the accretion disk. As a Compton-thick Seyfert 2 galaxy, the core of NGC 1068 is believed to be heavily obscured with an absorbing component with nH > 1024 cm−3, suggesting that the center of NGC 1068 is surrounded by dense gas and dust, and it may be difficult for us to directly observe the disk and corona emission.
After considering the effect of PSF and pileup, our results show that the net soft X-ray emission flux in the NE sector is ∼2/3 of the 1″ radius core (Section 3.1 and Table 2). Given that the diameter of 1″ (∼72 pc) radius core region used in our analysis is much larger than the geometric scale of the disk and corona, it is plausible that this region contains a significant amount of ionized clouds, similar to the S1 and S2 blobs observed in the outer region. Given the similarities in ionized structures between the spectrum of the core and the two blobs in the 1″−15″ annular region, it is likely that a significant portion of the remaining soft X-ray emission from the <1″ core region can also originate from similar processes. The outflow gas could be heated to higher temperatures as it propagates outward from the center of the galaxy through shocks or collisional ionization, generating soft X-ray emission, which may significantly contribute to the so-called “soft excess” component observed in the core spectrum.
It is worth noting that our spectral model only quantifies this possibility. The complex iron line structure observed in the nucleus of NGC 1068 indicates the presence of a reflective component. Also, the detection of extended X-ray emission both along and across the ionization cones in sources such as ESO 428-G014 and NGC 7212 supports a clumpy torus structure that allows nuclear radiation to escape and interact with the ISM on kiloparsec scales, while these sources are also accompanied by radio jets, which is similar to NGC 1068 (J. Ma et al. 2020).
For the core region of NGC 1068, we cannot further differentiate between the AGN and its surrounding complex gas structures, and therefore, we cannot exclude the potential contributions of reflection and the warm corona to the soft X-ray emission. However, considering that the center of NGC 1068 is heavily obscured, the thermal emission of partially ionized clouds for jet–ISM interactions discussed earlier is likely to play a dominant role in the core spectrum.
However, we note that the spiral-like structures observed in the soft X-ray band in Figure 1 are not aligned with the collimated jet axis. In particular, Figure 1(a) reveals extended soft X-ray emission features located at approximately 4″–8″ from the nucleus in the southeast direction, and beyond ∼7″ in the northwest. These X-ray features are spatially coincident with the spiral arm morphology seen in HST optical images and with ringlike structures identified in Atacama Large Millimeter/submillimeter Array 100 GHz observations of NGC 1068, which are interpreted as star-forming regions with an estimated star formation rate of SFR ≃ 3.2 M⊙ yr−1 (Y. Nagashima et al. 2024).
A similar situation has been reported in the Circinus galaxy, where D. A. Smith & A. S. Wilson (2001) established a connection between extended soft X-ray emission and a circumnuclear starburst ring with a radius of ∼150–250 pc. In that case, the soft X-ray spectrum was best described by a collisionally ionized plasma in equilibrium, and notably lacked strong hard X-ray components. This scenario appears to be analogous to NGC 1068, where, as seen in Figures 1(b) and (c), there are no significant hard X-ray structures corresponding to the locations of the extended soft X-ray emission in the cross-cone directions. This morphological and spectral resemblance supports the interpretation that the spiral-like soft X-ray filaments in NGC 1068 may arise from star formation activity in the galactic disk.
In addition to star-forming regions, other stellar processes can also contribute to the soft X-ray emission in spiral-like structures of NGC 1068. Supernova remnants (SNRs) and compact objects such as XRBs and ultraluminous X-ray sources (ULXs) embedded in the galactic disk are also potential contributors. D. A. Smith & A. S. Wilson (2003) reported that Chandra detected approximately 84 point sources within NGC 1068, of which 66 are located in the optical disk and five are classified as ULXs with LX > 1039 erg s−1. J. Ma et al. (2020) mention that a hot cocoon formed from jet–cold disk ISM interaction may also be reasonable for the observed extended X-ray emission in the cross direction of CT Seyfert AGNs. Collectively, these processes suggest that a substantial portion of the extended soft X-ray emission observed in the spiral arms and disk plane of NGC 1068 may not be solely attributed to AGN-driven mechanisms, but may also be powered by ongoing star formation and its associated feedback.
Due to limitations in the angular resolution of most X-ray satellites, the fine structures around nearby AGNs are often indistinguishable, resulting in these sources appearing as pointlike in their X-ray images. As a result, the extracted X-ray spectra likely contain contributions from both the central AGN and the extended regions. This suggests that the observed X-ray spectra of these sources likely contain X-ray emissions from the outflow clouds, with ionized gas from the NLR or regions that are closer to the central black hole and contributing significantly to the observed soft X-ray excess in their spectral energy distributions through jet/outflow–ISM interaction.
4.2. The Fe Emission
In our image analysis, we found that the emission of the neutral iron Kα line extends to scales of at least 10″ away from the core, consistent with the range reported by C. Andonie et al. (2022; 795 ± 176 pc). Similar extended emission of the iron Kα line on scales of ∼1 kpc has also been observed in other Compton-thick Seyfert galaxies, such as NGC 4151 (J. Wang et al. 2011) and NGC 4388 (K. Iwasawa et al. 2003). A. Marinucci et al. (2012) showed that the iron Kα line of NGC 4945 extends to scales of ∼300 pc, likely originating from the NLR or the galaxy disk. R. Nakata et al. (2021) extracted X-ray spectra of five regions around the AGN of NGC 1068 within 1″−2″ and found that the flux of the iron Kα line in these regions accounts for ∼14% of the AGN’s. The emission of the iron Kα line also appears in the spectra of S1 and S2 (Figure 6), while F. E. Bauer et al. (2015) also noted that about 30% of the iron Kα line emission from NGC 1068 comes from positions beyond >2″ from the core. However, C. Andonie et al. (2022) pointed out that the pileup effect and influence of Chandra PSF can lead to overestimation of the observed iron flux at these regions. Although our results in Table 2 may overestimate the iron flux from the 1″−15″ region through such an effect, our radial profile in Figures 3(b) and (c) kept the possibility that the extended emission of the iron Kα line likely originates from more distant material, such as NLR clouds and the ISM distributed on larger scales within the host galaxy, the higher iron flux in NE–SW direction also indicates that the iron emission at such a distance may correspond to the similar jet–ISM interaction process as the soft 0.5−3.0 keV X-ray emission.
From the 6.3−6.5 and 6.55−6.75 keV flux angle distribution (Figure 4), we find that although the iron emission seems to be weaker in the NW direction, it may be possible to exhibit a more symmetric feature in the NE–SW direction compared with the extended soft X-ray emission, which mainly comes from the NE direction. If the extended soft X-ray emission is obscured by the gas and dust in the disk in the SW direction, it may result in a decrease in X-ray flux at farther scales, while hard X-rays can penetrate the obscured material, similar to the molecular disk model described by E. Galliano et al. (2003), which supports our hypotheses that the iron emission shows a more symmetric profile and soft X-ray emission extending to farther distances is not observed in the SW direction.
Generally, the neutral Fe fluorescence traces illumination of the surrounding matter by the central engine. Potential sites for this reprocessing include the NLR clouds, clumps within the torus structure, or even more distant gas in the galactic disk. The narrow Fe Kα emission in 38 nearby AGNs is well discussed in C. Andonie et al. (2022), providing a range of potential velocity dispersions with νFWHM ≃ 1300−5000 km s−1, indicating the Fe Kα emission originates inside the dust sublimation radius, possibly associated with materials in the broad-line region or accretion disk. Our fitting results in a line width of  eV for the neutral Fe Kα line in the core spectrum, corresponding to a velocity dispersion of νσ ∼ 1667 km s−1 if we consider that such a line width is due to the Doppler broadening. If such a velocity dispersion is from the Keplerian motion of the dense clouds, we can rule out a distance of ≃0.248 pc from the clouds to the central black hole, near the dust sublimation radius reported in C. Andonie et al. (2022), adopting a MBH = 1.6 × 10⁷M⊙ for NGC 1068 (F. Panessa et al. 2006), indicating the Fe Kα line in the core spectrum also favors a torus origin, reflecting a high covering factor of cold, dense gas illuminated by the central engine.
Additionally, we believe that other processes may also contribute to the emission of iron lines in these regions. K. A. Weaver et al. (2025) discussed the ∼10 kpc extended iron emission in NGC 4945, showing a morphology inconsistent with typical starburst-driven outflows or SNRs. Instead, the authors suggest that the extended Fe Kα emission originates from cold molecular material in the galaxy’s disk or halo, illuminated by past AGN activity. They interpret this as fossil radiation, a relic of a past AGN outburst that has since declined, implying episodic AGN feedback in NGC 4945. J. Ma et al. (2020) describe the extended Fe Kα emission in ESO 428-G014 and NGC 2110 as a result of electron scattering off dense ISM clouds in the host galaxy. In the case of NGC 7212, M. L. Jones et al. (2020) modeled the extended iron emission with a clumpy torus structure, which allows emission to be transmitted to kiloparsec scales. We hope that future high-resolution, multiwavelength studies will provide deeper insights into the physical origin of extended iron line emission in active galaxies.
5. Summary
In this work, we conducted a study of the extended X-ray emission from NGC 1068 using data from the Chandra X-ray Observatory. We extracted X-ray images of NGC 1068 in four energy bands: 0.5−10.0, 0.5−3.0, 6.3−6.5, and 6.55−6.75 keV. We also extracted the angle distribution and radial profiles of the regions outside the central 1″ in the 0.5−3.0, 6.3−6.5, and 6.55−6.75 keV bands. We focused on the soft X-ray emission observed in NGC 1068 and analyzed the spectra of the central 1” region and two blobs, S1 and S2. Our main findings can be summarized as follows:
(1) We have observed extended structures emanating from the core in both the soft X-ray (0.5−3 keV) and hard X-ray (6.3−6.5, 6.55−6.75 keV) energy bands images (Figure 1). The soft X-ray emission extends predominantly in the NE direction with a distance of at least ∼10″ (700 pc), coinciding with the direction of the radio jet (I. M. Mutie et al. 2024). We found that the brighter and more compact soft X-ray emission features, such as the S1 and S2 regions, show good spatial correspondence with structures in the [O III] band image (Figure 2). However, the more extended or spiral-like soft X-ray features appear to lack clearly corresponding bright [O III] emission in our current comparison. We also found that the radiation in the 6.3−6.5 keV energy band extends at least 5″ outward from the core in the NE–SW direction and exhibits a symmetric structure. We suggest that the lack of soft X-ray radiation in the SW direction may be associated with obscuration by the galaxy disk, and we also discussed the possible connection between the galaxy disk and the spiral-like structure seen in the soft X-ray band in Figure 1 and the extended soft X-ray structure in the NW–SE direction.
(2) We fitted the spectra of the core and the two blobs (S1 and S2 in this paper) using a two-temperature thermal plasma model with kT1 ∼ 0.1−0.2 keV and kT2 ∼ 0.7−0.8 keV, and discussed the possible origin of the soft X-ray excess in the core. We noticed that the core and the two blobs exhibit similar plasma temperatures, and that the soft X-ray flux in the NE sector accounts for ∼2/3 of the soft X-ray flux from the core of NGC 1068 within 1″ radius. We cannot further distinguish the structures in the <1″ core region and cannot exclude the contribution from the corona or accretion disk in the soft X-ray band. However, according to our fitting results of the two blobs and results of image analysis, we consider the possibility that the soft X-ray emission in the core likely originates from similar physical processes as the partially ionized plasma from the jet–ISM interactions in the outer regions. As the shock propagates outward from the center of NGC 1068, it interacts with the surrounding ISM, leading to heating and ionization of the diffuse gases. This mechanism provides a novel explanation for the origin of the soft excess in NGC 1068 and similar Seyfert galaxies.
(3) The iron Kα line emission in the spectra of S1 and S2 also suggests that the extended iron Kα emission may come from the interactions between the central radiation and dense gas clouds in the outflow. However, we did not further distinguish whether the clouds in the outflow driven by shocks through the jet–ISM interactions near the core contribute to the iron line radiation, due to the limitations of our models. We also considered the potential contribution from other mechanisms, and we believe future observations with higher spatial resolution can provide more evidence to interpret the extended iron Kα emission in NGC 1068 and other CT Seyfert galaxies.
Acknowledgments
We thank the reviewers for the careful reading of the manuscript and the insightful comments, which have significantly improved the quality of this work. This paper has made use of data obtained from the Chandra Data Archive and the Chandra Source Catalog, contained in doi:10.25574/CDC.337. Software used in this paper is provided by the Chandra X-ray Center (CXC) in the application packages CIAO and Sherpa. HST data were collected from the Mikulski Archive for Space Telescopes (MAST) at the Space Telescope Science Institute. The specific HST observations analyzed can be accessed via STScI (2016). This research is supported by the National Natural Science Foundation of China under grant Nos. 12373015 and 11873035.
Facilities: CXO - Chandra X-ray Observatory satellite, MAST - (managed by STScI).
Software: CIAO (A. Fruscione et al. 2006), Xspec (K. A. Arnaud 1996), CHART (C. Carter et al. 2003), MARX (J. E. Davis et al. 2012).