Abstract
Solar flares fall into two types, with eruptive ones associated with coronal mass ejection (CME) and confined ones without CME. To explore whether there are preflare conditions in terms of magnetic energy and helicity that can effectively determine the types of flares, here we analyzed a suite of related parameters of the reconstructed preflare coronal magnetic field of major solar flares, either eruptive or confined, from 2011 to 2017 near the solar disk center. The investigated parameters include extensive-type quantities such as the total magnetic energy ET, the potential energy EP, the free energy EF, the relative helicity HR, and the nonpotential helicity HJ, as well as the intensive-type indices EF/EP, ∣HJ/HR∣,  , and
, and  , where
  is half of the total unsigned magnetic flux. We have the following key findings: (1) None of the extensive parameters can effectively distinguish the eruptive and confined potential of the preflare coronal fields, though the confined events have averagely larger values. (2) All the intensive parameters have significantly larger average and median values for eruptive flares than the confined events, which indicates that the field for eruptive flares has overall higher degree of nonpotentiality and complexity than that of the confined flares. (3) The energy ratio EF/EP and the normalized nonpotential helicity
  , which are strongly correlated with each other, have among the highest capability of distinguishing the fields that possibly produce a major eruptive or confined flare, as over 75% of all the events are successfully discriminated between eruptive and confined flares by using critical values of EF/EP ≥ 0.27 and
  .
.
Original content from this work may be used under the terms of the Creative Commons Attribution 4.0 licence. Any further distribution of this work must maintain attribution to the author(s) and the title of the work, journal citation and DOI.
1. Introduction
Solar eruptions, mainly including solar flares and coronal mass ejections (CMEs), are violent activity phenomena occurring in the solar atmosphere. During flares, a sudden and catastrophic energy release occurs in a localized region within tens of minutes, producing an almost entire electromagnetic spectrum enhancement, as well as plasma heating and particle acceleration (Fletcher et al. 2011; Benz 2017). On the other hand, CMEs carry massive plasma and embedded magnetic field into the interplanetary space; thus, an Earth-directed CME can interact with the geomagnetic field and cause hazardous space weather. It is now well established that flares and CMEs are different manifestations of explosive release of magnetic free energy in the corona, and they are often associated with each other, but not one-to-one correspondences. Studies show that most of the major flares are accompanied with CMEs (i.e., eruptive flares), while a large number of flares are not (i.e., confined flares). Until now, although many works (e.g., Andrews 2003; Yashiro et al. 2006; Wang & Zhang 2007; Toriumi et al. 2017; Baumgartner et al. 2018; Jing et al. 2018; Duan et al. 2019; Li et al. 2020) have been done, the key factor that causes the difference between the two types of flares is still undetermined.
Since solar eruptions have their root in the evolution of magnetic field in the solar atmosphere, many parameters qualifying the magnetic complexity and nonpotentiality are investigated, which mainly include the twist (Pevtsov et al. 1994; Hagino & Sakurai 2004), electric current (Leka et al. 1993; Wang et al. 1994), magnetic shear (Wang et al. 1994), horizontal gradient of longitudinal magnetic field (Tian et al. 2002), free magnetic energy (Metcalf et al. 2005; Jing et al. 2010; Gupta et al. 2021; Li et al. 2021), and magnetic helicity (Zuccarello et al. 2011; Vasantharaju et al. 2018; Zuccarello et al. 2018; Thalmann et al. 2019a, 2019b; Gupta et al. 2021; Liu et al. 2023). Essentially all the parameters are more or less related to two of them, namely the free magnetic energy, which is the only energy that can power the eruption, and magnetic helicity, which is a global measure of the complexity of the specific field configurations. Thus, these two more intrinsic physical parameters received more attention in the relevant studies.
The free magnetic energy EF measures the energy deviation of the coronal magnetic field from its potential (i.e., current-free) state EP , and it is regarded as the upper limit of the energy that is available in a coronal magnetic configuration for conversion into kinetic and thermal energies (Jing et al. 2009). Therefore, study of EF and its evolution plays an important role in understanding the energy storage and release process during solar eruptions. To obtain EF , it is often required to extrapolate the coronal magnetic field from the observed photospheric vector magnetograms. For example, Jing et al. (2010) showed that there was a positive correlation between EF and the flare index. Based on 38 solar eruptive events, Emslie et al. (2012) found that EF was sufficient to power the flare-accelerated particles, the hot thermal plasma, and the CME. Vasantharaju et al. (2018) demonstrated for a sample of 77 flare/CME cases that the amount of EF and its temporal variation were highly correlated with the flare strength and CME speed. However, as an extensive quantity, EF has its limitations in flare prediction. For instance, Gilchrist et al. (2012) suggested that the certain content of the preflare free energy is not decisive to determine the occurrence of a flare since it is not uniquely related to the complexity of the flare-involved magnetic field.
Magnetic helicity, which measures the overall degree of the geometrical complexity of the magnetic fields, including the twist of the field lines and the mutual linkages of different field lines, is another parameter relevant to the nonpotentiality of the coronal field (Pariat et al. 2017; Thalmann et al. 2019a). The magnetic helicity of a field B within a volume V is defined as HM = ∫V A · B dV, where A is the vector potential and satisfies B = ∇ × A . This definition of helicity is physically meaningful only for magnetically closed systems (that is, without field lines passing through the surface of V). For applications to the solar corona (which is an open system), the relative magnetic helicity HR was defined by Berger & Field (1984) and Finn (1984) as a gauge-invariant form of magnetic helicity with respect to a reference magnetic field, which is naturally given by the potential field EP . In addition, the relative helicity HR can be further decomposed to the nonpotential (or current-carrying) helicity HJ and the volume-threading helicity HPJ (Berger 1999; Linan et al. 2018). Several works suggested that the eruptivity of an active region (AR) was closely related to its HR (e.g., Nindos & Andrews 2004; LaBonte et al. 2007; Smyrli et al. 2010; Tziotziou et al. 2012) and/or HJ (Pariat et al. 2017) content, since eruptive flares seem to contain higher values of preflare HR and/or HJ and the total HR of the AR decreased after eruption (Bleybel et al. 2002).
However, by analyzing the preflare magnetic conditions of three different ARs that produced different types of flares, Sun et al. (2015) concluded that, compared to the extensive-type parameters (such as sunspot area, total magnetic flux, electric current, magnetic energy, magnetic helicity, etc.), the intensive-type parameters regarding nonpotentiality of the core field (such as the ratio of free energy EF
to potential energy EP
) were more important to discriminate the eruptive and confined flares. Recently, based on both MHD simulations (Pariat et al. 2017; Zuccarello et al. 2018) and observations (James et al. 2018; Thalmann et al. 2019b; Moraitis et al. 2019; Thalmann et al. 2020; Gupta et al. 2021), a number of works were devoted to determining the thresholds of the intensive-type parameters that can distinguish different types of flares. In particular, a new intensive-type parameter ∣HJ
/HR
∣ is found to show a strong capability to indicate the eruptive potential of an AR. For example, simulations found that the values of ∣HJ
/HR
∣ for eruptive cases were larger than 0.45 (Pariat et al. 2017) or 0.3 (Zuccarello et al. 2018), while observational studies showed much smaller values from 0.1 to 0.17 (James et al. 2018; Thalmann et al. 2019b). Furthermore, Gupta et al. (2021) also demonstrated that an AR with 〈∣HJ
/HR
∣〉 > 0.1, 〈EF
/ET
〉 > 0.2 (ET
is the total magnetic energy), and  (
( is half of the total unsigned magnetic flux) is likely to produce large eruptive flares.
The aforementioned conclusions are mostly based on single-case analysis or small-sample studies and require testing with investigations of larger samples. Moreover, the key parameters are calculated from coronal magnetic field extrapolations, and thus the inferred results might strongly depend on the quality or reliability of the coronal magnetic field extrapolations. While most of the previous studies used the nonlinear force-free field (NLFFF) extrapolation code based on the optimization method as originally developed by Wiegelmann (2004), there are currently many other methods available for NLFFF extrapolations from the vector magnetograms. Since it has been shown that different methods seem to produce rather inconsistent results between each other (e.g., DeRosa et al. 2009; Régnier 2013; Aschwanden et al. 2014a; Duan et al. 2017; Wiegelmann et al. 2017), any results based on any single NLFFF code must be taken with caution, and more studies with different independent codes are valuable and also necessary for a better inspection. In this paper, we performed a statistical study to better understand the roles of different quantities in characterizing the eruptive or confined potential of ARs. We employed the coronal magnetic field extrapolation code developed by Jiang & Feng (2013), named the CESE–MHD–NLFFF code, which is based on the MHD-relaxation approach, to study a larger sample of 45 major flares, with 29 eruptive and 16 confined. Our results support that the extensive-type parameters cannot effectively distinguish the eruptive and confined potential of the preflare coronal fields, though the confined events have on average larger values. The intensive-type parameters have significantly larger average and median values for eruptive flares than the confined events, which indicates that the field for eruptive flares has overall higher degree of nonpotentiality and complexity than that of the confined flares. Comparing to other intensive-type parameters, we found that both EF
/EP
and  play much more important roles in discriminating the eruptive and confined flares. The rest of the paper is organized as follows: the data and method are presented in Section 2, the results are given in Section 3, and finally a summary is provided in Section 4.
2. Data and Method
In our previous study (Duan et al. 2019), we have performed a statistical survey of the preflare specific magnetic configurations for a sample of major solar flares, either eruptive or confined, with focus on the topology and ideal instability of the magnetic flux rope. In this study, the same sample is used, which has in total 45 flares from 30 different ARs, including 29 eruptive ones (above GOES class M5) and 16 confined ones (above M3.9). The flares are observed by the Solar Dynamic Observatory (SDO; Pesnell et al. 2012) from 2011 January to 2017 December, and all of them occurred within 45° in longitude of the disk center (details of the events are listed in Table 1). For more information about the criteria for event selection, one can refer to Duan et al. (2019) and Duan et al.(2021).
Table 1. List of Events and Their Preflare Parameters
| No. | Flare Peak Time | Flare Class | NOAA AR | E/C a |

| ET | EF1 | EF2 | HR | HJ |
|---|---|---|---|---|---|---|---|---|---|---|
| (1022 Mx) | (1033 erg) | (1032 erg) | (1032 erg) | (1043 Mx2) | (1042 Mx2) | |||||
| 1 | SOL2011-02-13T17:38 | M6.6 | 11158 | E | 1.03 | 0.56 | 1.43 | 1.51 | 0.06 | 1.12 |
| 2 | SOL2011-02-15T01:56 | X2.2 | 11158 | E | 1.43 | 1.09 | 3.04 | 3.19 | 0.77 | 2.88 |
| 3 | SOL2011-03-09T23:23 | X1.5 | 11166 | C | 1.89 | 1.54 | 2.06 | 2.21 | 0.48 | 0.44 |
| 4 | SOL2011-07-30T02:09 | M9.3 | 11261 | C | 1.75 | 0.75 | 1.24 | 1.32 | −0.05 | −0.49 |
| 5 | SOL2011-08-03T13:48 | M6.0 | 11261 | E | 1.67 | 0.67 | 2.28 | 2.40 | 1.04 | 3.22 |
| 6 | SOL2011-09-06T01:50 | M5.3 | 11283 | E | 1.40 | 0.66 | 1.17 | 1.24 | 0.26 | 0.39 |
| 7 | SOL2011-09-06T22:20 | X2.1 | 11283 | E | 1.46 | 0.66 | 1.50 | 1.59 | 0.43 | 1.06 |
| 8 | SOL2011-10-02T00:50 | M3.9 | 11305 | C | 0.84 | 0.48 | 0.64 | 0.69 | −0.66 | −0.58 |
| 9 | SOL2012-01-23T03:59 | M8.7 | 11402 | E | 2.44 | 1.60 | 3.59 | 3.79 | −1.18 | −1.77 |
| 10 | SOL2012-03-07T00:24 | X5.4 | 11429 | E | 2.71 | 2.85 | 9.25 | 9.73 | −6.36 | −10.70 |
| 11 | SOL2012-03-09T03:53 | M6.3 | 11429 | E | 2.39 | 2.11 | 6.26 | 6.62 | −3.06 | −7.80 |
| 12 | SOL2012-05-10T04:18 | M5.7 | 11476 | C | 3.21 | 2.85 | 3.40 | 3.65 | 2.65 | 3.24 |
| 13 | SOL2012-07-02T10:52 | M5.6 | 11515 | E | 2.09 | 1.40 | 1.36 | 1.45 | −1.48 | −1.07 |
| 14 | SOL2012-07-05T11:44 | M6.1 | 11515 | C | 3.20 | 2.65 | 5.35 | 5.58 | −4.89 | −8.13 |
| 15 | SOL2012-07-12T16:49 | X1.4 | 11520 | E | 4.47 | 3.77 | 8.12 | 8.53 | 7.63 | 13.50 |
| 16 | SOL2013-04-11T07:16 | M6.5 | 11719 | E | 1.23 | 0.47 | 0.74 | 0.79 | 0.15 | 0.38 |
| 17 | SOL2013-10-24T00:30 | M9.3 | 11877 | E | 2.48 | 1.62 | 1.87 | 2.00 | 1.25 | 0.90 |
| 18 | SOL2013-11-01T19:53 | M6.3 | 11884 | C | 1.83 | 0.99 | 1.26 | 1.34 | 0.11 | 0.30 |
| 19 | SOL2013-11-03T05:22 | M4.9 | 11884 | C | 1.73 | 0.83 | 0.89 | 0.97 | 0.19 | 0.18 |
| 20 | SOL2013-11-05T22:12 | X3.3 | 11890 | E | 4.27 | 3.90 | 5.51 | 5.82 | 2.62 | 4.07 |
| 21 | SOL2013-11-08T04:26 | X1.1 | 11890 | E | 2.64 | 2.18 | 2.30 | 2.43 | 1.69 | 2.11 |
| 22 | SOL2013-12-31T21:58 | M6.4 | 11936 | E | 2.31 | 1.32 | 3.06 | 3.19 | −0.20 | −1.62 |
| 23 | SOL2014-01-07T10:13 | M7.2 | 11944 | C | 4.68 | 5.99 | 6.82 | 7.16 | 12.25 | 11.90 |
| 24 | SOL2014-01-07T18:32 | X1.2 | 11944 | E | 5.21 | 5.97 | 6.32 | 6.67 | 11.25 | 10.70 |
| 25 | SOL2014-02-02T09:31 | M4.4 | 11967 | C | 4.11 | 3.68 | 7.16 | 7.70 | −1.60 | −4.94 |
| 26 | SOL2014-02-04T04:00 | M5.2 | 11967 | C | 4.15 | 3.93 | 7.36 | 7.83 | −2.61 | −7.75 |
| 27 | SOL2014-03-29T17:48 | X1.1 | 12017 | E | 1.31 | 0.48 | 1.44 | 1.51 | 1.09 | 2.43 |
| 28 | SOL2014-04-18T13:03 | M7.3 | 12036 | E | 2.19 | 1.07 | 2.42 | 2.54 | 1.61 | 2.92 |
| 29 | SOL2014-09-10T17:45 | X1.6 | 12158 | E | 1.55 | 1.24 | 2.07 | 2.20 | −1.98 | −2.44 |
| 30 | SOL2014-09-28T02:58 | M5.1 | 12173 | E | 3.58 | 2.90 | 6.92 | 7.12 | −3.46 | −10.90 |
| 31 | SOL2014-10-22T14:28 | X1.6 | 12192 | C | 7.79 | 13.16 | 16.10 | 16.60 | −31.54 | −24.60 |
| 32 | SOL2014-10-24T21:41 | X3.1 | 12192 | C | 9.09 | 16.89 | 22.90 | 23.50 | −46.57 | −35.90 |
| 33 | SOL2014-11-07T17:26 | X1.6 | 12205 | E | 2.83 | 1.94 | 8.87 | 9.16 | −1.04 | 4.45 |
| 34 | SOL2014-12-04T18:25 | M6.1 | 12222 | C | 2.26 | 1.89 | 1.36 | 1.46 | −1.30 | −0.99 |
| 35 | SOL2014-12-17T04:51 | M8.7 | 12242 | E | 2.80 | 1.86 | 3.20 | 3.35 | 2.48 | 3.70 |
| 36 | SOL2014-12-18T21:58 | M6.9 | 12241 | E | 1.83 | 1.55 | 1.84 | 1.98 | 1.23 | 1.17 |
| 37 | SOL2014-12-20T00:28 | X1.8 | 12242 | E | 4.12 | 3.31 | 6.47 | 6.83 | 5.30 | 6.63 |
| 38 | SOL2015-03-11T16:21 | X2.1 | 12297 | E | 1.81 | 1.21 | 4.51 | 4.72 | 1.61 | 4.17 |
| 39 | SOL2015-03-12T14:08 | M4.2 | 12297 | C | 1.65 | 1.02 | 2.77 | 2.96 | 0.79 | 1.88 |
| 40 | SOL2015-06-22T18:23 | M6.5 | 12371 | E | 2.39 | 2.62 | 7.07 | 7.32 | −5.88 | −12.50 |
| 41 | SOL2015-06-25T08:16 | M7.9 | 12371 | E | 3.13 | 2.74 | 7.20 | 7.44 | −5.85 | −12.20 |
| 42 | SOL2015-08-24T07:33 | M5.6 | 12403 | C | 3.27 | 3.48 | 3.13 | 3.30 | 0.25 | 0.51 |
| 43 | SOL2015-09-28T14:58 | M7.6 | 12422 | C | 2.38 | 2.16 | 1.59 | 1.71 | −1.05 | −0.82 |
| 44 | SOL2017-09-04T20:33 | M5.5 | 12673 | E | 1.82 | 1.57 | 6.13 | 6.37 | −3.74 | −10.10 |
| 45 | SOL2017-09-06T12:02 | X9.3 | 12673 | E | 2.66 | 2.61 | 10.80 | 11.30 | −5.10 | −15.60 |
Notes.
 is half of the total unsigned flux, ET
is the total magnetic field, EF1 and EF2 are the free magnetic energies calculated with different methods, HR
is the relative magnetic helicity, and HJ
is the nonpotential helicity.
is half of the total unsigned flux, ET
is the total magnetic field, EF1 and EF2 are the free magnetic energies calculated with different methods, HR
is the relative magnetic helicity, and HJ
is the nonpotential helicity.
Download table as: ASCIITypeset image
The computations of the magnetic energy and helicity are based on the coronal magnetic field extrapolations as already carried out in our previous study (Duan et al. 2019). The 3D preflare coronal field was reconstructed from the SDO Helioseismic and Magnetic Imager (HMI; Hoeksema et al. 2014) vector magnetograms using the CESE–MHD–NLFFF code (Jiang & Feng 2013). For the vector magnetograms, we used the data product of the Space-weather HMI Active Region Patch (SHARP; Bobra et al. 2014), in which the 180° ambiguity has been resolved by using the minimum energy method, the coordinate system has been modified via the Lambert method, and the projection effect has been corrected. In order to avoid the possible artifacts introduced by the strong flare emission, the last available magnetogram for at least 10 minutes before the flare start time was utilized. The vector magnetograms are preprocessed before being put into the extrapolation code in order to reduce the data noise, as well as the Lorentz force contained in the photosphere (Jiang & Feng 2014). All the extrapolations are performed with spatial resolution of 1″, and the field of view (FOV) of extrapolation volumes is mostly consistent with the FOV of the SHARP data, except for those containing more than one AR, for which we cut off the unrelated ARs. For each extrapolation, the height of the volume is chosen to be equal to the smaller one of the two horizontal lengths.
For each event, we calculated the total unsigned flux ϕ; the total (ET ), potential (EP ), and free (EF ) magnetic energy; and the relative (HR ) and nonpotential (HJ ) helicities, for which the expressions are given below.
The free magnetic energy represents the deviation of the total magnetic energy from potential field energy. The computation of free energy is influenced by numerical error of ∇ · B = 0 (Valori et al. 2013), and a considerable large divergence error might render the computation of free energy totally unreliable (e.g., resulting in a negative value). Therefore, here we calculated it in two different ways to estimate how much this effect impacts the computation of the free energy in our extrapolated NLFFFs. In the first approach, we calculated the total magnetic energy ET and the corresponding potential energy EP first, and then we get the free energy EF1 as the difference between ET and EP , namely,

where B is the magnetic field from NLFFF extrapolation and can be treated as the total magnetic field, and B P is the potential field sharing the normal component with B on the boundary of V. In the second approach, the “free field” or the current-carrying field B J was first computed as B J = B − B P , and then the free energy can be calculated as

If the extrapolated field B is perfectly divergence-free, the two ways of computing free energy will lead to the same result. Thus, the difference in these two methods of free energy calculation reflects the divergence errors.
The relative magnetic helicity for a 3D magnetic field B in a finite volume V is computed as

where A and A P are the vector potentials of the two magnetic fields, satisfying B = ∇ × A and B P = ∇ × A P , respectively. Here we followed the procedure as introduced by Valori et al. (2012) to calculate the vector potentials.
Furthermore, the nonpotential (i.e., current-carrying) helicity is simply defined as

where A J = A − A P and thus B J = ∇ × A J , and the volume-threading helicity between B P and B is computed as

which can be derived from HR = HJ + HPJ .
In Table 1, we listed the calculated parameters of ET
, EF1, EF2, HR
, and HJ
. As can be seen in Figure 1, we found that the discrepancy between EF1 and EF2 is less than 2% of the corresponding ET
, which indicates that the influence of the divergence error is very small. Therefore, we use EF
= EF1 in the analysis in the next section. With all the extensive parameters obtained, subsequently we computed intensive quantities such as the energy ratio EF
/EP
, the helicity ratio ∣HJ
/HR
∣, and the normalized helicities  and
and  , where
  is half of the total unsigned flux, which has
  .
.
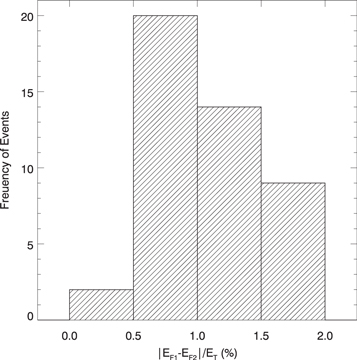
Figure 1. Distribution of the discrepancy between EF1 and EF2 as normalized by the corresponding ET for all the events.
Download figure:
Standard image High-resolution image3. Results
First, we are interested in how the parameters are correlated with one another. Figure 2 shows a matrix of the correlation coefficients (CCs) between all the parameters. Note that here we used the Spearman rank correlation rs because the Pearson CC is used to measure the linear relationship between variables and therefore is not optimal for nonlinearly related variables. The Spearman rank correlation provides a measure of the monotonic relationship between variables and is thus more suitable for this study. Following Kazachenko et al. (2017), we describe the qualitative strength of the correlation using the absolute values of rs ∈ [0.2, 0.39] (weak), rs ∈ [0.4, 0.59] (moderate), rs ∈ [0.6, 0.79] (strong), and rs ∈ [0.8, 1.0] (very strong).
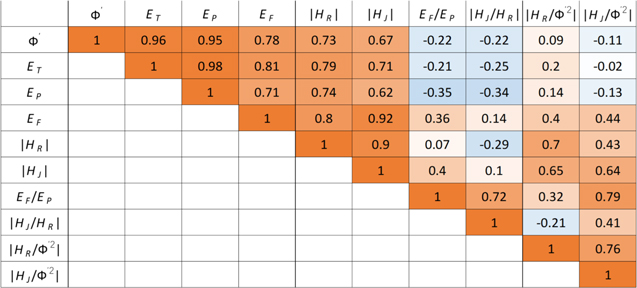
Figure 2. The Spearman rank correlation between different parameters. Colors correspond to the strength of the CC, rs , between each variable pair. Orange (blue) represents a positive (negative) rs , and the deeper the color, the higher the absolute value of rs .
Download figure:
Standard image High-resolution imageAs can be seen, all the extensive parameters (i.e., the first six ones) are strongly correlated with one another, with all rs
above 0.6. Among them, the total magnetic energy has the highest rs
of 0.98 with the potential energy, which agrees well with a large-sample statistical study based on different NLFFF extrapolation codes (Aschwanden et al. 2014b), though the CC is not explicitly given in that study. The two energies ET
and EP
have very strong correlation with the unsigned flux  with rs
≥ 0.95, which is easy to understand since more flux can hold more global energies. The free magnetic energy EF
also has strong correlation with the three parameters ET
, EP
, and
with rs
≥ 0.95, which is easy to understand since more flux can hold more global energies. The free magnetic energy EF
also has strong correlation with the three parameters ET
, EP
, and  (the highest rs
= 0.81 with ET
, which is also suggested in Aschwanden et al. 2014b). The relative helicity HR
is also similarly correlated with the flux and energies, but it has the strongest correlation with the free energy (rs
= 0.80). Such a very strong correlation between EF
and HR
was previously found by Tziotziou et al. (2012) based on an investigation of 42 different ARs (with either flaring or nonflaring ones), who demonstrated that there is a statistically monotonic correlation between the free energy and relative helicity. The correlation of the nonpotential helicity HJ
with other parameters is investigated for the first time here. HJ
is strongly correlated with HR
, and the former is overall somewhat less correlated with
(the highest rs
= 0.81 with ET
, which is also suggested in Aschwanden et al. 2014b). The relative helicity HR
is also similarly correlated with the flux and energies, but it has the strongest correlation with the free energy (rs
= 0.80). Such a very strong correlation between EF
and HR
was previously found by Tziotziou et al. (2012) based on an investigation of 42 different ARs (with either flaring or nonflaring ones), who demonstrated that there is a statistically monotonic correlation between the free energy and relative helicity. The correlation of the nonpotential helicity HJ
with other parameters is investigated for the first time here. HJ
is strongly correlated with HR
, and the former is overall somewhat less correlated with  , ET
, and EP
than the latter. Notably, HJ
is the most highly correlated with the free energy with rs
= 0.92, which is also the highest CC of the free energy with all other parameters. But this is not unexpected since, according to their definitions (see Equations (2) and (4)), they are both based solely on the current-carrying field
B
J
, which is a self-closed magnetic field and thus with weaker correlation to the potential field (and the unsigned flux) than the relative helicity.
, ET
, and EP
than the latter. Notably, HJ
is the most highly correlated with the free energy with rs
= 0.92, which is also the highest CC of the free energy with all other parameters. But this is not unexpected since, according to their definitions (see Equations (2) and (4)), they are both based solely on the current-carrying field
B
J
, which is a self-closed magnetic field and thus with weaker correlation to the potential field (and the unsigned flux) than the relative helicity.
The intensive parameters quite interestingly show more negative than positive correlation with the first three extensive parameters. For instance, the nonpotentiality energy ratio EF
/EP
, the helicity ratio ∣HJ
/HR
∣, and the normalized nonpotential helicity  are all negatively correlated with the total unsigned flux, the potential energy, and the total energy, though the correlations are rather weak (with CCs all below 0.4). This hints that when ready for producing major flares, the larger ARs (i.e., with more flux and thus more global energies) are less deviated from the potential state than the smaller ARs. When focusing on the relationship between the intensive parameters themselves, we find that the energy ratio EF
/EP
is strongly correlated with both the helicity ratio ∣HJ
/HR
∣ and the normalized nonpotential helicity
are all negatively correlated with the total unsigned flux, the potential energy, and the total energy, though the correlations are rather weak (with CCs all below 0.4). This hints that when ready for producing major flares, the larger ARs (i.e., with more flux and thus more global energies) are less deviated from the potential state than the smaller ARs. When focusing on the relationship between the intensive parameters themselves, we find that the energy ratio EF
/EP
is strongly correlated with both the helicity ratio ∣HJ
/HR
∣ and the normalized nonpotential helicity  , especially for the latter one, with the CC reaching the highest value of all (0.79), and this is also the highest CC of
  with all other parameters. This is consistent with the strong correlation between the two extensive parameters EF
and HJ
and that the denominators EP
and
with all other parameters. This is consistent with the strong correlation between the two extensive parameters EF
and HJ
and that the denominators EP
and  are also highly correlated. On the other hand, the normalized total helicity
  is less correlated with the other intensive parameters, suggesting its weaker sensitivity (than the others) on the degree of the nonpotentiality (and complexity) of the magnetic field.
Next, we explore whether the parameters behave differently in the two types of flares and whether any of them stand out for discriminating the different types, which is the main purpose of this study. In Figure 3, we show distributions of all the extensive parameters for the two types of flare events separately, including (a) the unsigned flux  , (b) the total magnetic energy ET
, (c) the magnetic potential energy EP
, and (d) free energy EF
, as well as (e) the relative magnetic helicity HR
and (f) the nonpotential magnetic helicity HJ
. The eruptive flares are shown in red, and the confined ones are shown in blue. Meanwhile, the mean and median values of each parameter for both types of flares are presented in each panel. We find that most of the flares originate from ARs with total unsigned flux on the order of 1022 Mx. The average and median
, (b) the total magnetic energy ET
, (c) the magnetic potential energy EP
, and (d) free energy EF
, as well as (e) the relative magnetic helicity HR
and (f) the nonpotential magnetic helicity HJ
. The eruptive flares are shown in red, and the confined ones are shown in blue. Meanwhile, the mean and median values of each parameter for both types of flares are presented in each panel. We find that most of the flares originate from ARs with total unsigned flux on the order of 1022 Mx. The average and median  for eruptive flares are 2.46 × 10²² Mx and 2.39 × 10²² Mx, respectively, while for confined cases they are 3.36 × 10²² Mx and 3.20 × 10²² Mx, which are larger than the values for eruptive ones. This is consistent with a large-sample statistical study by Li et al. (2021), in which they found that flares of the same GOES class but originating from an AR of larger magnetic flux are much more likely to be confined.

Figure 3. Histograms of the extensive-type indices. (a) Half of the total unsigned flux  (b) the total magnetic energy ET
; (c) the magnetic potential energy EP
; (d) the magnetic free energy EF
; (e) the absolute value of the relative magnetic helicity ∣HR
∣; (f) the absolute value of the current-carrying helicity ∣HJ
∣.
(b) the total magnetic energy ET
; (c) the magnetic potential energy EP
; (d) the magnetic free energy EF
; (e) the absolute value of the relative magnetic helicity ∣HR
∣; (f) the absolute value of the current-carrying helicity ∣HJ
∣.
Download figure:
Standard image High-resolution imageFigure 3(b) shows that the total magnetic energy ET mostly distributes around 1033 erg for both confined and eruptive flares. Similar to the distribution of magnetic flux, both the average and median ET for confined flares (3.89 × 1033 erg and 2.65 × 1033 erg) are larger than the corresponding values of the eruptive ones (with 1.93 × 1033 erg and 1.60 × 1033 erg).
The potential energy EP (Figure 3(c)) mostly distributes around 1033 erg, while the free energy EF (Figure 3(d)) distributes around 1032 erg, which is smaller than that of the potential energy by roughly an order of magnitude. Both the average (3.70 × 1033 erg) and median (2.11 × 1033 erg) of EP for confined flares are larger than those of the eruptive ones (1.49 × 1033 erg and 1.27 × 1033 erg). For EF , the average (median) value of the confined flares is 5.37 × 1032 erg (3.21 × 1032 erg), and it is larger (slightly smaller) than the corresponding values of the eruptive cases, 4.48 × 1032 erg and 3.27 × 1032 erg, respectively.
Figure 3(e) shows that for confined flares the relative magnetic helicity ∣HR ∣ has a broad distribution of 1042–1044 Mx2. Its average value (6.69 × 1043 Mx2) is clearly larger than the median value (1.30 × 1043 Mx2) since 3 cases (out of 16) have ∣HR ∣ larger than 1044 Mx2. For eruptive flares, most of them (22 out of 29) have ∣HR ∣ between 1043 and 1044 Mx2, while only one of them has ∣HR ∣ larger than 1044 Mx2, and the average and median values are 2.75 × 1043 Mx2 and 1.61 × 1043 Mx2, respectively. The confined cases have larger average ∣HR ∣ than eruptive ones, while the eruptive flares have slightly larger median ∣HR ∣ than the confined ones.
Figure 3(f) shows that for the nonpotential helicity ∣HJ ∣ the average and median ∣HJ ∣ are 6.41 × 1042 Mx2 and 1.88 × 1042 Mx2 for confined cases and 5.26 × 1042 Mx2 and 3.22 × 1042 Mx2 for the eruptive ones, respectively. Half of (8 out of 16) the confined flares have ∣HJ ∣ from 1041 to 1042 Mx2, and the other half ranges from 1042 to 1043 Mx2. Comparatively, the distribution of ∣HJ ∣ for eruptive flares is slightly more concentrated.
Figure 4 shows the scatter diagrams in two different groups of the different extensive parameters. These diagrams also indicate clearly the correlations of the parameters. However, the parameters for the two types of events (i.e., eruptive and confined flares) distribute almost evenly in the diagrams, although they have larger average values for confined flares than for eruptive flares; thus, overall the extensive parameters show no apparent systematic difference between the eruptive and confined flares and cannot discriminate the two types. We note that three confined cases are produced by AR 11944 (on 2014-01-07T10:13) and AR 12192 (on 2014-10-22T14:28 and 2014-10-24T21:41), respectively. The two ARs have very large areas of magnetic field concentration, with AR 12192 especially hosting the largest sunspot group in solar cycle 24 (Sun et al. 2015), which thus leads to a great possession of the extensive parameters.
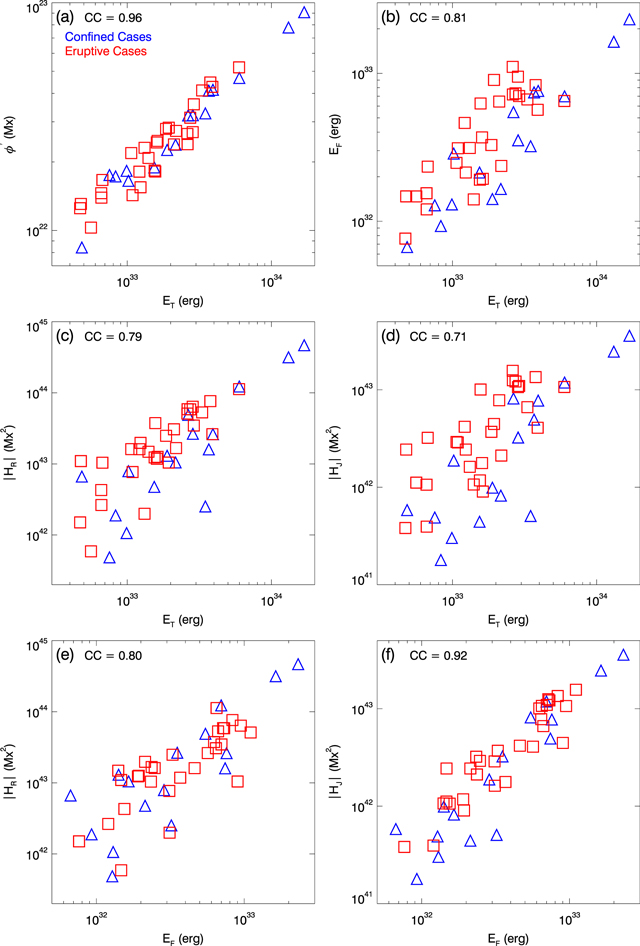
Figure 4. Scatter diagrams of ET
vs.  , ET
vs. EF
, ET
vs. ∣HR
∣, ET
vs. ∣HJ
∣, EF
vs. ∣HR
∣, and EF
vs. ∣HJ
∣ for all events in panels (a)–(f), respectively. The red squares (blue triangles) denote eruptive (confined) flares, and their Spearman CCs are labeled in the panels.
, ET
vs. EF
, ET
vs. ∣HR
∣, ET
vs. ∣HJ
∣, EF
vs. ∣HR
∣, and EF
vs. ∣HJ
∣ for all events in panels (a)–(f), respectively. The red squares (blue triangles) denote eruptive (confined) flares, and their Spearman CCs are labeled in the panels.
Download figure:
Standard image High-resolution imageFigure 5 shows the histograms of the intensive parameters for the two types of flares, including EF
/EP
, ∣HJ
/HR
∣,  , and
, and  . As can be seen for all intensive parameters, both their average and median values for eruptive flares are significantly larger than the corresponding values for confined flares, especially the energy ratio EF
/EP
and the normalized nonpotential helicity
. As can be seen for all intensive parameters, both their average and median values for eruptive flares are significantly larger than the corresponding values for confined flares, especially the energy ratio EF
/EP
and the normalized nonpotential helicity  , for both of which the values of the eruptive flares are around double those of the confined ones. This is in contrast to the result for the extensive parameters and indicates that the field for eruptive flares has overall high degrees of nonpotentiality (and complexity) than that of the confined flares. Furthermore, the distribution of EF
/EP
shows the apparent difference between the two types of flares. All the confined cases have EF
/EP
≤ 0.4, while 27% (8 out of 29) of the eruptive cases have EF
/EP
≥ 0.4 (with the largest value of over 0.8). This difference can be similarly seen in the distribution of
, for both of which the values of the eruptive flares are around double those of the confined ones. This is in contrast to the result for the extensive parameters and indicates that the field for eruptive flares has overall high degrees of nonpotentiality (and complexity) than that of the confined flares. Furthermore, the distribution of EF
/EP
shows the apparent difference between the two types of flares. All the confined cases have EF
/EP
≤ 0.4, while 27% (8 out of 29) of the eruptive cases have EF
/EP
≥ 0.4 (with the largest value of over 0.8). This difference can be similarly seen in the distribution of  , as all the confined events have values below 0.01, while over 20% (6 in 29) of the eruptive events have values above 0.01. In Figure 5(b), there are two cases with ∣HJ
/HR
∣ larger than 1, and we found that in those cases HR
and HJ
is positive while HPJ
is negative.
, as all the confined events have values below 0.01, while over 20% (6 in 29) of the eruptive events have values above 0.01. In Figure 5(b), there are two cases with ∣HJ
/HR
∣ larger than 1, and we found that in those cases HR
and HJ
is positive while HPJ
is negative.
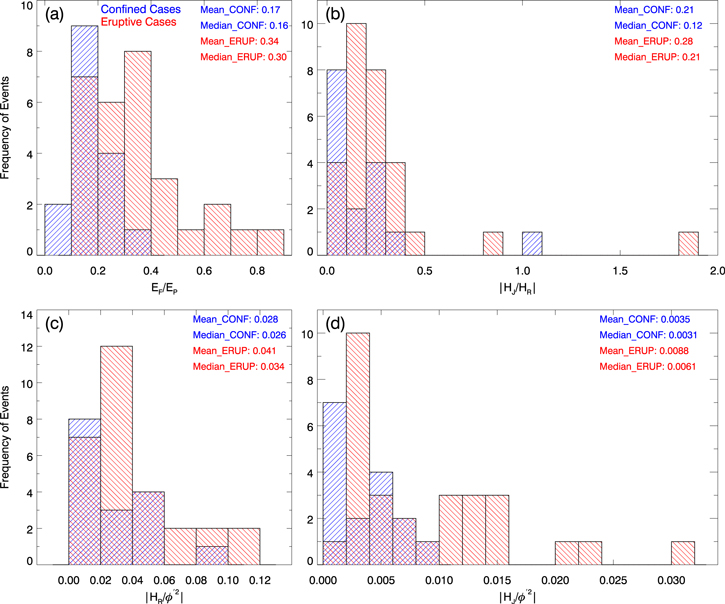
Figure 5. Histograms of the intensive-type indices. (a) The ratio of the magnetic free energy to potential energy EF
/EP
; (b) the ratio of current-carrying helicity to the relative magnetic helicity ∣HJ
/HR
∣; (c)  , where
  is half of the total unsigned magnetic flux; (d)
  .
.
Download figure:
Standard image High-resolution imageIn Figures 6(a)–(c), we show the scatter diagrams of ∣HJ
/HR
∣ versus EF
/EP
,  versus EF
/EP
, and
versus EF
/EP
, and  versus EF
/EP
for the events. These plots show the systematic difference between the two types of events, which is not seen in the extensive parameters (Figure 4). In particular, from the distribution of eruptive and confined flares in the parameter spaces, it is possible to empirically identify critical values that can discriminate a majority of the different events. Panel (a) shows that most of the events have ∣HJ
/HR
∣ ≤ 0.5, and this cannot discriminate eruptive flares from confined ones effectively. Panel (b) shows that
versus EF
/EP
for the events. These plots show the systematic difference between the two types of events, which is not seen in the extensive parameters (Figure 4). In particular, from the distribution of eruptive and confined flares in the parameter spaces, it is possible to empirically identify critical values that can discriminate a majority of the different events. Panel (a) shows that most of the events have ∣HJ
/HR
∣ ≤ 0.5, and this cannot discriminate eruptive flares from confined ones effectively. Panel (b) shows that  also has poor ability to distinguish different types of flares. On the other hand, as marked in panel (c), when we use critical values of
  and
and  , respectively, the distribution of the events falls into four quadrants, which are defined as Q1 (
 and EF
/EP
≥ 0.27), Q2 (
and EF
/EP
≥ 0.27), Q2 ( and EF
/EP
< 0.27), Q3(
and EF
/EP
< 0.27), Q3( and EF
/EP
< 0.27), and Q4 (
and EF
/EP
< 0.27), and Q4 ( and EF
/EP
≥ 0.27). The histograms for events falling into different quadrants are shown in Figure 6(d). As can be seen, all the events with
and EF
/EP
≥ 0.27). The histograms for events falling into different quadrants are shown in Figure 6(d). As can be seen, all the events with  above
above  (i.e., in Q1+Q2) erupted. Thus,
  can be regarded as a sufficient condition for an eruptive flare. For all the events with EF
/EP
above
can be regarded as a sufficient condition for an eruptive flare. For all the events with EF
/EP
above  (i.e., Q1+Q4), 95% erupted (18 in 19). Over 94% of confined events (15 in 16) reside in Q3. If making a prediction for eruptive or confined events in all 45 events using these critical values, over 75% are successfully predicted, and the remaining 11 events include 10 eruptive ones in Q3 and 1 confined one in Q4.
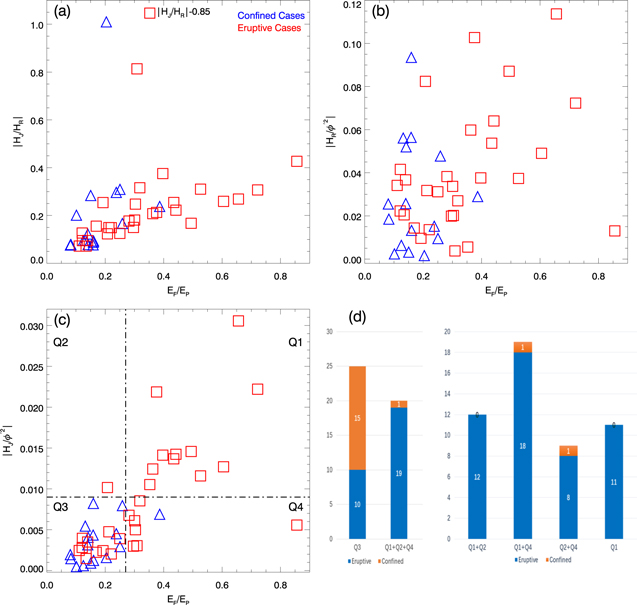
Figure 6. Scatter diagrams of EF
/EP
vs. ∣HJ
/HR
∣, EF
/EP
vs.  , and EF
/EP
vs.
, and EF
/EP
vs.  for all events in panels (a)–(c), respectively. The red squares (blue triangles) denote eruptive (confined) flares. Note that the maximum value of ∣HJ
/HR
∣ is 1.89, and for a better display of the plot, we show it as (∣HJ
/HR
∣ – 0.85) in panel (a). The vertical dashed line in panel (c) shows Ef
/Ep
= 0.27, and the horizontal dashed line shows
for all events in panels (a)–(c), respectively. The red squares (blue triangles) denote eruptive (confined) flares. Note that the maximum value of ∣HJ
/HR
∣ is 1.89, and for a better display of the plot, we show it as (∣HJ
/HR
∣ – 0.85) in panel (a). The vertical dashed line in panel (c) shows Ef
/Ep
= 0.27, and the horizontal dashed line shows  . Based on the lines in panel (c), the distribution of all the events can be divided into four quadrants, Q1, Q2, Q3, and Q4. (d) Histograms for numbers of events in Q3, Q1+Q2+Q4, Q1+Q2, Q1+Q4, Q2+Q4, and Q1.
Download figure:
Standard image High-resolution image4. Summary
In this paper, we carried out a survey of important parameters related to magnetic energy and helicity for 45 major solar flares (generally above GOES M5 class), with the main purpose of exploring whether there are parameters that can effectively discriminate the eruptive and confined flares. These investigated parameters include the extensive-type quantities, which are the unsigned flux  , the total magnetic energy ET
, potential magnetic energy EP
, free magnetic energy EF
, relative magnetic helicity HR
, and nonpotential (current-carrying) magnetic helicity HJ
, and the intensive-type indices (mainly as the ratios of different extensive indices, e.g., EF
/EP
, ∣HJ
/HR
∣,
, the total magnetic energy ET
, potential magnetic energy EP
, free magnetic energy EF
, relative magnetic helicity HR
, and nonpotential (current-carrying) magnetic helicity HJ
, and the intensive-type indices (mainly as the ratios of different extensive indices, e.g., EF
/EP
, ∣HJ
/HR
∣,  , and
, and  ). Using the CESE–MHD–NLFFF method with SDO/HMI vector magnetograms as input, we reconstructed the coronal magnetic fields immediately prior to the flares for all events, and then we calculated the parameters. The results are summarized as follows:
- 1.All the extensive parameters are strongly correlated between one another, with Spearman CCs all above 0.6. Importantly, both the relative helicity HR and the nonpotential helicity HJ have the strongest correlation with the free energy (with rs = 0.8 and rs = 0.92, respectively) compared with all other parameters, and in turn the correlation of the free energy with the nonpotential helicity HJ is the highest compared with all other parameters. This confirms the intrinsic relationship between the nonpotentiality and complexity of the coronal magnetic field.
- 2.The intensive parameters show negative (but rather weak) correlation with the first three extensive parameters, which hints that when ready for producing major flares, the larger ARs (i.e., with more flux and thus more global energies) are less deviated from the potential state than the smaller ARs. The energy ratio EF /EP (which measures the degree of nonpotentiality) is strongly correlated with both the normalized nonpotential helicity
 and the helicity ratio ∣HJ
/HR
∣. Especially, EF
/EP
and have the strongest correlation among all others with these two parameters.
and the helicity ratio ∣HJ
/HR
∣. Especially, EF
/EP
and have the strongest correlation among all others with these two parameters. - 3.On average, all the extensive parameters have larger average values for confined flares than for eruptive flares (since the confined events have overall larger magnetic flux), but their distributions show no apparent systematic difference between the eruptive and confined events. Therefore, in general, all the extensive quantities cannot distinguish the eruptive and confined potential of the flare-producing AR.
- 4.In contrast to the extensive parameters, all the intensive parameters have significantly larger average and median values for eruptive flares than the confined events. This indicates that the field for eruptive flares has overall high degrees of nonpotentiality and complexity than that of the confined flares. In distinguishing the two types of events, the intensive parameters show a certain ability that is absent for the extensive ones. Among them, the energy ratio EF /EP and the normalized current-carrying helicity are the most capable of distinguishing the preflare corona of ARs that possibly produce a large eruptive or confined flare. Particularly, by using the characteristic preflare values of EF
/EP
≥ 0.27 and , over 75% of the events are successfully discriminated between eruptive and confined flares. On the other hand, and ∣HJ
/HR
∣ are less important in differentiating the eruptive flares from the confined ones. Our result partially supports the finding of Gupta et al. (2021), who showed that the events with EF
/ET
> 0.2 (which is equivalent to EF
/EP
> 0.25, a value very close to our derived one of 0.27) and are more likely to produce eruptive flares. However, we do not find systematic difference in the value of ∣HJ
/HR
∣ between the two types of flares, which is at variance with Gupta et al. (2021), who found that ∣HJ
/HR
∣ is distinctly different for ARs producing different types of flares.


Finally, it is interesting to compare the result of this work with our previous works (Duan et al. 2019, 2021), which are based on the same data set but focused on the special magnetic configuration, i.e., the magnetic field rope (MFR), and the related ideal MHD instabilities (namely, the torus instability and kink instability) in determining the eruptive and confined types of the flares. In those works, by a comprehensive analysis of the two control parameters, the decay index of the strapping field (n) for torus instability and the maximum twist number (Tw
) in the MFR for kink instability, we found two critical values of n
crit
= 1.3 and ∣Tw
∣
crit
= 2, respectively, since 70% of the events can be discriminated between eruptive and confined flares (see the diagram of Figure 11 in Duan et al. 2019). In this study, we also found two parameters, i.e.,  and EF
/EP
, with thresholds of
and EF
/EP
, with thresholds of  and
and  , as all the events above
  and 95% of the events above
  erupted. Furthermore, by such a criterion, over 75% of the events can be discriminated between eruptive and confined flares, which is slightly more successful than the previous study. By further considering that the calculation of the global parameters of the coronal field is much easier than inspecting the detailed magnetic configurations (e.g., searching the MFRs, identifying their axis, and computing the twist number and the decay index, which needs a significantly larger amount of effort than this work), the comparison of these two different studies suggests that it might be more effective to predict the eruptive and confined potential of ARs by using the global parameters than studying the specific configuration.
This work is supported by National Natural Science Foundation of China (NSFC) U2031108 and Guangdong Basic and Applied Basic Research Foundation (2021A1515011430), as well as the Fundamental Research Funds for the Central Universities, Sun Yat-sen University (22qntd1912). C.J. acknowledges support by NSFC 42174200, the Fundamental Research Funds for the Central Universities (grant No. HIT.OCEF.2021033), and the Shenzhen Technology Project (grant No. RCJC20210609104422048). The computational work of the NLFFF extrapolations was carried out on TianHe-1(A), National Supercomputer Center in Tianjin, China. Data from observations are courtesy of NASA/SDO.