Abstract
Low-luminosity active galactic nuclei are more abundant and closer to us than the luminous ones but harder to explore as they are faint. We have selected the four sources, NGC 315, NGC 4261, NGC 1275, and NGC 4486, which have been detected in γ-rays by Fermi-LAT. We have compiled their long-term radio, optical, X-ray data from different telescopes, and analyzed XMM-Newton data for NGC 4486 and XMM-Newton and Swift data for NGC 315. We have analyzed the Fermi-LAT data collected over the period of 2008 to 2020 for all of them. Electrons are assumed to be accelerated to relativistic energies in subparsec-scale jets, which radiate by synchrotron and synchrotron self-Compton emission covering radio to γ-ray energies. This model can fit most of the multiwavelength data points of the four sources. However, the γ-ray data points from NGC 315 and NGC 4261 can be well fitted only up to 1.6 GeV and 0.6 GeV, respectively, in this model. This motivates us to find out the origin of the higher-energy γ-rays detected from these sources. Kiloparsec-scale jets have been observed previously from these sources in radio and X-ray frequencies. If we assume γ-rays are also produced in kiloparsec-scale jets of these sources from inverse-Compton scattering of starlight photons by ultrarelativistic electrons, then it is possible to fit the γ-ray data at higher energies. Our result also suggests that strong host galaxy emission is required to produce GeV radiation from kiloparsec-scale jets.
1. Introduction
With almost complete unanimity, it is believed that most of the giant galaxies host supermassive black holes (SMBHs) at their centers (Magorrian et al. 1998; Ferrarese & Ford 2005; Kormendy & Ho 2013). Accretion onto these SMBHs powers the most persistent sources of electromagnetic radiation in the universe known as active galactic nuclei (AGNs). In the present-day universe, the majority of the AGNs host underfed SMBHs, which are accreting at low, sub-Eddington rates (with Eddington ratio, Lbol/LEdd ≤ 10−3) as revealed by optical spectroscopic surveys (Ho et al. 1997; Ho 2008). With an average bolometric luminosity of less than 1042 erg s−1 (Terashima et al. 2000), these low-luminosity AGNs (LLAGNs) occupy the fainter end of the AGN luminosity function. The low luminosity of these sources makes them incapable of sustaining structural features like a broad-line region (BLR; Laor 2003) and dusty torus (Hönig & Beckert 2007), which are cornerstones of the inclination-based unified scheme of AGNs (Antonucci 1993).
Many LLAGNs can be described by advection-dominated accretion flows (ADAFs) where the plasma thermal energy is advected all the way into the event horizon before being radiated away. At sub-Eddington accretion rates, ADAFs are radiatively inefficient with low densities and low optical depth. This results in a geometrically thick and optically thin accretion flow unlike geometrically thin, optically thick accretion flows in luminous AGNs (see Narayan & Yi 1994). At high mass accretion rate, the optical depth of the accretion flow becomes high and most of the internal energy carried by photons gets trapped inside the flowing matter and reduces the radiative efficiency. This model is called optically thick ADAF, or “slim disk” (Abramowicz et al. 1988). We usually refer to the optically thin ADAF as radiatively inefficient accretion flow (RIAF). In this paper, we have used the terms ADAF and RIAF interchangeably, considering both represent the optically thin, geometrically thick accretion flows. Observationally, it has been seen that the big blue bump, which is a telltale signature of the standard accretion disk in more-luminous AGNs, is either absent or weak in the spectral energy distributions (SEDs) of LLAGNs (Ho 2008). Further, the conspicuous presence of red bumps in the mid-IR band, as well as the presence of double-peaked Balmer emission lines, indicates the presence of an optically thick outer truncated disk (Quataert et al. 1999; Ho et al. 2000). These suggest that the central engines go through fundamental changes as the accretion rate decreases to sub-Eddington limits, thus nullifying the hypothesis that the LLAGNs are the scaled-down versions of their more-luminous predecessors.
Observational and theoretical studies suggest that RIAFs are quite efficient at producing powerful bipolar outflows and jets owing to their vertical thick structure, which enhances the large-scale poloidal component of the magnetic field, which is crucial for the formation of jets (Narayan & Yi 1994; Nemmen et al. 2007; Narayan & McClintock 2008). The radio cores in LLAGNs, detected using 15 GHz VLA images by Nagar et al. (2005), indicate the primary accretion energy output is in jet kinetic power. Despite their low luminosities, these objects are radio-loud (radio-loudness is anticorrelated with Eddington ratio; Ho 2002), which further supports the existence of jets in these systems. Extended structures in radio are also seen from some LLAGNs when observed with sufficient angular resolution and sensitivity (Mezcua & Prieto 2014).
Perforce, it has been suggested that in most LLAGNs, emission comes from three components: a jet, RIAF, and an outer thin disk 3 (Nemmen et al. 2014). Thus, the jet, RIAF, and RIAF with truncated thin-disk models (e.g., Falcke et al. 2000; Merloni et al. 2003 and Yu et al. 2011) are widely used to explain the SEDs of LLAGNs. Their relative contributions are not yet known. Nemmen et al. (2010) modeled 24 low-ionization nuclear emission-line regions (LINERs) to demonstrate that both ADAF-dominated and jet-dominated models can explain the observed X-ray data consistently.
The γ-rays emitted from the nonthermal leptons that are accelerated in the jet can help probe the jet component directly. This accelerated population of electrons in the magnetized jet emits synchrotron radiation, which is then upscattered by the same electron population through inverse-Compton (IC) scattering producing γ-rays (Maraschi et al. 1992). The modeling of broadband SED extending from radio to γ-rays helps to constrain the physical parameters of the jet.
The Large Area Telescope instrument on board the Fermi satellite (Fermi-LAT) is a pair conversion γ-ray telescope covering an energy range from ∼20 MeV to more than 300 GeV (Atwood et al. 2009). It primarily operates in an all-sky survey mode, where it scans the entire sky approximately every 3 hr. It has been surveying the entire sky in the energy range of 100 MeV to 300 GeV for more than 12 yr (Atwood et al. 2009). Ho et al. (1995) conducted a Palomar spectroscopic survey of northern galaxies selected based on apparent blue magnitude BT < 12.5 and found out that over 40% of nearby galaxies contain LLAGNs. The Palomar survey is ideal for the study of demographics and physical properties of nearby galaxies, especially LLAGNs because the survey is composed of high-quality, moderate-resolution, long-slit optical spectra (Ho 2008). de Menezes et al. (2020) confirmed that the four LLAGNs (NGC 315, NGC 4261, NGC 1275, and NGC 4486) from the Palomar survey are γ-ray emitters with more than 5σ significance by analyzing 10.25 yr of Fermi-LAT data. To the best of our knowledge, these are the only LLAGNs from the Palomar survey that have been detected in γ-rays by Fermi-LAT. While NGC 1275 and NGC 4486 have been identified as γ-ray emitters before, NGC 315 and NGC 4261 are identified as γ-ray emitters for the first time by de Menezes et al. (2020). They have shown that single-zone synchrotron self-Compton (SSC) emission from the jet can explain the γ-ray emission of up to a few GeV for NGC 315 and NGC 4261 while hadronic emission from RIAF fails to do so.
In this work, we consider the four LLAGNs mentioned above from the Palomar survey that are detected in γ-rays, as our sample. We model their multiwavelength SEDs with a leptonic model assuming the emission regions are located in subparsec- and kiloparsec-scale jets. At kiloparsec scales, it has been suggested that starlight from the galaxy can be a dominant photon field for IC scattering off electrons (Stawarz et al. 2003). This allows us to include a γ-ray emission component from the kiloparsec-scale jet to explain the emission above a few GeV, which could not be explained by a single-zone SSC emission from the subparsec-scale jet. We have calculated the γ-ray emission from the kiloparsec-scale jet, produced by the external Compton (EC) scattering of galactic starlight photons by the relativistic electrons in the kiloparsec-scale jet. The broadband SEDs are modeled using a time-dependent code that includes radiative cooling and escape of relativistic leptons from the emission region.
We have shown that SSC emission from the subparsec-scale jet can well explain the broadband SEDs of these four LLAGNs, while EC emission from the kiloparsec jet is required to explain the γ-ray emission beyond 1.6 GeV and 0.6 GeV in the case of NGC 315 and NGC 4261, respectively. A standard ΛCDM cosmology model with H0 = 75 km Mpc−1 s−1 and Ωmatter = 0.27 is assumed throughout this paper.
In Section 2, we discuss the LLAGNs studied in this work. The data analysis is discussed in Section 3. The modeling of SEDs and results are discussed in Section 4. The summary and conclusions are presented in Section 5.
2. Sample
2.1. NGC 315
NGC 315 is a nearby elliptical galaxy, located at a redshift of 0.01648 (Trager et al. 2000). It hosts a Fanaroff–Riley type 1 (FR I) radio source with two-sided asymmetric well-resolved radio jets at arcsecond and milliarcsecond resolutions shown both with Very Long Baseline Interferometry (VLBI) and Very Large Array (VLA) observations (Venturi et al. 1993; Cotton et al. 1999). The high spatial resolution of Chandra imaging allowed the detection of X-ray emission from the main jet (Worrall et al. 2003) inclined at an angle 38° ± 2° to our line of sight (Canvin et al. 2005). The Hubble Space Telescope (HST) image shows a clear circumnuclear dusty disk with 25 diameter in its center (Verdoes Kleijn et al. 1999). It has been classified as an LLAGN by Ho et al. (1997) through the detection of broad Hα
line. Its LLAGN nature was later confirmed by Gu et al. (2007), who obtained the bolometric luminosity of Lbol ∼ 1.9 × 1043 ergs s−1 corresponding to an extremely low Eddington ratio of 4.9 × 10⁻⁴.
Located at a distance of 65.8 Mpc (Nagar et al. 2005), this LLAGN is one of the four low-accreting galaxies from the Palomar survey (Ho et al. 1995, 1997) to be detected at γ-ray energies at above 5σ significance by Fermi-LAT (de Menezes et al. 2020). It is detected with a statistical significance of ∼9σ in the energy range 0.1–300 GeV over an observation of 10.25 yr ranging from 2008 August 4 to 2018 November 15. The measured differential spectrum is well defined by a power law with photon index Γ = 2.32 ± 0.11 with an average flux of 3.38 (±0.43) × 10−12 ergs cm−2 s−1.
2.2. NGC 4261
NGC 4261 is an elliptical galaxy located at a redshift of 0.00738 (Cappellari et al. 2011), with a nucleus classified as a type 2 LINER based on high-quality optical spectra by Ho et al. (1997). It is located at a distance of 35.1 Mpc (Nagar et al. 2005) with an SMBH of mass of 4.9 (±0.1) × 108 M⊙ (Ferrarese et al. 1996) at the center. It hosts a low-power FR I radio source with twin jets (Birkinshaw & Davies 1985) oriented at an angle of 63° ± 3° with respect to the line of sight of the observer (Piner et al. 2001). In addition, a 300 pc-scale nuclear disk of gas and dust was imaged by HST (Jaffe et al. 1993; Ferrarese et al. 1996) lying orthogonal to the radio jets. The presence of an X-ray jet has been detected in the inner few kiloparsec-scale of the radio jets by Chandra observations (Gliozzi et al. 2003; Zezas et al. 2005; Worrall et al. 2010). Zezas et al. (2005) also showed a substantial absorbing column in X-rays. The luminosity after absorption and bolometric corrections is only 2.0 × 10⁻⁵ of the Eddington luminosity, implying a low accretion rate. NGC 4261 was detected in γ-rays by Fermi-LAT with a significance of ∼6.8σ over a period of 10.25 yr (de Menezes et al. 2020). A power law with a photon index of 2.15 ± 0.16 and an average flux of 2.15 (±0.42) × 10−12 ergs cm−2 s−1 explains the measured SED in the energy range of 0.1–300 GeV.
2.3. NGC 1275
NGC 1275 is one of the nearest radio galaxies at a redshift of z = 0.0176 (Young et al. 1995). It is located at a distance of 70.1 Mpc (Nagar et al. 2005) and is elliptical in shape. It is a radio-loud AGN with a relatively low Eddington ratio of 3 × 10⁻⁴ (Sikora et al. 2007), classifying it as a low-luminosity AGN. It is identified as a Seyfert 1.5 due to the presence of a weak broad emission line based on the Hα study (Ho et al. 1997). The detailed studies of the AGN with VLBI and VLA established the presence of an exceptionally bright radio source (3C 84) with asymmetrical jets at both parsec and kiloparsec scales (Vermeulen et al. 1994; Walker et al. 2000; Asada et al. 2006), suggesting an FR I morphology. These studies reveal a jet angle of 30°–60° with our line of sight (Walker et al. 1994; Asada et al. 2006). Recently, Fujita & Nagai (2017) suggested the viewing angle of the jet with respect to the line of sight to be 65° ± 15° based on the increased radio activity detected by Nagai et al. (2010).
NGC 1275 is one of the brightest radio galaxies detected at the high-energy (HE; >100 MeV) and very-high-energy (VHE; >100 GeV) γ-rays (Abdo et al. 2009a; Aleksić et al. 2012). The average flux and the photon index measured by Fermi-LAT from 2008 August 4 to 2016 November 15 are F>100MeV = 3.34 (±0.03) × 10−7 ph cm−2 s−1 and 1.93 ± 0.01, respectively (Tanada et al. 2018). At VHE, MAGIC measured the average γ-ray flux above 100 GeV to be 1.3 ( ± 0.2) × 10−11ph cm−2 s−1. The corresponding differential spectrum in 70–500 GeV was estimated with a power law of the photon index 4.1 ± 0.7 (Aleksić et al. 2012). This spectral break from HE to VHE was later confirmed by several studies like Fukazawa et al. (2015) and Tanada et al. (2018). NGC 1275 has also been observed at VHE by other imaging atmospheric Cerenkov telescopes like HEGRA, Whipple, VERITAS (Mukherjee & VERITAS Collaboration 2017), and TACTIC (Ghosal et al. 2020).
2.4. NGC 4486 (M87)
M87 is a giant elliptical galaxy located in the Virgo cluster at a redshift z = 0.00428 (Cappellari et al. 2011). It is located at a distance of 16.8 Mpc (Nagar et al. 2005), with an SMBH of mass 6.5 × 10⁹ M⊙ at its center powering it (Event Horizon Telescope Collaboration et al. 2019). Despite hosting such an SMBH, its bolometric luminosity is only of the order of 1042 ergs s−1, which is six orders of magnitude lower than the Eddington luminosity (Reynolds et al. 1996), placing this in the class of LLAGNs. It is commonly classified as an FR I radio galaxy. The presence of narrow emission lines also suggests its a type 2 LINER. The relativistic jet, first detected by H. Curtis (Curtis 1918) in optical is misaligned with respect to the line of sight with an angle between 15° and 30° (Biretta et al. 1999; Acciari et al. 2009; Walker et al. 2018). Due to its proximity, the jet is well imaged at radio through X-ray frequencies. This relativistic outflow extends up to kiloparsec scales (Marshall et al. 2002), and its radiative output is believed to dominate the SED of the AGN core (Abdo et al. 2009b; Nemmen et al. 2014; de Jong et al. 2015; Fraija & Marinelli 2016; Prieto et al. 2016). A recent polarized image of the SMBH of M87 indicates the presence of a strong magnetic field at the event horizon, which can launch powerful jets (The Event Horizon Collaboration 2021).
M87 is the first extragalactic object to be detected at VHE by HEGRA (Aharonian et al. 2003). Since then, it has been detected at γ-ray frequencies by the High Energy Stereoscopic System (H.E.S.S.), VERITAS, MAGIC, and Fermi-LAT (Aharonian et al. 2006; Acciari et al. 2008; Albert et al. 2008; Abdo et al. 2009b).
3. Multiwavelength Observations and Data Analysis
We have constructed the multiwavelength SED of our sample by compiling radio to UV data on these sources from earlier works. We have analyzed the X-ray data recorded by XMM-Newton in 2017 from NGC 4486, XMM-Newton data taken in 2019 and Swift data from 2017 to 2018 for NGC 315, and compiled the archival X-ray data available on NGC 4261 and NGC 1275 (see details in Section 3.2). In addition, we analyzed 12 yr of Fermi-LAT data, collected over the period of 2008 to 2020. Due to the low spatial resolution in the γ-ray energy band, the distinction between the emission from the subparsec-scale and kiloparsec-scale jet cannot be made. The radio and X-ray data points of the extended jets of NGC 315 and NGC 4261 were obtained from observations by the Very Large Array (VLA) and Chandra observatories, respectively, owing to their high spatial resolution (Worrall et al. 2007, 2010). The results obtained for the maximum likelihood analysis of Fermi-LAT data are summarized in Table 1 for different spectral models. The 12 yr averaged spectrum along with the best fit of each spectral model is shown in Figure 1. Data from NED 4 have also been taken for an overall reference SED.
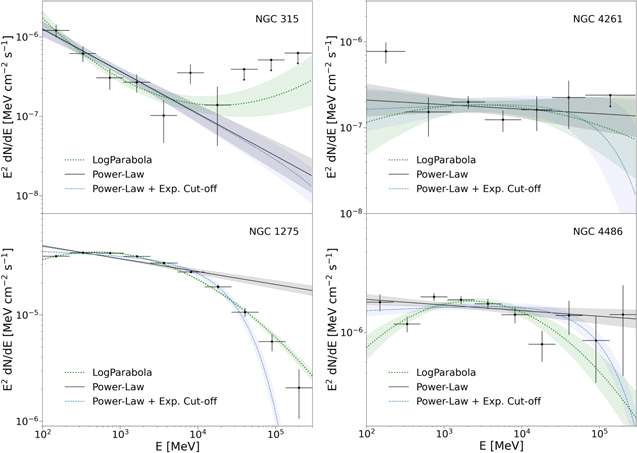
Figure 1. The γ-ray SED obtained by Fermi-LAT from 12 yr of observations. The shaded part corresponds to 1σ uncertainty in the respective fit. When TS < 4, upper limits at 95% confidence level are plotted with a downward arrow.
Download figure:
Standard image High-resolution imageTable 1. Parameter Results for γ-ray SED Obtained by Fermi-LAT Fitted Using Different Spectral Models in the Range of 100 MeV to 300 GeV
| Source | Model | Parameter Values a | Flux0.1–300 GeV | TScurve b |
|---|---|---|---|---|
| (erg cm−2 s−1) | ||||
| NGC 315 (4FGL J0057.7+3023) | Power Law | Γ = 2.53 ± 0.11 | 3.81(±0.41) × 10−12 | ⋯ |
| Log-Parabola | α = 2.52 ± 0.08 | 4.51 ( ± 0.75) × 10−12 | 3.16 | |
| β = −0.09 ± 0.03 | ||||
| Power Law with | Γ = 2.53 ± 0.11 | 3.73(±0.40) × 10−12 | −1.7 | |
| Exponential Cutoff | Ec = 0.9 TeV | |||
| NGC 4261 (4FGL J1219.6+0550) | Power Law | Γ = 2.05 ± 0.15 | 2.22(±0.42) × 10−12 | ⋯ |
| Log-Parabola | α = 1.99 ± (0.19) | 1.92(±0.69) × 10−12 | −0.58 | |
| β = 0.04 ± 0.09 | ||||
| Power Law with | Γ = 1.95 ± 0.22 | 1.97(±0.54) × 10−12 | 2.34 | |
| Exponential Cutoff | Ec = 0.1 TeV | |||
| NGC 1275 (4FGL J0319.8+4130) | Power Law | Γ = 2.12 ± 0.02 | 3.70(±0.05) × 10−10 | ⋯ |
| Log-Parabola | α = 2.08 ± 0.01 | 3.10(±0.03) × 10−10 | 383.6 | |
| β = 0.065 ± 0.003 | ||||
| Power Law with | Γ = 2.03 ± 0.01 | 3.02(±0.02) × 10−10 | 351.1 | |
| Exponential Cutoff | Ec = 30.8 ± 2.6 GeV | |||
| NGC 4486 (4FGL J1230.8+1223) | Power Law | Γ = 2.04 ± 0.03 | 1.94(±0.09) × 10−11 | ⋯ |
| Log-Parabola | α = 1.94 ± 0.04 | 1.48(±0.11) × 10−11 | −18.6 | |
| β = 0.08 ± 0.02 | ||||
| Power Law with | Γ = 1.97 ± 0.03 | 1.69(±0.08) × 10−11 | −51.1 | |
| Exponential Cutoff | Ec = 0.13 TeV | |||
Notes.
a Symbols are as defined in the text. b TScurve = 2 (log - log
- log  (PL)), where
  is the maximum likelihood of the model,
  is either a Log-Parabola or a Power Law with Exponential Cutoff spectral model. PL is a Power-law spectral model.
Download table as: ASCIITypeset image
3.1. Radio to UV
The radio to UV data for this work have been compiled from previous observations. The details of the observations and reductions can be found in the references given in Figures 2, 3, 4, and 5.
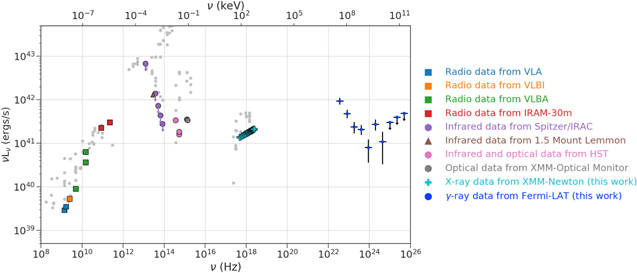
Figure 2. The multiwavelength SED of NGC 315 constructed using radio data taken from Capetti et al. (2005), Lazio et al. (2001), Nagar et al. (2005), Agudo et al. (2014), Kovalev et al. (2005), and Venturi et al. (1993); infrared data taken from Gu et al. (2007), Heckman et al. (1983), and Verdoes Kleijn et al. (2002); optical data taken from Verdoes Kleijn et al. (2002) and Younes et al. (2012); and X-ray data taken from Worrall et al. (2007). Other data points from NED are shown in silver.
Download figure:
Standard image High-resolution image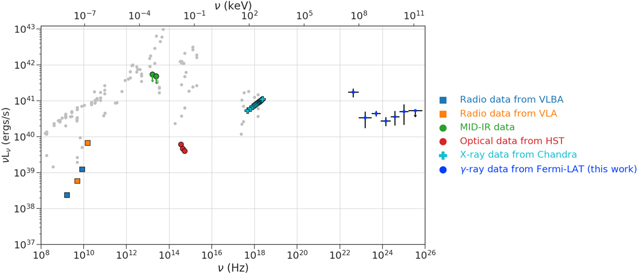
Figure 3. The multiwavelength SED of NGC 4261 constructed using radio data taken from Jones & Wehrle (1997) and Nagar et al. (2005); infrared data taken from Asmus et al. (2014); and optical data taken from Ferrarese et al. (1996). The X-ray observation is taken from Zezas et al. (2005). Other data points from NED are shown in silver. The higher flux in radio are low-resolution measurements that could have significant contribution from the radio lobes of NGC 4261.
Download figure:
Standard image High-resolution image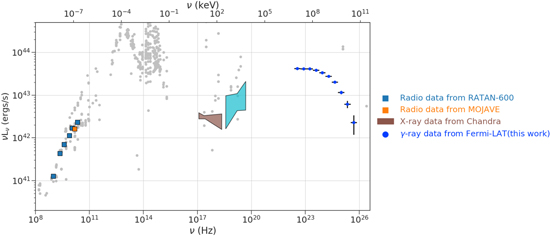
Figure 4. The multiwavelength SED of NGC 1275 is constructed using radio data from Abdo et al. (2009a). X-ray data have been taken from Tanada et al. (2018) and Ajello et al. (2009). Other data points from NED are shown in silver.
Download figure:
Standard image High-resolution image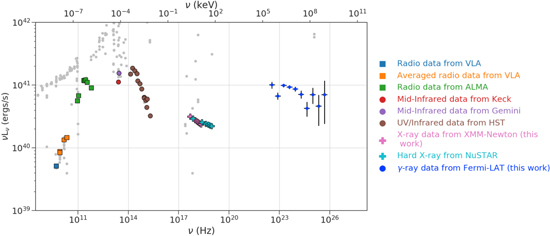
Figure 5. The multiwavelength SED of NGC 4486 constructed using data taken from Nagar et al. (2001), Prieto et al. (2016), Whysong & Antonucci (2004), and Perlman et al. (2001). Other data points from NED are shown in silver. The higher flux in radio are low-resolution measurements that could have a significant contribution from the radio lobes of NGC 4486.
Download figure:
Standard image High-resolution imageWhenever available, radio data have been taken from NRAO 5 VLA, NRAO Very Large Baseline Array (VLBA), and Very Large Baseline Interferometry (VLBI). The high resolution of these radio telescopes allowed radio emission from the AGN to be isolated from the other sources. In the optical band, data points from the Hubble Space Telescope (HST) have been obtained, if available.
NGC 315: NGC 315 has been observed in the radio band by several studies using VLA, VLBA, and VLBI (Capetti et al. 2005; Kovalev et al. 2005; Nagar et al. 2005; Venturi et al. 1993). As part of the polarimetric survey, it was simultaneously observed at 86 GHz and 229 GHz in August 2010 using the XPOL polarimeter on the IRAM 30 m radio telescope (Agudo et al. 2014). Infrared data at arcsecond resolution has been obtained from Spitzer. These are considered as upper limits due to nonnegligible contribution from the central dusty disk of the AGN. The data points obtained using filters UVW2 and UVM2 of the XMM-Optical monitor, in 2005 July by Younes et al. (2012), are also included. For the modeling, HST data points are preferred over XMM-optical monitor data points due to the lower resolution of the latter.
NGC 4261: We have used the radio to UV data compiled by de Menezes et al. (2020). The radio data from VLA and VLBI have been taken (Jones & Wehrle 1997; Nagar et al. 2005). The mid-infrared data were taken as subarcsecond-resolution images obtained using VISIR (Asmus et al. 2014).
NGC 1275: Almost simultaneous radio observations taken in 2008 August–September by VLBA as part of Monitoring Of Jets in Active galactic nuclei with VLBA Experiments (MOJAVE) and 600 m ring radio telescope RATAN-600 of the Special Astrophysical Observatory, Russian Academy of Sciences, have been used in this work (Abdo et al. 2009a).
NGC 4486: The radio to UV data compiled for the quiescent phase from the aperture radius of ∼04 by Prieto et al. (2016) have been used in our study.
The radio emission from the kiloparsec jets of NGC 315 and NGC 4261 have been observed owing to the good resolution of VLA. The radio flux of 74 and 50 mJy are observed at 5 GHz for the kiloparsec jet (in the region between 32 and 16
2 from the nucleus) of NGC 315 (Worrall et al. 2007) and (measured in the region between 8
8 and 31
7 from the nucleus) of NGC 4261 (Worrall et al. 2010), respectively.
3.2. X-Ray
NGC 315: Due to low spatial resolution, jet emission cannot be distinguished from the core 6 in XMM-Newton and Swift observations. Recent observation of 2019 taken by XMM-Newton and multiple observations taken by Swift between 2017 and 2018 were combined and analyzed. The details on the data extraction and subsequent analysis for each instrument are given in Sections 3.2.1 and 3.2.2.
Owing to the high spatial resolution of the Chandra observatory, X-ray jet emission has been resolved between 36 and 16
2 from the core. The power-law index for X-ray spectrum is calculated to be α = 1.2 ± 0.2 with an X-ray luminosity of 4.3 (±0.2) × 1040 ergs s−1 in 0.3–5.0 keV (Worrall et al. 2007).
NGC 4261: Due to faintness, low counts were recorded by recent Swift observations and did not provide a good data set, and thus, we compile the previous measurement in X-ray for NGC 4261. The soft X-ray data was recorded by Chandra with an exposure time of 35 ks. The flux (2–10 keV) and photon index are reported to be 6.97 × 10⁻¹³ ergs cm−2 s−1 and  , respectively (Zezas et al. 2005).
Worrall et al. (2010) analyzed 100 ks Chandra observation and could resolve jet emission out to 317 with a photon spectral index α = 1.22 ± 0.22 with an X-ray luminosity of 2.9 (±0.2) × 1039 ergs s−1 in 0.3–5.0 keV.
NGC 1275: The most recent observations with Swift for NGC 1275 suffered from pileup effect and were not analyzed. The soft X-ray data taken from Chandra and hard X-ray data taken from Swift-BAT were reconstructed from previous literature. The photon index and the total integral flux reported in the 2–10 keV band are 2.11 ± 0.16 and 1.14 × 10⁻¹¹ ergs cm−2 s−1 (Tanada et al. 2018). Though Swift-BAT observations could not resolve the nucleus spatially, nonthermal hard X-ray emission from the nucleus with a photon index of  was inferred. The corresponding luminosity was reported to be 8 × 1042 ergs s−1 in the 0.5–8 keV energy band (Ajello et al. 2009).
NGC 4486: There are multiple observations with XMM-Newton from 2017. We analyze the observation with the maximum exposure time. The details of the analysis are given in Section 3.2.1.
The spectral analysis for the reduced data from XMM-Newton and Swift has been performed using XSPEC (Arnaud 1996) version 12.10.0f. The errors are quoted at 90% confidence level.
3.2.1. XMM-Newton
The X-ray Multi-Mirror Mission (XMM-Newton ; Jansen et al. 2001) carries three co-aligned X-ray telescopes observing in an energy range 0.1–15 keV. We utilize the data from three European Photon Imaging Cameras (EPICs) on board XMM: PN (Strüder et al. 2001), MOS1, and MOS2 (Turner et al. 2001). The observation data files are obtained from the XMM-Newton Science archive 7 (XSA) and are reduced using the Science Analysis System (SAS; v18.0.0). The event list obtained is filtered of any high flaring background activity, which is further used to obtain the science products using single events (PATTERN = 0) ≥ 0.3 keV for MOS and up to 12 keV for the EPIC-pn camera. Only events with pattern 04 (single and double) for the PN and 012 for the MOS were selected. The EPIC observations are corrected for pileup, if present. The response matrix files using the SAS task rmfgen is generated, while the ancillary response files are generated using the task arfgen in SAS.
The spectral analysis was performed in the energy range 0.5–10.0 keV. The photoelectric cross sections and the elemental abundances of Wilms et al. (2000) are used throughout to account for absorption by neutral gas. An absorbed Galactic column density fixed to the value obtained by the w3Nh tool 8 was applied to the spectral models to account for the Galactic absorption.
NGC 315: A ∼50.9 ks observation of NGC 315 was made by XMM-Newton on 2019 January 27 (Obs ID: 0821871701). The EPIC-pn and MOS cameras on board XMM-Newton were operated in Prime Full Frame using the medium filter. We extract the source events from a circle of radius 25″ centered on the source. The background events are extracted from a circle of radius 50″ on the same CCD away from source. We group the spectra to have a signal-to-noise ratio of 3 with a minimum of 20 counts per bin to have better statistics, thus allowing the use of χ2 statistics. All three EPIC spectra were fitted simultaneously, allowing for cross-normalization between them. The spectra are fitted with model (ztbabs*po)+mekal with a reduced-χ2 value 1.18 (190 d.o.f). The model ztbabs and mekal take into account the intrinsic absorption and the thermal emission below 2 keV, respectively. We obtain a power-law index of 1.73 ± 0.10 and an average flux of  ergs cm−2 s−1 over an energy range 2.0-10.0 keV.
NGC 4486: We analyze a 132 ks observation (Obs. ID:0803670501) taken on 2017 July 6. Following the analysis of XMM-Newton by Böhringer et al. (2001), we extracted source spectra from circular regions of 4″ for each PN, MOS1, and MOS2. The background spectra for each were extracted from a circular region of 20″ away from the source. We group the spectra to have a signal-to-noise ratio of 3. For PN and MOS1, we group the spectra to have minimum of 25 counts per bin. Due to low counts in MOS2, we bin the spectra with a minimum of 1 count per bin. Following this, the three spectra could not be fitted simultaneously, because χ2 statistics could not be used for the MOS2 spectrum. We fit the PN spectrum with a powerlaw plus mekal model with a reduced-χ2 value of 1.21 (75 d.o.f.). The addition of another absorption component for intrinsic absorption was not significant. The flux and power-law index obtained for the best fit in the energy range 2.0–10.0 keV are  ergs cm−2 s−1 and
  , respectively. We obtain a temperature value of
  keV with abundance set at 1, which is compatible with the values obtained by Donato et al. (2004). We use the same model for the MOS1 and MOS2 spectra. A power-law index of
  and corresponding flux of
  ergs cm−2 s−1 in the 2.0–10.0 keV range are obtained for MOS1 with a reduced-χ2 value of 1.3 (34 d.o.f.). Due to poor statistics, the parameters could not be well constrained for MOS2 and thus are ignored (though a rough fit provides values compatible with those obtained with PN and MOS1 spectra).
3.2.2. Swift
The Swift X-ray telescope (XRT; Burrows et al. 2005) is a focusing X-ray telescope on board the Neil Gehrels Swift Observatory, operating in the energy range of 0.3–10 keV. We have analyzed archival Swift-XRT data, observed in Photon-Counting (PC) mode. XRT data reduction was performed using the standard data pipeline package (XRTPIPELINE v0.13.5) in order to produce cleaned event files. Source events are extracted within a circular region with a radius of 30″ centered on the source positions, while background events are extracted from a source-free region of radius 60″ close to the source region of interest. The spectra is obtained from the corresponding event files using the XSELECT v2.4g software; we created the ancillary response file using the task xrtmkarf. The photoelectric cross sections and the solar abundances of Wilms et al. (2000) are used to account for absorption by neutral gas. An absorbed Galactic column density derived for the source from Kalberla et al. (2005) (obtained with w3Nh tool) was applied to the spectral model.
NGC 315: Due to low counts in a single spectra, we combine the spectra at multiple epochs using the FTOOLS task addspec. The background spectra are summed using the task mathpha. We bin the spectra as to contain minimum of 5 counts per bin using task grppha. We use Cash statistics instead of χ2 statistics since the number of counts per bin is lesser than 20. We summed 11 spectra obtained between 2017 and 2018 to get a total exposure of 20.8 ks. We fit the resultant spectrum using an absorbed power law (ztbabs*po) and found a good fit with a C-stat of 76.12 for 52 d.o.f. The residuals below 2 keV are further modeled by adding a mekal component at kT = 0.56 keV, improving the C-stat with a value of 58.18 (for 50 d.o.f.). This value is in agreement with the value found by González-Martín et al. (2006). The average flux and photon index obtained in the energy range 2.0–10.0 keV are  ergs cm−2 s−1 and
  , respectively.
3.3. Gamma-Ray Data from Fermi-LAT
The data collected by Fermi-LAT during a period of 10.25 yr for NGC 315 and NGC 4261 was analyzed by de Menezes et al. (2020). We analyzed the data set collected over a period of 12 yr ranging from 2008 August 4 to 2020 August 21 for all 4 sources with fermitools v2.0.0, fermipy v1.0.0 (Wood et al. 2017), and Pass 8 event processed data (Atwood et al. 2013). The events are selected in the 100 MeV to 300 GeV energy range in a 15° × 15° region of interest (ROI) centered on the positions of each AGN. The data are binned spatially with a scale of 01 per pixel and eight logarithmically spaced bins per energy decade.
We only selected the Source class events (evclass = 128 and evtype = 3) with the recommended filter expression (DATA_QUAL > 0 && LAT_CONFIG == 1). Also, a maximum zenith angle cut of 90° was applied to reduce the contamination from secondary γ-rays from Earth’s limb.
We included the standard diffuse templates, “gll_iem_v07” and “iso_P8R3_SOURCE_V2_v1,” available from the Fermi Science Support Center 9 (FSSC), to model the Galactic diffuse emission and isotropic extragalactic emission, respectively.
To quantify the significance of γ-ray detection from each source, we used the test statistics (TS) 10 obtained in binned likelihood analysis using minuit.
3.3.1. Spectral Models for Fitting Gamma-Ray Data
A binned maximum likelihood analysis is performed by taking into account all the sources included in the updated fourth source catalog (4FGL-DR2; Abdollahi et al. 2020; Ballet et al. 2020) and lying up to 5° outside the ROI in order to obtain the spectral parameters and the significance of detection of the source.
Automatic optimization of the ROI was performed using function optimize within the package to ensure that all the parameters are close to their global likelihood maxima. To look for any additional sources in our model, which are not included in the 4FGL (or 4FGL-DR2) catalog, we used find_sources() with a power-law model with index 2, sqrt_ts_threshold = 5.0 and min_seperation = 0.5. Additional sources, when detected with TS>25, were included during the LAT analysis.
The normalization of all the sources with a radius of 5° from the ROI and the isotropic and Galactic diffuse emission templates were left to vary. The spectral shape parameters of the four LLAGNs were also kept free while those of the other sources were fixed at the values in the 4FGL catalog.
The following spectral models are explored for the whole energy range:
- 1.
- 2.Log-Parabola:where No , α, and β are the free parameters.

- 3.Power Law with Exponential Cutoff:where No , Γ, and Ec are the free parameters.



3.3.2. Results of Gamma-Ray Spectral Analysis
To determine the best-fit spectral model of each source, the significance of the spectral curvature is determined. The spectral curvature is significant if TScurve > 16 (corresponding to 4σ; Acero et al. 2015).
NGC 315: No significant curvature is seen in the γ-ray SED of NGC 315. Its γ-ray spectrum is defined by a power law with Γ = 2.53 ± 0.11 detected with ≈11.1σ (TS = 123.7). An integrated flux of 3.1 (±0.41) × 10−12 ergs cm−2 s−1 over 0.1–300 GeV is obtained.
NGC 4261: It is the faintest in our sample with a statistical significance detection of 8.2σ (TS = 67.24). As can be seen in Figure 1, no cutoff is seen in the spectrum. The 12 yr averaged spectrum obtained is well represented by a power law with Γ = 2.04 ± 0.15 with a corresponding integrated flux over 0.1–300 GeV of 2.27(±0.4) × 10−12 ergs cm−2 s−1.
NGC 1275: Figure 1 clearly indicates a curvature in the spectrum. The source is detected with a high statistical significance of 376.6σ (TS = 141829.6) with our likelihood analysis. The log-likelihood ratio test (ΔTS ∼ 383.6 i.e., 19.6σ) signifies that a log-parabola model is a better representation over a single power-law model with an integrated flux of 3.1 (±0.03) × 10−10 ergs cm−2 s−1 over the energy range 0.1–300 GeV with best-fit indices α = 2.08 ± 0.01 and β = 0.065 ± 0.003.
NGC 4486: The source was detected with a high statistical significance TS = 1844.52 (∼43σ) with our likelihood analysis. The average spectrum is well defined by a power law of photon index, Γ = 2.04 ± 0.03, and integrated flux, F0.1−300GeV = 1.94 (±0.09) × 10−11 ergs cm−2 s−1.
4. Multiwavelength SED Modeling
We consider a homogeneous and spherical emission region of radius R moving through the magnetic field B inside the jet with a bulk Lorentz factor Γb . This region contains relativistic plasma of electrons and protons and emits radiation through the synchrotron and IC processes.
A simple power-law injection spectrum is expected in the case of a Fermi-I type acceleration. While a power law is supported by the γ-ray SED fits for NGC 315, NGC 4261, and NGC 4486, the presence of curvature in the γ-ray SED of NGC 1275 hints at a different particle distribution. As suggested by Massaro et al. (2004), the injected particles may show an intrinsic curvature following a log-parabolic distribution due to energy-dependent acceleration, which is supported by the best-fit results for the γ-ray SED of NGC 1275.
Thus, we consider a constant injection spectrum Q = Q(E) following a power-law distribution,

for NGC 315, NGC 4261, and NGC 4486 and a log-parabola distribution,

for NGC 1275, where Eref = 1 TeV is the reference energy. The injection spectral index (α), the curvature index (β), and the normalization constant of the spectrum (Lo ) are free parameters and are determined from the modeling.
We calculate the particle spectrum N = N(E, t) at a time t at which the spectrum is assumed to attain a steady state under the continuous injection of particles described by Q(E) and energy losses given by the energy-loss rate b = b(E, t) using publicly available time-dependent code GAMERA 11 (Hahn 2015). The code solves 1D transport equation,

where tesc is the timescale over which the leptons escape from the emission region.
We consider escape time as  and ηesc is considered as a free parameter (≥1). The code, subsequently, calculates the synchrotron and IC emission, which is Doppler boosted by a factor of δ4 in the observer’s frame due to relativistic beaming.
 ![$\delta ={[{{\rm{\Gamma }}}_{b}(1-\beta \cos \theta )]}^{-1}$](https://content.cld.iop.org/journals/0004-637X/919/2/137/revision1/apjac1588ieqn20.gif) is the Doppler factor, Γb
is the bulk Lorentz factor, β is the intrinsic speed of the emitting plasma, and θ is the viewing angle of the jet with respect to the line of sight of the observer.
is the Doppler factor, Γb
is the bulk Lorentz factor, β is the intrinsic speed of the emitting plasma, and θ is the viewing angle of the jet with respect to the line of sight of the observer.
The simulated SEDs are fitted to the data points by adjusting the parameters given in Table 2.
Table 2. Parameter Values for the Best-fit One-zone Leptonic SSC Model
| Parameter | Symbol | NGC 315 | NGC 4261 | NGC 1275 | M87 |
|---|---|---|---|---|---|
| Injection Spectrum Type | Qi | Power-Law | Power-Law | Log-Parabola | Power-Law |
| Minimum Electron Lorentz factor | γmin | 35 | 190 | 72 | 40 |
| Maximum Lorentz factor | γmax | 2.5 × 10⁴ | 1.6 × 10⁴ | 5.4 × 10⁵ | 2.8 × 10⁶ |
| Escape time coefficient | ηesc | 1 | 1 | 1 | 6 |
| Alpha | α | 2.2 | 2.06 | 2.25 | 2.27 |
| Beta (Curvature Index) | β | ⋯ | ⋯ | 0.015 | ⋯ |
| Lorentz factor | Γb | 1.5 | 1.5 | 1.8 | 3.3 |
| Doppler Factor | δ | 1.6 a | 1 a | 2.3 b | 2.3 c |
| Blob radius (cm) | R | 1.1 × 10¹⁶ | 1 × 10¹⁶ | 3.13 × 10¹⁷ | 4.1 × 10¹⁵ |
| Magnetic field (G) | B | 0.21 | 0.21 | 0.07 | 0.24 |
| Jet power in electrons (ergs s−1) | Pe | 3.9 × 1037 | 4.8 × 1037 | 8.1 × 1036 | 1.04 × 1037 |
| Jet power in magnetic field (ergs s−1) | PB | 4.5 × 1040 | 3.72 × 1040 | 5.8 × 1042 | 3.9 × 1040 |
| Jet power in cold protons d (ergs s−1) | Pp | 4.7 × 1038 | 1.12 × 1038 | 2.69 × 1037 | 1.06 × 1038 |
| Total jet power (ergs s−1) | P | 4.5 × 1040 | 3.74 × 1040 | 5.8 × 1042 | 3.96 × 1040 |
| Eddington jet power (ergs s−1) | Pedd | 9.9 × 1046 | 6.1 × 1046 | 3.60 × 1045 | 8.17 × 1047 |
Notes.
a Adopted from de Menezes et al. (2020). b Adopted from Abdo et al. (2009a). c It is close to the value (δ = 2.8) used by Fraija & Marinelli (2016). d Assuming the number of protons is equal to the number of radiating electrons in the jet.Download table as: ASCIITypeset image
The total required jet power is calculated as

where  , and
, and  are the energy densities of electrons, magnetic field, and protons in the comoving frame of jet, respectively. These are defined as follows:


and

where V is the volume of the emission region, mp is the mass of protons, and np is the number density of protons, which is equal to the number density of electrons, assuming the jet contains equal numbers of electrons and protons to maintain charge neutrality.
4.1. SSC Model for Jet Emission
As for blazars, the SEDs of most radio galaxies are well interpreted by a single-zone SSC model (e.g., Abdo et al. 2010, 2009b). Within this framework, radio to optical photons are produced by synchrotron radiation of the nonthermal electron population in the magnetic field, and X-ray to higher-energy photons are produced by upscattering of the synchrotron photons by the same electron population. While this model can explain the broadband SED of NGC 1275 and NGC 4486 up to 0.3 TeV and 8 GeV, respectively, it fails to do so for NGC 315 beyond 1.6 GeV and NGC 4261 beyond 0.6 GeV. The modeling results can be seen in Figure 6.
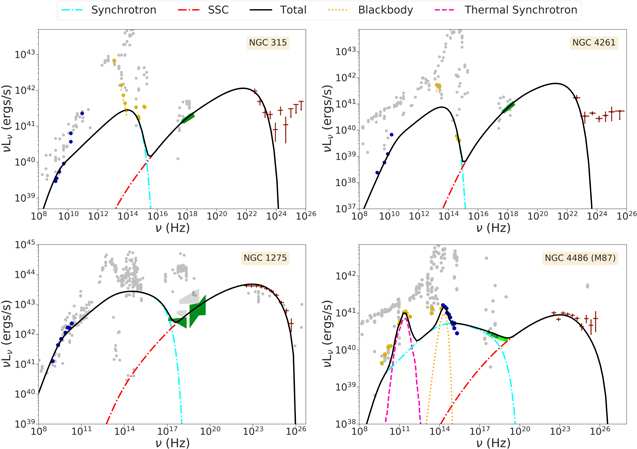
Figure 6. One-zone leptonic modeling of broadband emission from subparsec-scale jets of the four LLAGNs. The thermal synchrotron and the blackbody components of M87 have been reproduced from Lucchini et al. (2019). The γ-ray data beyond 1.6 GeV from NGC 315 and 0.6 GeV from NGC 4261 cannot be explained with one-zone SSC model.
Download figure:
Standard image High-resolution image4.2. Multiwavelength Emission from Extended Jet
The low angular resolution of instruments at γ-ray energies does not allow to distinguish between jet and the extended jet emission. We invoke the emission from the kiloparsec-scale jets of NGC 315 and NGC 4261 as the SSC emission from their subparsec-scale jets cannot fit the γ-ray data points beyond 1.6 and 0.6 GeV energy, respectively.
The radio and X-ray photon flux from the extended jets of NGC 315 and NGC 4261 can be well fitted by synchrotron emission from the relativistic electrons (Worrall et al. 2007, 2010). This implies that the extended jets could be also sources of HE and VHE photons due to IC scattering of starlight photons from the host galaxy by the relativistic electrons in the extended jets (Stawarz et al. 2003). The starlight energy density at the extended jet of NGC 4261 has been adopted from Worrall et al. (2010). For NGC 315, the typical energy density of starlight in a kiloparsec-scale jet for FR I radio galaxies has been adopted (Stawarz et al. 2006). We have also considered IC/cosmic microwave background (CMB) emission, as has been suggested for other large-scale X-ray jets (Zacharias & Wagner 2016), where CMB photons are upscattered by the relativistic electrons, but it is found to be subdominant compared to IC/starlight emission.
We calculate the synchrotron, IC/starlight, and IC/CMB emission from kiloparsec-scale jets by considering a constant escape time of electrons from the emission region as R/c. We assume the same bulk Lorentz factor and viewing angle for the spherical emission region or blob in the kiloparsec-scale jet as that in the subparsec-scale jet. The results are shown in Figure 7 and the corresponding parameters are given in Table 3.
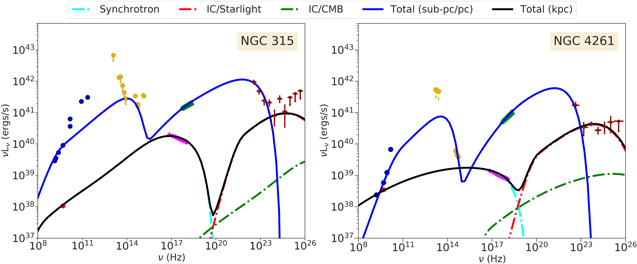
Figure 7. Leptonic model for emission from subparsec (blue) and extended jets (black) for NGC 315 and NGC 4261. The radio and X-ray data for the extended jets are shown in red and pink, respectively.
Download figure:
Standard image High-resolution imageTable 3. Parameter Values for the Best-fit One-zone Leptonic Model for Kiloparsec Jet
| Parameter | Symbol | NGC 315 | NGC 4261 |
|---|---|---|---|
| Starlight energy density | Ustar(ergs s−1) | 2.25 × 10⁻⁹ | 2.09 × 10⁻¹⁰ |
| Dust energy density | Udust(ergs s−1) | 2.25 × 10⁻¹¹ | 2.09 × 10⁻¹² |
| CMB energy density | Ucmb(ergs s−1) | 9.×10−13 | 9.×10−13 |
| Minimum Lorentz factor | γmin | 1400 | 220 |
| Maximum Lorentz factor | γmax | 5.0 × 10⁸ | 5.2 × 10⁸ |
| Spectral index | α | 2.1 | 2.16 |
| Curvature index | β | 0.025 | 0.084 |
| Magnetic field | B (G) | 10 × 10−6 | 5.7 × 10⁻⁶ |
| Radius | R (cm) | 5 × 10²¹ | 1 × 10²¹ |
| Escape time factor | ηesc | 1 | 1 |
| Bulk Lorentz factor | Γb | 1.5 | 1.5 |
| Doppler factor | δ | 1.6 | 1 |
| Total kiloparsec jet power | Ptot (ergs s−1) | 2.1 × 1043 | 2.7 × 1041 |
Download table as: ASCIITypeset image
5. Summary and Conclusions
LLAGNs are important to study as their number is expected to be much higher than that of high-luminosity AGNs, and they have been speculated to be acceleration sites of cosmic rays (Das et al. 2020; Rodrigues et al. 2021). Detection of these sources by γ-ray detectors is necessary to support this speculation. The four LLAGNs NGC 315, NGC 4261, NGC 1275, and NGC 4486 have been detected in γ-rays before, hence we have selected these sources for a more extended analysis. We have analyzed the XMM-Newton data from NGC 315 and NGC 4486 and Swift data from NGC 315. We have also analyzed the Fermi-LAT data for all four LLAGNs, NGC 315, NGC 4261, NGC 1275, and NGC 4486, for a period of 12 yr (2008–2020). We have combined the archival multiwavelength data of these sources with our analyzed data to build the broadband SEDs of these sources (see Figures 2, 3, 4, and 5). We have found the best-fitted models for the Fermi-LAT data (see Figure 1) and the parameters of the fitted models are given in Table 1.
For NGC 4486, we find the best-fit describing the Fermi-LAT SED is a power law, which is consistent with the best fit obtained for the combined Fermi-LAT and MAGIC data (MAGIC Collaboration et al. 2020) for 2012–2015, hence we have used a power-law electron distribution in our modeling to fit the multiwavelength SED.
The γ-ray data points of NGC 315 and NGC 4261 are also found to be well represented by a power-law spectral model, while for NGC 1275, a log-parabola distribution gives a better fit to the γ-ray data. We have considered SSC emission from subparsec-scale jets of these sources to fit the multiwavelength data points (see Figure 6), and the corresponding values of the parameters of our model are given in Table 2. We have included the emission from the extended kiloparsec-scale jets of NGC 315 and NGC 4261 to explain the γ-ray data points at higher energies (see Figure 7); the corresponding values of the model parameters are given in Table 3.
de Menezes et al. (2020) analyzed 10.25 yr of Fermi-LAT data and simulated the multiwavelength SED of NGC 315 and NGC 4261 using a one-zone SSC model to compare with the observational data. The radio flux estimated in their model is lower than the observed flux for both NGC 315 and NGC 4261.
Abdo et al. (2009a) used a one-zone SSC model to fit the multiwavelength data from NGC 1275; however, their model gives a higher X-ray flux compared to the observed flux.
For NGC 4486, a multizone model has also been proposed to explain the radio to X-ray emission, which gives a lower γ-ray flux (Lucchini et al. 2019) compared to the observed flux.
While ADAF or jet dominance for X-ray emission from LLAGNs remains under debate, we show that synchrotron and SSC emission from relativistic electrons in subparsec-scale jets can explain the observed multiwavelength data from NGC 1275, up to 1.6 GeV from NGC 315, up to 0.6 GeV from NGC 4261, and up to 8 GeV from NGC 4486. At higher energy, IC scattering of starlight photons by electrons accelerated in kiloparsec-scale jets of NGC 315 and NGC 4261 can explain the observed γ-ray flux. The maximum value of Lorentz factor of the order 108 obtained to fit the X-ray and γ-ray data indicates that the electrons are accelerated to ultrarelativistic energies in the kiloparsec jets. Such high Lorentz factors also favor the synchrotron origin of X-rays from these jets as suggested before by Worrall et al. (2007, 2010). It is also noted that strong emission of starlight photons from the host galaxy is required for these objects to be seen in GeV γ-rays. Kiloparsec-scale jet is also present in NGC 4486, whose radio to X-ray emission has been modeled earlier with synchrotron emission of relativistic electrons (Sun et al. 2018). These relativistic electrons may also be emitted by the IC mechanism and contribute to the observed γ-ray flux. The hadronic model has been used earlier to explain the HE γ-ray data (Marinelli et al. 2014; Fraija & Marinelli 2016). Detailed modeling of NGC 4486 to explain the HE γ-ray data is beyond the scope of this paper.
Centaurus A is also considered to be an LLAGN as the luminosity of its Hα emission is less than 1040 ergs s−1 (Brodatzki et al. 2011). Earlier, H.E.S.S. reported extended TeV γ-ray emission from this LLAGN (H.E.S.S. Collaboration et al. 2020). They explained the VHE γ-ray emission as IC scattering of mainly the dust photons by ultrarelativistic electrons in the kiloparsec-scale jet of this source. The extended X-ray emission from the kiloparsec-scale jet of this source is explained as synchrotron emission of ultrarelativistic electrons. The kiloparsec-scale jets may also be the acceleration sites of protons and heavy nuclei, which may contribute to the observed spectrum of ultrahigh-energy cosmic rays. More observations of HE γ-rays from nearby LLAGNs would be useful to understand their role as cosmic particle accelerators.
The authors would like to thank the referee for the valuable comments and suggestions to improve the manuscript. This research has made use of archival data (from Swift and XMM-Newton telescopes) and software/tools provided by NASA’s High Energy Astrophysics Science Archive Research Center (HEASARC), 12 which is a service of the Astrophysics Science Division at NASA/GSFC. This work has also made use of public Fermi-LAT data obtained from Fermi Science Support Center (FSSC), provided by NASA Goddard Space Flight Center. R.P. acknowledges the support of the Polish Funding Agency National Science Centre, project 2017/26/A/ST9/00756 (MAESTRO 9), and MNiSW grant DIR/WK/2018/12.
Software: HEAsoft (v6.26.1; https://heasarc.gsfc.nasa.gov/docs/software/heasoft/), SAS (v18.0; Gabriel et al. 2004), XSPEC (v12.10.0f; Arnaud 1996), fermipy (v1.0.0; Wood et al. 2017), GAMERA (Hahn 2015).
Footnotes
- 3
Thin disk, here, refers to the geometrically thin, optically thick disk.
- 4
- 5
NRAO is a facility of the National Science Foundation operated under cooperative agreement by Associated Universities, Inc.
- 6
Here, we define core as the data corresponding to the unresolved structures.
- 7
- 8
- 9
- 10
TS = -2 (log
—log) where and are the maximum likelihood for the model without an additional source and with an additional source at the specified location, respectively (Mattox et al. 1996). - 11
- 12


