Abstract
This study statistically compares ion properties between the thermal core and total ion populations in the Martian magnetosheath, based on observations collected by the Mars Atmosphere and Volatile EvolutioN (or MAVEN) spacecraft from 2015 to 2023. Ion moments for the core population are derived by fitting measured three-dimensional ion velocity distributions with bi-Maxwellian functions, whereas those for the total population are obtained by directly computing weighted sums over the distributions. The core population accounts for a median of approximately 80% of the total number density and dominates the bulk flow of the total population. In contrast, the total population exhibits significantly higher temperature, thermal pressure, and plasma beta, primarily due to the presence of suprathermal ions. Both populations exhibit greater temperature anisotropies downstream of quasi-perpendicular shocks compared to quasi-parallel shocks, consistent with stronger shock compression and a greater contribution from gyrating reflected ions under quasi-perpendicular conditions. Notably, the core population consistently exhibits significantly higher temperature anisotropy than the total population under both shock geometries, suggesting the presence of additional perpendicular heating mechanisms acting on the core population beyond shock compression. One plausible mechanism is stochastic energization by kinetic Alfvén waves. Overall, this systematic comparison of ion parameters between the core and total populations provides new insights into the thermodynamic structure and governing processes of the Martian magnetosheath.
Original content from this work may be used under the terms of the Creative Commons Attribution 4.0 licence. Any further distribution of this work must maintain attribution to the author(s) and the title of the work, journal citation and DOI.
1. Introduction
In contrast to Earth, which possesses a global intrinsic magnetic field, Mars lacks such a field, leading to a direct interaction between the solar wind and the Martian ionosphere (A. Nagy et al. 2004). Despite this fundamental difference, the solar wind interaction at Mars exhibits several features analogous to those observed at Earth. As the solar wind encounters Mars, it creates a complex plasma environment consisting of an induced magnetosphere, a bow shock, and a magnetosheath (E. Dubinin et al. 2006; C. Bertucci et al. 2011; J. S. Halekas et al. 2021). The interplanetary magnetic field (IMF) can pile up outside the ionosphere due to mass loading (K. Szego et al. 2000), in which planetary ions are incorporated into the solar wind, increasing its mass density and slowing the flow. The resulting compression of the magnetic field balances the solar wind dynamic pressure, leading to the formation of an induced magnetosphere (M. K. G. Holmberg et al. 2019; C. Zhang et al. 2025). Consequently, a bow shock forms upstream of Mars as a result of the interaction between the supersonic solar wind and the induced magnetosphere. Across the bow shock, the plasma flow is decelerated from supersonic to subsonic speeds, with upstream kinetic energy dissipated and converted into thermal energy, resulting in heating and partial thermalization of charged particles (C. Mazelle et al. 2004). Multiple dispersive and dissipative processes contribute to ion heating at the shock (C. F. Kennel et al. 1985; N. Sckopke 1995).
The Martian magnetosheath lies between the bow shock and the induced magnetosphere boundary, serving as the region where the solar wind plasma undergoes deceleration, heating, thermalization, compression, and deflection (J. G. Luhmann 1992). Under the magnetohydrodynamic framework, the shocked solar wind plasma just downstream of the bow shock can be approximately described by Rankine–Hugoniot jump conditions (C. T. Russell et al. 2016). As solar wind ions traverse the bow shock, they develop a broader energy distribution due to partial thermalization. The magnetosheath is often characterized by broadband electromagnetic fluctuations whose energy spectra follow a power-law distribution (E. A. Lucek et al. 2005). This spectral signature, along with the spatially irregular and chaotic nature of the fluctuations, indicates a turbulent plasma environment. These fluctuations are not merely a superposition of linear wave modes but likely involve nonlinear processes that govern the region’s plasma dynamics. Unlike Earth’s magnetosheath, which greatly exceeds the characteristic kinetic scales of solar wind ions, the Martian magnetosheath is comparable in scale to the ion gyroradius (S. H. Brecht 1990). As a result, solar wind ions may not fully thermalize before reaching the induced magnetosphere under typical solar wind conditions (S. Moses et al. 1988). This scale constraint leads to a fundamentally kinetic interaction regime, allowing the shocked solar wind to more directly influence the Martian magnetosphere and ionosphere (Y. Ma et al. 2004; D. A. Brain 2006; H.-W. Shen et al. 2024; Y. Wen et al. 2025). Moreover, the Martian magnetosheath is highly dynamic and rich in wave activity and turbulence (C. T. Russell et al. 1990; R. Z. Sagdeev et al. 1990; J. R. Espley et al. 2004). A variety of plasma waves have been identified, such as Alfvén waves, slow-mode waves, and mirror-mode oscillations (S. Ruhunusiri et al. 2015; C. Simon Wedlund et al. 2023).
In the Martian magnetosheath, the core ion population refers to thermal ions that are approximately in kinetic equilibrium, exhibiting velocity distributions well described by Maxwellian or bi-Maxwellian functions (M. G. Kivelson & C. T. Russell 1995). These ions exhibit a relatively narrow energy spread compared to the more energetic, nonthermal population, which primarily consists of reflected solar wind ions and planetary pickup ions. The reflection of solar wind ions at the bow shock is primarily driven by magnetic mirroring and interaction with the cross-shock electrostatic potential (B. U. Ö. Sonnerup 1969; G. Paschmann et al. 1982). Under quasi-perpendicular shock conditions, reflected ions are largely confined near the shock front, where they gyrate around magnetic field lines within approximately one ion gyroradius of the shock. Upon entering the downstream magnetosheath, these ions retain a large fraction of their original kinetic energy and typically exhibit anisotropic velocity distributions, frequently forming filled-shell or ring-like structures superimposed onto the thermal core population (J. S. Halekas et al. 2017a). As they propagate through the magnetosheath, they gradually interact with ambient plasma waves and fields, leading to partial deceleration and isotropization over characteristic spatial and temporal scales. In contrast, reflected ions at quasi-parallel shocks can escape far upstream along magnetic field lines. As such, the contribution of reflected ions to the downstream ion population is highly asymmetric across shock geometries. Pickup ions, on the other hand, originate from atmospheric neutral particles that become ionized through photoionization or charge exchange. Once ionized, they are accelerated by the ambient motional electric field (Y. Dong et al. 2015; A. Rahmati et al. 2015). Together, these suprathermal ions substantially complicate the velocity space, enhance wave activity, and play a crucial role in shaping plasma dynamics and energy transport within the Martian magnetosheath.
In the present study, we compare the spatial distributions and probability density functions of various ion parameters between the core and total ion populations in the Martian magnetosheath. These parameters include number density, bulk speed, and temperature anisotropy, as well as the perpendicular and parallel components of temperature, thermal pressure, and plasma beta. The rest of this paper is organized as follows. Section 2 provides a brief overview of the relevant instruments on board the Mars Atmosphere and Volatile EvolutioN (MAVEN) spacecraft, and describes the methodology used to identify magnetosheath intervals from MAVEN observations. Section 3 outlines the procedures for deriving plasma moments for both the core and total ion populations. In Section 4, we present statistical comparisons of ion properties between the two populations and discuss the physical mechanisms underlying the observed differences. Section 5 offers an in-depth discussion of a notable finding, including a simple test to evaluate the proposed interpretation. Finally, Section 6 summarizes the key results and conclusions of this study.
2. Overview of MAVEN Instruments and Identification of Magnetosheath Intervals
The MAVEN spacecraft arrived at Mars in 2014 September. Its primary mission is to investigate the dynamics of the upper atmosphere and ionosphere, as well as their interactions with the solar wind (B. M. Jakosky et al. 2015). Equipped with a comprehensive suite of instruments for measuring charged particles and magnetic fields, MAVEN provides the most detailed observations to date of the Martian magnetosheath. This study utilizes data from the Magnetometer (MAG; J. E. P. Connerney et al. 2015) and the Solar Wind Ion Analyzer (SWIA; J. S. Halekas et al. 2015) instruments. MAG measures the in situ magnetic field vector with a dynamic range of ±65,536 nT and a resolution as fine as 0.008 nT, offering high-fidelity measurements at a cadence of 32 Hz. SWIA is a toroidal electrostatic analyzer designed to measure solar wind and magnetosheath ions. It features a wide field of view (FOV) of 360° × 90°, covering nearly the full sky. This instrument resolves 96 energy steps ranging from 25 eV to 25 keV with an energy resolution of approximately 15%. It employs 24 deflection steps spanning ±45° in the polar (theta) direction and 24 anodes to cover the full azimuthal (phi) range. These combined measurements yield time-resolved, three-dimensional ion velocity distributions at a cadence of 4 s. Although SWIA does not offer mass-resolved measurements, it can still reliably capture the bulk properties of protons in the solar wind and magnetosheath, where contributions from heavy ions are generally negligible. The raw three-dimensional distribution data are processed into two primary data products. The coarse product reduces data volume by aggregating adjacent energy bins, deflection steps, and anodes, resulting in a grid of 48 energy bins × 16 anodes × 4 deflection steps per time step. This product retains a 15% energy resolution and an angular resolution of approximately 22.5°. In contrast, the fine product is optimized for identifying the peak of the ion distribution within each small angular bin, yielding a higher-resolution format of 48 energy bins × 10 anodes × 12 deflection steps, achieving a finer energy resolution of ∼7.5% and an angular resolution of 4.5° × 3.75°, enabling detailed investigations of ion distribution structures and plasma dynamics.
To identify magnetosheath intervals from MAVEN magnetic field and ion measurements, we examine transitions in plasma properties and magnetic field structures as the spacecraft crosses the bow shock and the induced magnetosphere boundary. A bow-shock crossing is characterized by sharp gradients in multiple parameters (C. Bertucci et al. 2005; J. Fruchtman et al. 2023). As MAVEN enters the magnetosheath from the upstream solar wind, a typical signature is the broadening of the ion energy spectrum, indicative of ion deceleration and collisionless thermalization at the shock front. This transition is also accompanied by a drop in ion bulk velocity, an increase in ion density, and an enhancement in both the magnetic field magnitude and its fluctuations relative to upstream conditions. Further downstream, as the spacecraft enters the induced magnetosphere, the magnetic field strength typically increases abruptly while fluctuations diminish, signaling the presence of a more structured and draped magnetic configuration (D. Vignes et al. 2000; C. Bertucci et al. 2004; J. S. Halekas et al. 2018; M. K. G. Holmberg et al. 2019). At the same time, the ion energy spectrum narrows, with overall lower ion energies compared to the broader, higher-energy distributions observed in the magnetosheath.
In addition to manually identifying the plasma and magnetic field signatures described above, we incorporate results from the region classification algorithm developed by J. S. Halekas et al. (2017b), which is publicly available through the IDL SPEDAS framework (V. Angelopoulos et al. 2019). This algorithm classifies plasma regions—such as the pristine solar wind, magnetosheath, ionosphere, and tail lobe—based on a combination of parameters, including ion velocity, temperature, and density, as well as spacecraft location and both the magnitude and variability of the magnetic field. Incorporating automated classification enhances the consistency and objectivity of magnetosheath interval identification. Figure 1 illustrates an example of this process. We begin by manually identifying bow-shock and induced magnetosphere boundary crossings through visual inspection of plasma and magnetic field data. These crossings are then used to delineate the corresponding magnetosheath intervals. To ensure consistency, the manually defined intervals are cross-checked against the algorithm’s output. If any portion of an interval falls outside the region classified as magnetosheath by the algorithm, the boundaries are adjusted to ensure that the entire interval lies within the algorithm-defined region. This procedure ensures that the final intervals are consistently defined as magnetosheath by both manual inspection and automated classification. In the example shown, 11 magnetosheath intervals are identified, each bounded by a pair of magenta vertical lines. Using this combined approach, a total of 24,670 magnetosheath intervals are identified from MAVEN observations spanning 2015–2023.
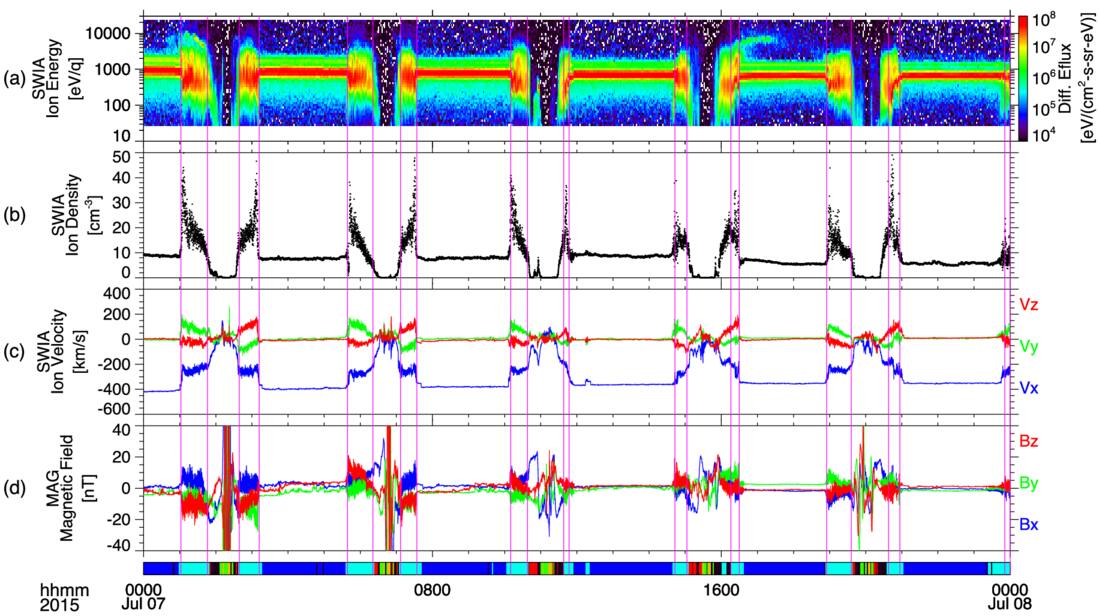
Figure 1. Example of magnetosheath interval identification from MAVEN observations. Panels (a)–(c) display the ion time–energy spectrogram, number density, and velocity from SWIA, respectively. Panel (d) shows the three components of the magnetic field in Mars-solar-orbital coordinates as measured by MAG. The bottom color bar indicates the automated region classification based on the algorithm of J. S. Halekas et al. (2017b), where cyan segments denote intervals identified as magnetosheath. Magenta vertical lines mark the boundaries of 11 magnetosheath intervals, determined through a combination of visual inspection of plasma and magnetic field signatures and results from the automated classification.
Download figure:
Standard image High-resolution image3. Derivation of Moments for the Core and Total Ion Populations
We compute the density, velocity, pressure, and temperature moments of the total ion population by integrating each coarse three-dimensional ion velocity distribution over all energy and angular bins. The number density is obtained as the zeroth-order moment of the distribution, while the bulk velocity is derived from the first-order moment. The full pressure tensor is then calculated in Cartesian coordinates in the spacecraft frame using second-order velocity moments relative to the bulk flow. This tensor is subsequently rotated into magnetic-field-aligned coordinates, where the parallel pressure is aligned with the magnetic field, and the two perpendicular pressures are determined by diagonalizing the transverse components. The corresponding temperatures are calculated by dividing the diagonal elements of the pressure tensor by the number density and the Boltzmann constant. To account for the limited FOV of SWIA, we follow the approach of J. S. Halekas et al. (2017a), excluding observations in which the instantaneous magnetic field direction lies outside the FOV and using the larger of the two perpendicular temperature components as the effective perpendicular temperature.
We estimate the moments of the core ion population by fitting the measured velocity distribution at each time step to a convecting bi-Maxwellian distribution function expressed in a coordinate system defined with respect to the local magnetic field (J. S. Halekas et al. 2023). The analytic form of the distribution function is given by
Here, n is the bulk density, m is the proton mass, and kB is the Boltzmann constant. The parameters T⊥ and T∥ represent the perpendicular and parallel temperatures relative to the magnetic field. The velocity components v⊥1, v⊥2, and v∥ are defined in a magnetic-field-aligned coordinate system, and vb⊥1, vb⊥2, and vb∥ are the corresponding components of the bulk flow velocity. We retrieve the best-fit parameters using a least-squares optimization method combined with a gradient descent algorithm. Because the bi-Maxwellian distribution function is fully parameterized, ion moments—including number density, bulk velocity components, and temperature components—can be directly obtained from the best-fit parameters. To further ensure that the fitted distribution can reliably represent the core ion population, we apply three additional quality-control criteria, established through extensive empirical testing. These criteria are as follows: (1) the difference between the logarithms of the measured and fitted maximum energy fluxes must be less than 0.05; (2) the difference between the logarithms of their minimum energy fluxes must be below 0.5; and (3) the linear correlation coefficient between the logarithms of the measured and fitted peak fluxes, calculated over the top 5% of data points ranked by measured flux, must exceed 0.75. This filtering step enhances the robustness and physical reliability of the derived ion moments. Only fits meeting all three criteria are included in the subsequent statistical analysis.
Figure 2 illustrates an example of a bi-Maxwellian fit applied to a coarse velocity distribution measured by SWIA in the magnetosheath. Panels (a)–(c) display the measured energy fluxes (blue) alongside the corresponding fitted fluxes (red) along three orthogonal directions defined relative to the local magnetic field. The fitted distribution captures the thermal characteristics of the core ion population. In this example, the difference between the logarithms of the measured and fitted maximum fluxes is only about 0.01, resulting in the blue and red horizontal dashed lines nearly overlapping. For the minimum fluxes (indicated by the two horizontal solid lines), the difference is about 0.2. The correlation coefficient between the logarithms of the measured and fitted peak fluxes also exceeds 0.75. Together, these metrics indicate that the fit reliably represents the thermal core population. Panels (e)–(f) display two-dimensional contours of the measured ion velocity distribution, while panels (g)–(h) show the corresponding contours from the fitted bi-Maxwellian distribution, which represents the thermal core ion population. In each panel, the x-axis denotes the velocity component parallel to the ambient magnetic field, and the y-axis represents one of the two perpendicular components. The lower-left corner of panel (f) lists the moments of the total ion population, derived directly from the measured distribution. In contrast, the moments shown in panel (h) are computed from the bi-Maxwellian fit and characterize the core ion population. In this example, the core population accounts for approximately 70% of the total ion density. The remaining approximately 30% corresponds to nonthermal contributions, including suprathermal wings and possibly minor ion species, which are not captured by the bi-Maxwellian model. The bulk flow speeds of the core and total populations are comparable. Both the parallel and perpendicular temperatures of the core population are lower than those of the total population, as nonthermal ions contribute additional energy and broaden the full distribution. The temperature anisotropy, defined as AT = T⊥/T∥, is significantly higher for the core population than for the total population.
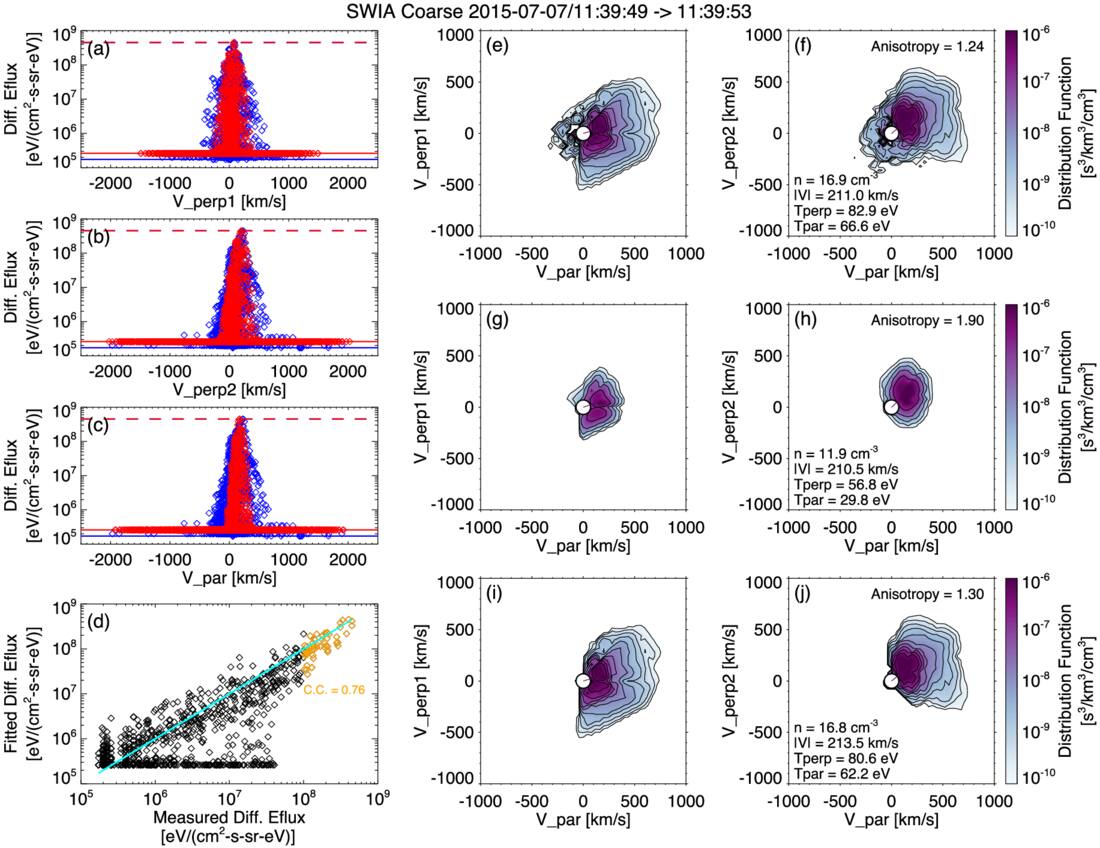
Figure 2. Example of a bi-Maxwellian fit to a SWIA coarse three-dimensional velocity distribution in the Martian magnetosheath. Panels (a)–(c) show one-dimensional cuts of the measured differential energy fluxes (blue markers) and the corresponding bi-Maxwellian fits (red markers) along the two perpendicular directions and the parallel direction in a local magnetic-field-aligned coordinate system. The dashed and solid horizontal lines correspond to the maximum and minimum fluxes, respectively, which are used in the fit-quality criteria. Panel (d) shows a log–log comparison of measured vs. fitted fluxes; the cyan line marks the 1:1 correspondence, and the annotated value indicates the correlation coefficient for the peak fluxes (gold diamonds; see the definition in the main text). Panels (e)–(f) display two-dimensional contours of the measured velocity distribution in planes with respect to the magnetic field direction. Panels (g)–(h) show the corresponding contours from the fitted bi-Maxwellian core population. Panels (i)–(j) present the measured velocity distributions after manual removal of spacecraft-reflected ions.
Download figure:
Standard image High-resolution imageOne may note that the total ion population can include a very small number of ions reflected from the spacecraft which are not part of the ambient magnetosheath plasma but instead result from interactions between incident ions and the spacecraft surface. Although these ions constitute a minor component, their velocities are often directed roughly opposite to the main ion flow and could potentially introduce a slight bias in the temperature anisotropy. Panels (i)–(j) show the velocity distributions for the total population after manual removal of spacecraft-reflected ions, identified based on their angular range. The resulting changes in the derived moments are minimal. While such removal is feasible on a case-by-case basis, it cannot be implemented as a general procedure, since the angular distribution of spacecraft-reflected ions varies across cases. Given the large number of velocity distributions in our data set, performing manual removal for every case is impractical. Therefore, the ion moments used in our statistical analysis are calculated without excluding these ions. To assess their potential impact, we examine a representative set of 45 randomly selected cases from the full data set, and find that the resulting variations in the derived density and bulk velocity are negligible. The influence on the temperature anisotropy is also minor, with deviations not exceeding 6% in any case.
4. Statistical Analysis
The SWIA instrument provides coarse velocity distribution measurements at a 4 s cadence. For each measurement, we derive a set of ion moments for the core population by fitting the measured distribution with a bi-Maxwellian function, and a corresponding set for the total ion population by directly integrating over the distribution. Only observation sets—each containing both core and total ion moments derived from the same measurement—that fully meet the following three criteria are included in our statistical analysis: (1) the instantaneous magnetic field direction must lie within SWIA’s FOV, ensuring reliable estimation of both parallel and perpendicular temperature components; (2) the core ion population must be reliably fitted with a bi-Maxwellian distribution, as described in Section 3; and (3) the orbit must include upstream measurements of the solar wind, which are required for normalizing selected quantities in a subsequent analysis. In total, 191,003 observation sets in the magnetosheath satisfy these criteria and are retained for further analysis.
4.1. Probability Density Functions of Ion Properties
Figure 3 displays probability density functions of ion parameters derived from MAVEN observations in the Martian magnetosheath, with red and blue vertical lines indicating the medians for the core and total populations, respectively. In panel (a), the median number density of the total ion population is approximately 6 cm−3, while that of the core population is about 4.8 cm−3. Panel (b) shows that the bulk speed distributions are similar for both populations, though the core population exhibits a slightly higher median speed. This slight difference may arise from the broader velocity distribution of the total population, which includes suprathermal ions with a wide range of velocities. Panels (d) and (g) present the distributions of perpendicular and parallel ion temperatures, respectively. In both cases, the total population exhibits broader and higher-temperature distributions compared to the core population. Additionally, the perpendicular temperature consistently exceeds the parallel temperature for both populations, indicating the presence of perpendicular temperature anisotropy. This anisotropy is consistent with the prevailing shock geometry at Mars. Unlike Earth, where the Parker spiral angle averages around 45°, Mars typically experiences a larger average Parker spiral angle of approximately 57° (J. A. Slavin & R. E. Holzer 1981), resulting in a higher likelihood of quasi-perpendicular shocks at the Martian bow shock. Indeed, based on estimates of the angle between the magnetic field and the shock normal (see Section 4.2 for details), approximately 76% of the samples used in Figure 3 fall within the quasi-perpendicular regime. Consequently, the statistical distributions shown in Figure 3 are likely dominated by observations downstream of quasi-perpendicular shocks. This geometric bias should be taken into account when interpreting the observed temperature anisotropies and other shock-related features.
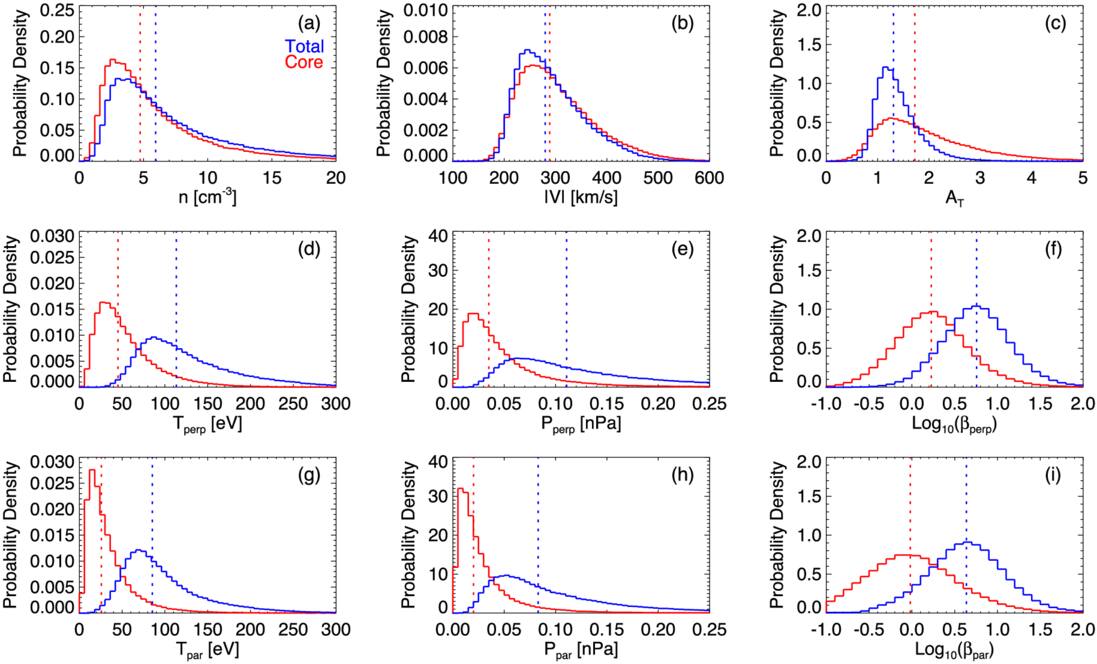
Figure 3. Probability density functions of key ion parameters for the total (blue) and core (red) populations in the Martian magnetosheath. Panels (a)–(c) show the distributions of number density, bulk speed, and temperature anisotropy, respectively. Panels (d)–(f) present the distributions of temperature, thermal pressure, and plasma beta in the perpendicular direction, while panels (g)–(i) show the corresponding parameters in the parallel direction. Vertical dashed lines indicate the median values for each distribution.
Download figure:
Standard image High-resolution imageFor the core ion population, the observed perpendicular temperature anisotropy is most commonly attributed to plasma compression across the shock. According to the Chew–Goldberger–Low (CGL) theory, which describes a collisionless, gyrotropic, and adiabatic plasma with negligible heat flux, strong magnetic field amplification at quasi-perpendicular shocks leads to preferential perpendicular heating (G. F. Chew et al. 1956). While the CGL assumptions may not strictly hold across the shock, the theory provides a useful first-order approximation for describing compression-driven anisotropy in the core population just downstream of the shock. This anisotropy is predicted to fall within the range of ∼1–2. On the other hand, the temperature anisotropy observed in the total ion population is typically dominated by the suprathermal population, primarily comprising reflected solar wind ions and planetary pickup ions, with a comparatively minor contribution from the thermal core. Pickup ions are mainly accelerated perpendicular to the magnetic field by the solar wind motional electric field following their production through the ionization of atmospheric neutrals. Reflected ions can gain substantial perpendicular energy through shock drift acceleration and subsequently gyrate around magnetic field lines near the shock front. Upon entering the downstream magnetosheath, these ions contribute significantly to the increase in perpendicular temperature, especially under quasi-perpendicular shock conditions where strong magnetic field compression and limited opportunities for parallel escape along field lines promote efficient perpendicular energization. These gyrating reflected ions can exhibit perpendicular-to-parallel velocity ratios exceeding 10, and their inclusion is thus generally expected to substantially increase the overall temperature anisotropy. Given these considerations, one would expect the total ion population to exhibit a higher degree of perpendicular temperature anisotropy than the core population. Contrary to this expectation, however, Figure 3(c) shows the opposite trend. This unexpected result suggests that, in addition to shock compression, other perpendicular heating mechanisms may also contribute to the elevated anisotropy observed in the core population. This possibility will be further discussed later in this paper. It is also important to note that the CGL-predicted anisotropy of ∼1–2 is expected to apply specifically to core ions immediately downstream of quasi-perpendicular shocks. The red histogram of Figure 3(c) includes samples from a wide range of locations throughout the magnetosheath. As plasma travels farther from the shock, the initial temperature anisotropy generated near the shock could be diminished by wave–particle interactions arising from kinetic instabilities. Therefore, the median value of this distribution does not necessarily reflect the local anisotropy immediately downstream of the shock. A more direct comparison between the observed anisotropy and the CGL prediction near the bow shock can be found in Section 4.2.
Panels (e) and (h) show the distributions of perpendicular and parallel thermal pressures, respectively, calculated as P⊥ = nkBT⊥ and P∥ = nkBT∥. In both components, the total ion population exhibits broader and higher-pressure distributions than the core population, consistent with the corresponding temperature trends. Panels (f) and (i) display the distributions of log-transformed perpendicular and parallel plasma beta values, defined as β⊥ = P⊥/(B2/2μ0) and β∥ = P∥/(B2/2μ0), where B is the local magnetic field strength and μ0 is the vacuum permeability. In both directions the total ion population shows higher beta values than the core population, again reflecting the contribution of suprathermal ions to the overall pressure balance in the magnetosheath.
Figure 4 presents the distributions of core-to-total ratios for various ion parameters, with vertical dotted lines marking the median values. Panel (a) shows the number density ratio, which is centered around 0.8, indicating that the core population accounts for approximately 80% of the total ion number density on average. Panel (b) displays the distribution of the bulk speed ratio, which is tightly clustered around unity with a median slightly above 1. Panels (d) and (g) show the distributions of core-to-total temperature ratios in the perpendicular and parallel directions, respectively. Both exhibit broad spreads, implying appreciable variability in the relative thermal properties of the core and total populations across different regions of the magnetosheath. The median perpendicular temperature ratio is 0.42, while the median parallel temperature ratio is even lower at 0.30—both significantly below 0.5. These ratios indicate that although non-core ions constitute only ∼20% of the total number density, they significantly broaden the overall velocity distribution, leading to a substantial elevation in the total ion temperature. Panel (c) shows the distribution of the core-to-total temperature anisotropy ratio, which has a median value of 1.28, indicating that the core population generally exhibits a stronger perpendicular temperature anisotropy than the total population. While the inclusion of suprathermal ions substantially increases the total temperature, it does not result in a temperature anisotropy greater than that of the core population alone. Panels (e) and (h) present the core-to-total ratios of perpendicular and parallel thermal pressures, demonstrating that suprathermal ions make a substantial contribution to both pressure components of the total ion population. Because the magnetic field strength is identical for each core–total pair, the plasma beta ratios shown in panels (f) and (i) directly mirror the pressure ratios.
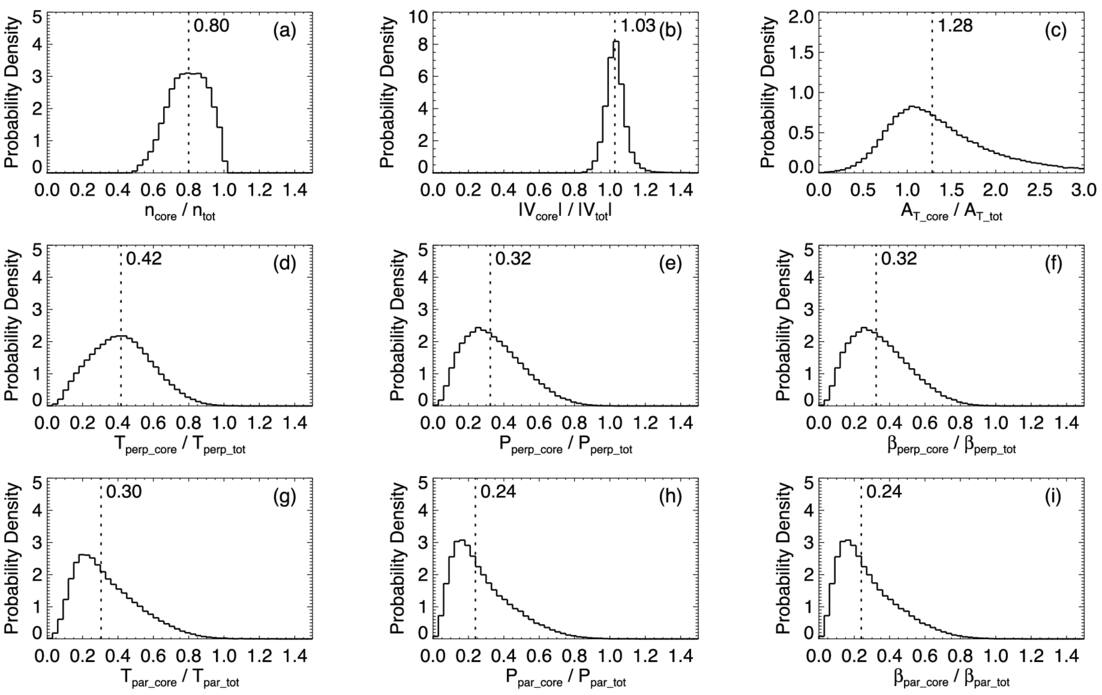
Figure 4. Probability density functions of core-to-total ratios for ion parameters in the Martian magnetosheath. Each panel shows the distribution of the ratio (core/total) for a specific parameter: (a) number density, (b) bulk speed, (c) temperature anisotropy, (d) perpendicular temperature, (e) perpendicular thermal pressure, (f) perpendicular plasma beta, (g) parallel temperature, (h) parallel thermal pressure, and (i) parallel plasma beta. In each panel, the vertical dashed line indicates the median value of the corresponding ratio.
Download figure:
Standard image High-resolution image4.2. Spatially Averaged Maps of Ion Properties
Next, we compare the spatial distributions of ion parameters between the core and total ion populations. Because the characteristics of the bow shock are governed by the orientation of the IMF relative to the local shock normal, ion properties within the downstream magnetosheath can vary depending on the shock geometry. Such dependencies have been observed at both Earth (A. P. Dimmock et al. 2015, 2016) and Mars (J. S. Halekas et al. 2017a). The angle between the IMF and the local shock normal, denoted θBn, is used to distinguish between quasi-parallel (<45°) and quasi-perpendicular (>45°) shocks. To determine the shock geometry associated with each magnetosheath observation, we first calculate the corresponding shock normal vector in cylindrical Mars-solar-orbital (MSO) coordinates. By inputting the observation’s solar zenith angle into the bow-shock conic model of J. G. Trotignon et al. (2006), we can obtain the corresponding shock surface location, where the local normal vector can be derived based on the geometry of the conic surface. We then convert the shock normal vector into Cartesian MSO coordinates by scaling its cylindrical radial (R) component according to the ratio of the Y- and Z-components of the observation’s position in Cartesian MSO space. This yields the Y- and Z-components of the normal vector, while the X-component remains unchanged during this conversion. Finally, we compute θBn using the derived Cartesian shock normal vector and the orbit-averaged upstream IMF vector. Based on the computed θBn, we categorize each magnetosheath observation as either a quasi-parallel or quasi-perpendicular shock geometry.
Many properties of the Martian magnetosheath are influenced by upstream solar wind conditions. For instance, higher upstream ion densities are often associated with enhanced downstream densities behind the bow shock. To account for such variability, most ion parameters are normalized to their corresponding upstream values prior to spatial mapping. These upstream values are derived from intervals classified as pristine solar wind by the region classification algorithm developed by J. S. Halekas et al. (2017b). Based on this method, a data set of orbit-averaged upstream solar wind parameters was constructed. M. L. Marquette et al. (2018) showed that key solar wind parameters at Mars typically remain coherent over timescales of 20–56 hr, depending on the parameter. Moreover, short-term autocorrelation (within one MAVEN orbit, ∼4.5 hr) remains very high (r > 0.8) under nominal upstream conditions. We do not explicitly remove periods associated with interplanetary coronal mass ejections or other solar transients. While such events may introduce additional variability in the upstream solar wind parameters over a single orbit, this represents a potential source of uncertainty in our statistical analysis. However, the long duration of our data set (spanning 9 yr) allows the averaging process to effectively smooth out the influence of these transient events on the final spatial maps. Using orbit-averaged upstream solar wind values, we normalize magnetosheath measurements of ion number density, bulk speed, temperature, and thermal pressure. In contrast, temperature anisotropy and plasma beta are presented in their original form, as they are inherently relative quantities. Magnetosheath measurements are categorized by shock geometry (quasi-parallel or quasi-perpendicular) and binned into two-dimensional spatial grids in cylindrical MSO coordinates, with a resolution of 500 km in both the X- and R-directions, to produce spatially averaged maps. We have also tested the use of the median instead of the mean when computing spatial maps, and found that the results remained largely unchanged, with no impact on the relevant conclusions.
Figures 5, 6, 7, and 8 display spatially averaged maps of ion parameters, categorized by ion population (core and total) and shock geometry (quasi-perpendicular and quasi-parallel). In each map, the two black curves indicate the average locations of the bow shock and the induced magnetospheric boundary, based on the conic models of J. G. Trotignon et al. (2006). It should be noted that some observations fall outside these modeled boundaries but are still part of the magnetosheath, owing to the inclusion of data from all seasons and a wide range of upstream solar wind conditions. The apparent lack of data coverage in the subsolar region is primarily due to the failure to obtain reliable bi-Maxwellian fits for the core ion population. In this region, the shock geometry is typically quasi-perpendicular because of the large Parker spiral angle at Mars, with quasi-parallel conditions being rare. The Mach number of the bow shock is generally higher here than elsewhere, so the incident solar wind flow experiences the greatest deceleration and deflection. This leads to a higher fraction of reflected ions within the total ion population in the magnetosheath downstream of the subsolar bow shock compared to other regions. The enhanced presence of these reflected ions can produce strongly non-Maxwellian velocity distributions, introducing broad suprathermal wings and additional peaks, which are particularly challenging for reliably extracting the core population with a bi-Maxwellian fit. Although quasi-perpendicular shocks dominate, there are rare occasions when the local IMF orientation produces a quasi-parallel shock geometry in the subsolar region. In these uncommon cases, bi-Maxwellian fitting of the downstream core population remains highly problematic, likely due to enhanced turbulence, transient wave activity, and nonstationary plasma flows. These factors can give rise to velocity distributions that are highly broadened, asymmetric, or otherwise non-Maxwellian, even without a large reflected ion population. Consequently, the core population is often not well defined, and the fitting procedure either fails to converge or produces results that do not meet quality-control criteria, resulting in persistent data gaps in this region. We also note that magnetosheath observations downstream of quasi-parallel shocks are largely confined within the modeled bow-shock boundary, whereas those downstream of quasi-perpendicular shocks more frequently extend beyond it. This discrepancy likely reflects the outward extension of the bow shock under quasi-perpendicular conditions, driven by the higher phase speed of fast magnetosonic waves. To resolve the distinct spatial characteristics of the two ion populations, different color scales are used for the core and total populations for most parameters, due to significant differences in their value ranges—particularly for temperature. For each ion population, the same color scale is applied consistently across the two shock geometries.
Panels (a) of Figures 5, 6, 7, and 8 show the normalized number density maps. In all cases, peak densities appear just downstream of the bow shock, consistent with solar wind compression across the shock front. Since the core population constitutes the majority of the total ion population, their large-scale spatial patterns are broadly similar, with densities gradually decreasing with increasing distance from the shock. At Earth, higher ion densities have been observed downstream of quasi-parallel shocks compared to quasi-perpendicular shocks (A. P. Dimmock et al. 2016). In contrast, no such density asymmetry is clearly evident at Mars for either the core or total population. Two differences between the Martian and terrestrial magnetosheaths may contribute to this discrepancy. First, the Martian magnetosheath contains a slightly larger fraction of planetary ions than the terrestrial magnetosheath. Second, its smaller spatial scale enhances kinetic effects, which may exert a more dominant influence on plasma behavior than at Earth. These factors may help explain the lack of a density difference associated with shock geometry at Mars; however, the underlying mechanisms remain uncertain and warrant further investigation in the future. Panels (b) of the figures present the normalized bulk speed maps, where the spatial distributions are again largely comparable between the core and total populations, reflecting the dominant contribution of the core to the overall bulk flow.
Panels (d) and (g) of Figures 5, 6, 7, and 8 show the spatial distributions of normalized perpendicular and parallel temperatures, respectively. For both components, the total ion population exhibits systematically higher temperatures than the core population throughout the magnetosheath, regardless of shock geometry. The perpendicular temperature of the core population increases gradually from the bow shock toward the induced magnetospheric boundary, suggesting ongoing perpendicular heating during downstream convection. This trend may partially result from adiabatic compression in regions of enhanced magnetic field strength associated with the IMF pileup (C. Bertucci et al. 2003; Y. Dong et al. 2019). In contrast, the total ion population shows a more spatially uniform perpendicular temperature distribution, with elevated values concentrated at lower solar zenith angles. This may reflect an enhanced contribution from reflected solar wind ions. For the parallel temperature, both populations exhibit a gradual increase with distance from the bow shock. This enhancement likely results from cumulative velocity-space diffusion driven by wave–particle interactions, which are potentially associated with plasma instabilities such as mirror-mode or ion-cyclotron waves (S. P. Gary et al. 1993, 1994, 1996). In addition to heating mechanisms, the observed increase in both perpendicular and parallel temperatures of the core population with increasing distance from the bow shock may primarily reflect the progressive thermalization of non-core ions. As these initially nonthermal ions are transported from the bow shock toward the induced magnetosphere boundary and gradually merge into the core distribution, they may be partially captured by the bi-Maxwellian fitting process, leading to an apparent rise in the core temperature. These trends are consistently observed under both shock conditions.
Panels (c) of Figures 5, 6, 7, and 8 present the spatial distributions of temperature anisotropy. At quasi-perpendicular shocks, the magnetic field is oriented more closely perpendicular to the shock normal, confining reflected solar wind ions near the shock front. These ions gyrate around the local magnetic field within approximately one ion gyroradius of the shock. Upon crossing into the downstream magnetosheath, they contribute significantly to increasing the perpendicular ion temperature, thereby enhancing the anisotropy of the total ion population near the shock, as shown in Figure 5(c). In contrast, at quasi-parallel shocks, the magnetic field is more closely aligned with the shock normal, allowing reflected ions to escape far upstream along magnetic field lines. These ions populate the foreshock region, where they interact with the incoming solar wind and excite a variety of plasma waves (D. Burgess 1997). Compared to quasi-perpendicular shocks, however, the number of gyrating reflected ions injected into the downstream region at quasi-parallel shocks is significantly reduced, thereby limiting the increase in perpendicular temperature. Consequently, the downstream suprathermal ion population tends to exhibit a more isotropic velocity distribution, possibly resulting in a weaker perpendicular temperature anisotropy in the total ion population behind quasi-parallel shocks compared to quasi-perpendicular shocks, as shown in Figure 6(c).
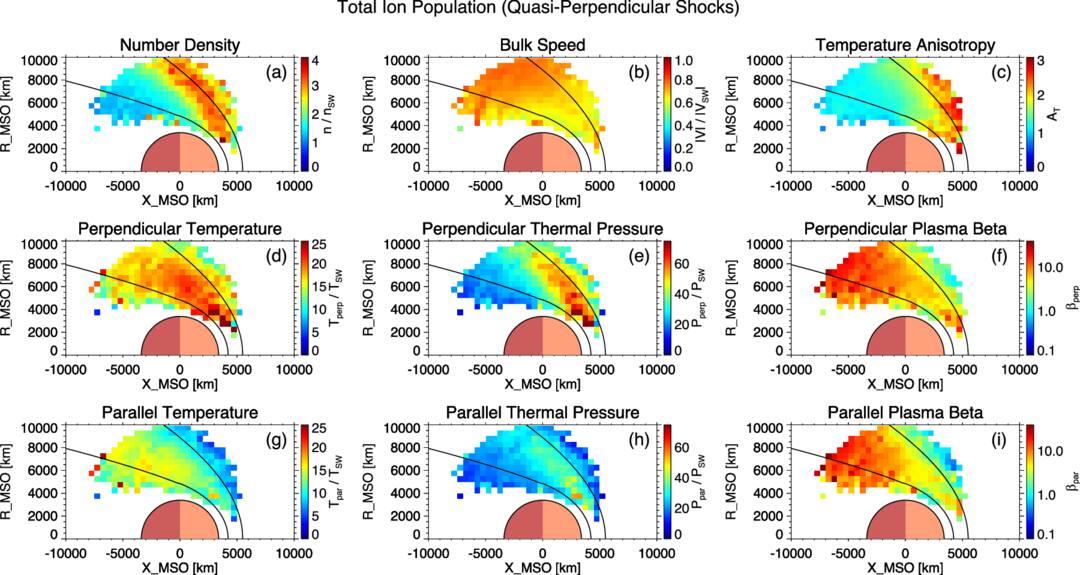
Figure 5. Spatially averaged maps of ion properties for the total ion population in the Martian magnetosheath downstream of quasi-perpendicular shocks shown in cylindrical MSO coordinates. All quantities, except temperature anisotropy and plasma beta, are normalized to their upstream values prior to averaging. Black curves indicate the average locations of the bow shock (outer) and induced magnetosphere boundary (inner) based on J. G. Trotignon et al. (2006).
Download figure:
Standard image High-resolution image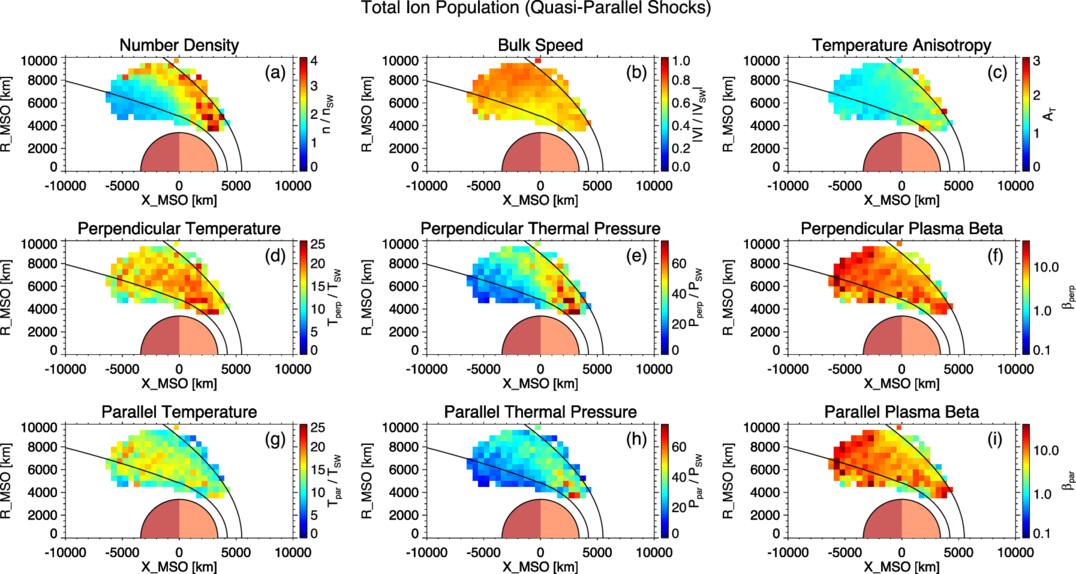
Figure 6. Spatially averaged maps of ion properties for the total ion population in the Martian magnetosheath downstream of quasi-parallel shocks shown in cylindrical MSO coordinates. The format and normalization scheme are identical to those in Figure 5.
Download figure:
Standard image High-resolution imageWhile suprathermal ions can significantly influence the temperature characteristics of the total ion population, the thermal core ion population just downstream of the shock better reflects ion heating driven by shock compression. This heating can be approximately described by the double-adiabatic CGL theory, which predicts T⊥ ∝ B and T∥ ∝ n2/B2. According to this theory, shock compression leads to anisotropic ion heating that depends on shock geometry. At quasi-parallel shocks, the relatively weak amplification of the magnetic field is expected to result in greater parallel heating. In contrast, at quasi-perpendicular shocks, where the magnetic field undergoes strong amplification across the shock ramp, the theory predicts stronger perpendicular heating. Consequently, the temperature anisotropy of the core population is expected to be higher just downstream of quasi-perpendicular shocks than quasi-parallel ones, consistent with our results in panels (c) of Figures 7 and 8. However, even at quasi-parallel shocks, the core population exhibits temperature anisotropies well above unity near the shock. This observation indicates that the perpendicular heating of core ions cannot be fully explained by shock compression alone, implying the involvement of other important heating mechanisms. For both the core and total ion populations, temperature anisotropy gradually decreases from the bow shock toward the induced magnetosphere boundary, likely as a result of wave–particle interactions driven by kinetic instabilities that tend to isotropize the ion velocity distributions (J. Fruchtman et al. 2024).
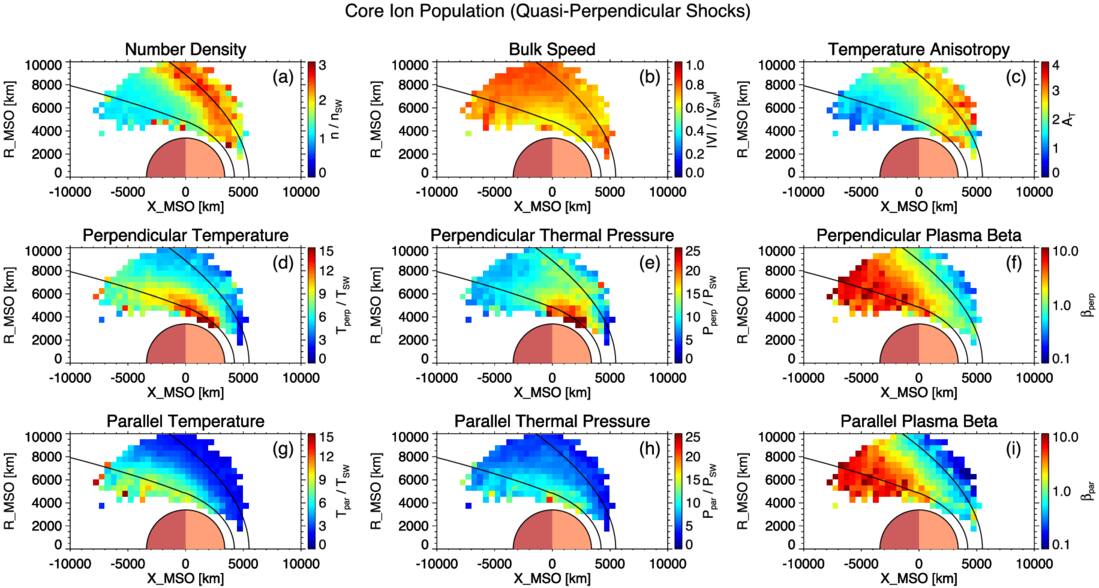
Figure 7. Spatially averaged maps of ion properties for the core ion population in the Martian magnetosheath downstream of quasi-perpendicular shocks shown in cylindrical MSO coordinates. These panels follow the same format as Figure 5 except that the color bar ranges are adjusted to reflect the typical scales of the core population.
Download figure:
Standard image High-resolution image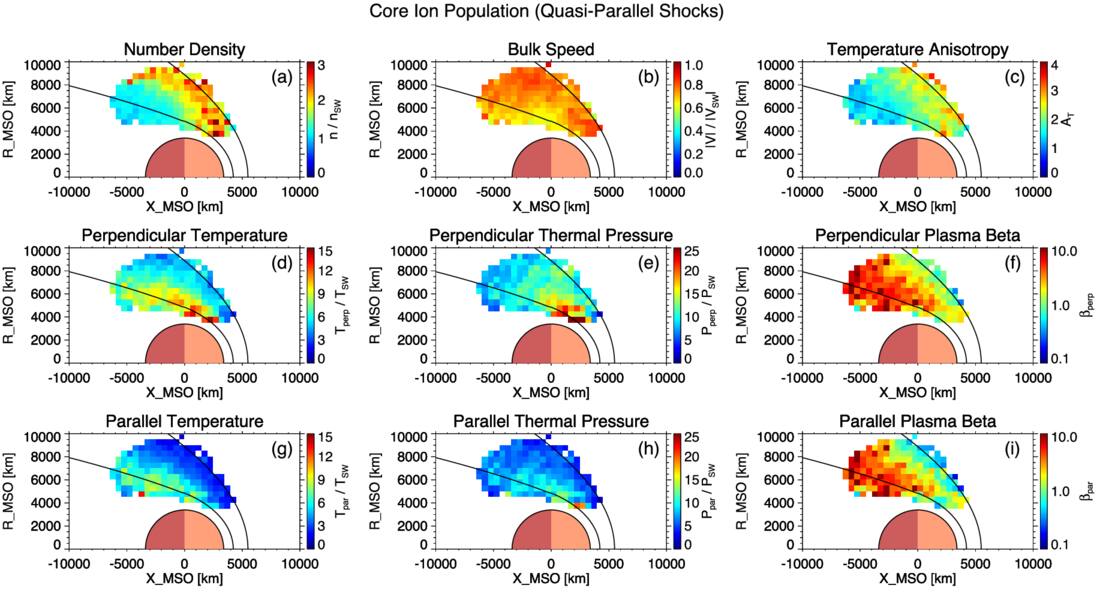
Figure 8. Spatially averaged maps of ion properties for the core ion population in the Martian magnetosheath downstream of quasi-parallel shocks shown in cylindrical MSO coordinates. The format is identical to that of Figure 7.
Download figure:
Standard image High-resolution imagePanels (e) and (h) of Figures 5, 6, 7, and 8 present the spatial distributions of perpendicular and parallel thermal pressures, respectively. For the core ion population, both components peak near the induced magnetospheric boundary, whereas the total ion population exhibits maximum thermal pressures shortly downstream of the bow shock. Panels (f) and (i) show the corresponding distributions of perpendicular and parallel plasma beta. For the total population, both beta values remain relatively low near the bow shock but increase sharply over a short downstream distance before leveling off across the magnetosheath. In contrast, the core population exhibits a more gradual increase with distance from the shock. Notably, for both populations, temperature anisotropy and plasma beta exhibit opposing spatial trends, indicating an anticorrelation between the two parameters. This relationship is consistent with theoretical expectations based on kinetic instability regulation (S. P. Gary et al. 1993, 1994, 1996). As plasma beta increases, the thresholds for proton temperature anisotropy instabilities decrease, rendering the plasma more susceptible to wave–particle scattering. These scattering processes act to reduce anisotropy, driving the system toward marginal stability. This anticorrelation is observed under both shock conditions, in agreement with observations at Earth (S. A. Fuselier et al. 1994).
Figures 9 and 10 present the spatial distributions of the ratios between the core and total ion populations for various ion parameters under quasi-perpendicular and quasi-parallel shock geometries, respectively. The core-to-total ratios of number density, temperature, thermal pressure, and plasma beta all exhibit similar spatial trends: They are relatively low near the bow shock and gradually increase downstream, reaching peak values near the induced magnetosphere boundary. This trend suggests an increasing dominance of the thermal core ion population deeper within the magnetosheath, likely resulting from the progressive thermalization of initially nonthermal ions. Notably, the core-to-total density ratio reaches a maximum of approximately 0.9 in the deepest region of the magnetosheath, implying that a small fraction of the ion population remains nonthermal even far downstream of the shock. This observation supports the idea that the limited spatial extent of the Martian magnetosheath may inhibit the full thermalization of incoming solar wind ions (S. Moses et al. 1988). Panels (b) of the figures show the spatial distribution of the ratio between the core and total ion bulk speeds. This ratio remains close to unity throughout most of the magnetosheath, indicating that the core population dominates the bulk flow and moves at nearly the same average speed as the total ion population. Slightly elevated ratios are observed at lower solar zenith angles near the subsolar region, possibly due to a higher proportion of reflected solar wind ions in this region. These reflected ions typically exhibit broader angular velocity distributions, which could reduce the net bulk speed of the total ion population and lead to a slightly higher core-to-total speed ratio. Panels (c) of the figures display the spatial distributions of the core-to-total temperature anisotropy ratio. Throughout the magnetosheath, this ratio generally exceeds unity under both shock geometries, indicating that the core ion population consistently exhibits a higher degree of perpendicular temperature anisotropy compared to the total population.
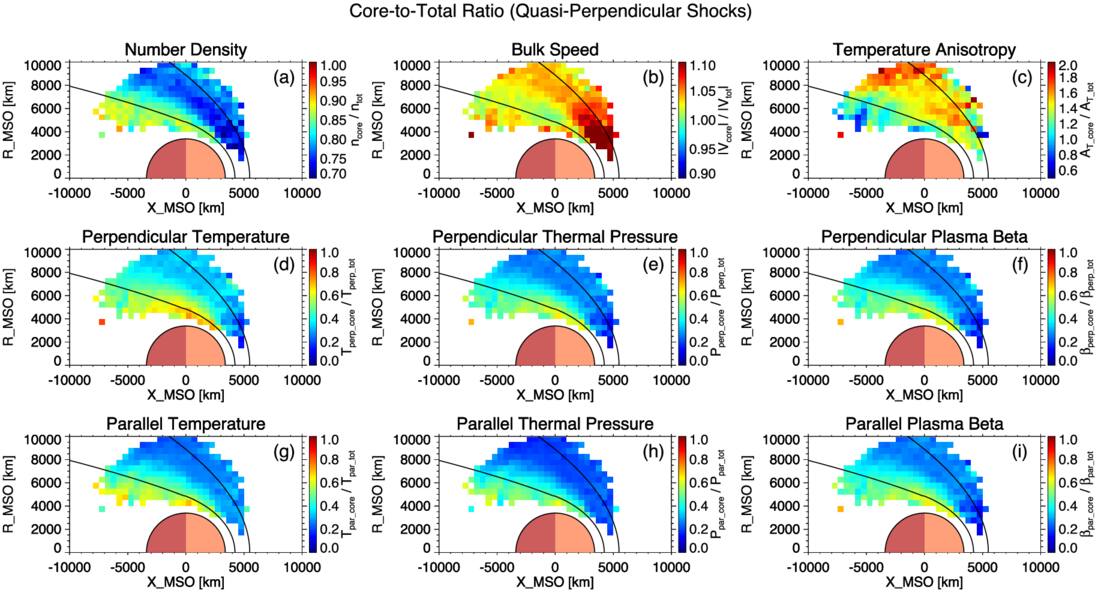
Figure 9. Spatially averaged maps of core-to-total ratios for ion properties in the Martian magnetosheath downstream of quasi-perpendicular shocks shown in cylindrical MSO coordinates. Each panel shows the ratio of the core-population value to the total population value for the ion parameter indicated in its title. Black curves denote the average bow shock (outer) and induced magnetosphere boundary (inner) locations.
Download figure:
Standard image High-resolution image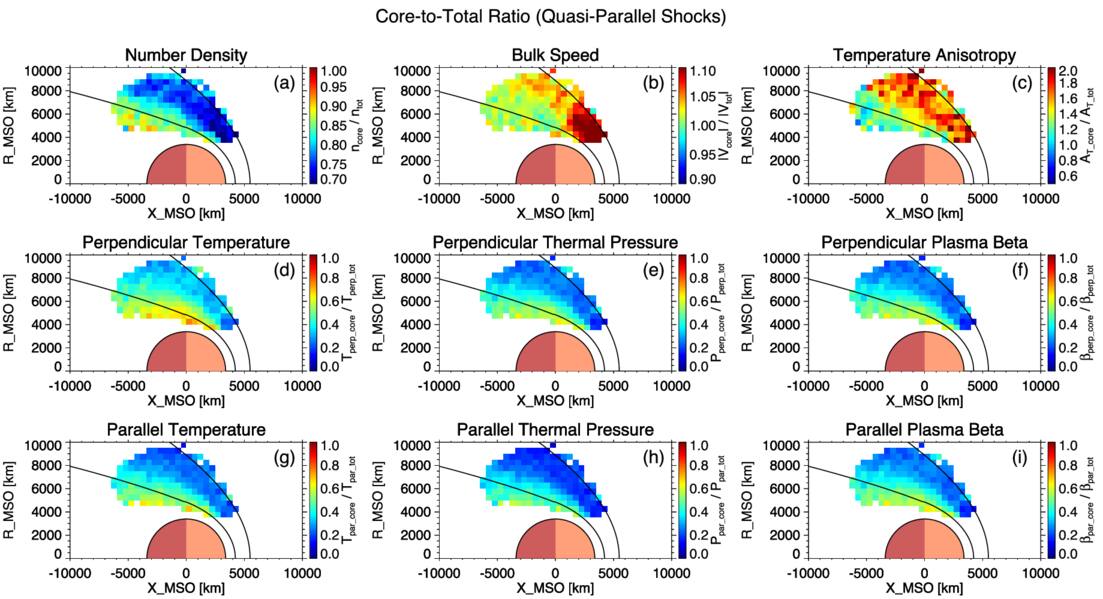
Figure 10. Spatially averaged maps of core-to-total ratios for ion properties in the Martian magnetosheath downstream of quasi-parallel shocks shown in cylindrical MSO coordinates. The format is identical to that of Figure 9.
Download figure:
Standard image High-resolution image5. Discussion
C. C. Chaston et al. (2013) analyzed observations from the Time History of Events and Macroscale Interactions during Substorms mission in Earth’s magnetosheath and across the magnetopause in the low-latitude boundary layer, focusing on ion heating driven by broadband electromagnetic fluctuations. They implemented two-component fits to the measured three-dimensional velocity distributions using a generalized Maxwellian model. This fitting procedure yielded a cooler, denser ion component, which they referred to as “magnetosheath ions”, and a hotter, less dense component associated with magnetospheric or diffuse energetic ions. The former component corresponds to the core ion population examined in the present study of Mars, essentially representing the same population described under a different designation. They reported unexpectedly large temperature anisotropies of 2–3 for this population in the terrestrial magnetosheath, which could not be explained by adiabatic shock compression alone, thereby implying the operation of additional nonadiabatic mechanisms such as wave–particle interactions. To identify the wave mode responsible for the observed perpendicular heating, they conducted a detailed analysis of electromagnetic field fluctuations and identified several signatures consistent with kinetic Alfvén waves (KAWs). Their results further demonstrate a selective heating process, in which stochastic heating by KAWs significantly enhances the perpendicular temperature of the magnetosheath ion component, while exerting minimal impact on the hotter, more tenuous component.
In our analysis of the Martian magnetosheath, we employed bi-Maxwellian fits to determine the perpendicular and parallel temperatures of the core ion population. While the temperature anisotropy of the total ion population is expected to be strongly influenced by reflected solar wind ions, particularly under quasi-perpendicular shock conditions, our statistical results consistently show that the core population exhibits an even higher anisotropy, regardless of shock geometry. This finding suggests that, beyond the effect of shock compression, additional mechanisms such as perpendicular heating by KAWs may also contribute. To explore this possibility, we conduct a test following the methodology outlined by C. C. Chaston et al. (2013). They examined how the normalized perpendicular and parallel temperatures of the core ion population—expressed as the ratios T⊥/B and T∥B2/n2—vary with electromagnetic wave power. Here, B denotes the local magnetic field strength and n represents the number density of the core population. These ratios represent approximate invariants under adiabatic compression, and deviations from them can serve as indicators of nonadiabatic heating processes, such as stochastic energization by KAWs. As a proxy for the wave activity, they used the total magnetic power spectral density (PSDB) at the spacecraft-frame frequency corresponding to k⊥ρi ≈ 1, where k⊥ is the wavevector component perpendicular to the background magnetic field and ρi is the ion gyroradius. This frequency is estimated as fsc = vf/2πρi, assuming that the observed frequency is dominated by Doppler shift due to the convected ion flow and that the KAW wavevector is nearly perpendicular to the background magnetic field. Here, vf denotes the ion bulk flow speed in the spacecraft frame, derived from the measured full ion distribution.
We compute the quantities described above for the core ion population in the Martian magnetosheath. As shown in Figure 11(a), T⊥/B increases systematically with PSDB, following a power-law trend as indicated by the red fit line, suggesting enhanced perpendicular heating under elevated wave activity. In contrast, T∥B2/n2, shown in Figure 11(b), exhibits a weak decreasing trend with PSDB, indicating a lack of evidence for parallel heating. Figure 11(c) shows that T∥/B increases with PSDB, exhibiting a power-law trend similar to that observed for T⊥/B, albeit with a smaller slope. However, this increasing trend is interpreted not as evidence of direct parallel heating, but rather as a consequence of perpendicular heating followed by partial isotropization of the ion distribution. Overall, the trends observed in Figure 11 are consistent with those reported by C. C. Chaston et al. (2013), further supporting the applicability of their interpretation to the Martian magnetosheath. To assess whether these trends represent genuine physical responses rather than artifacts arising from variations in upstream solar wind conditions, we construct a set of two-dimensional median maps, shown in Figure 12. In each panel, the x-axis represents the logarithm of PSDB, the y-axis corresponds to a specific upstream solar wind parameter, and the color scale indicates the median value of a selected quantity in each bin. The left, middle, and right columns correspond to T⊥/B, T∥B2/n2, and T∥/B, respectively. Collectively, the two-dimensional maps in Figure 12 reinforce the trends identified in Figure 11.
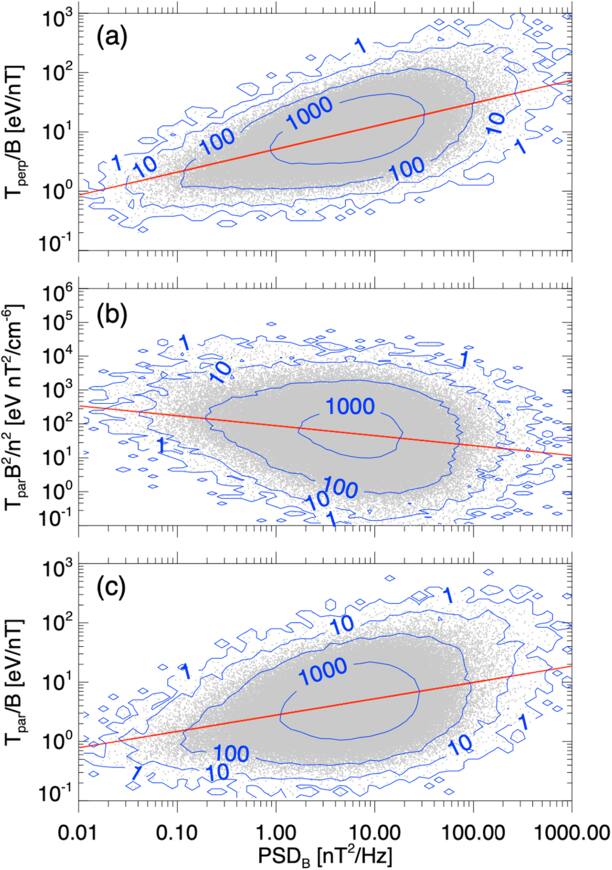
Figure 11. Scatter plots of the core population’s adiabatic invariants as functions of the total magnetic power spectral density at the spacecraft-frame frequency corresponding to k⊥ρi ≈ 1. Panels (a) and (b) show the perpendicular and parallel invariants, respectively, while panel (c) displays the perpendicular invariant computed using the parallel temperature in place of the perpendicular temperature. Each gray dot represents a single observation. Red lines indicate power-law fits. Blue contours indicate the number of data points per bin in log–log space (bin size: 0.1 × 0.1 in log space).
Download figure:
Standard image High-resolution image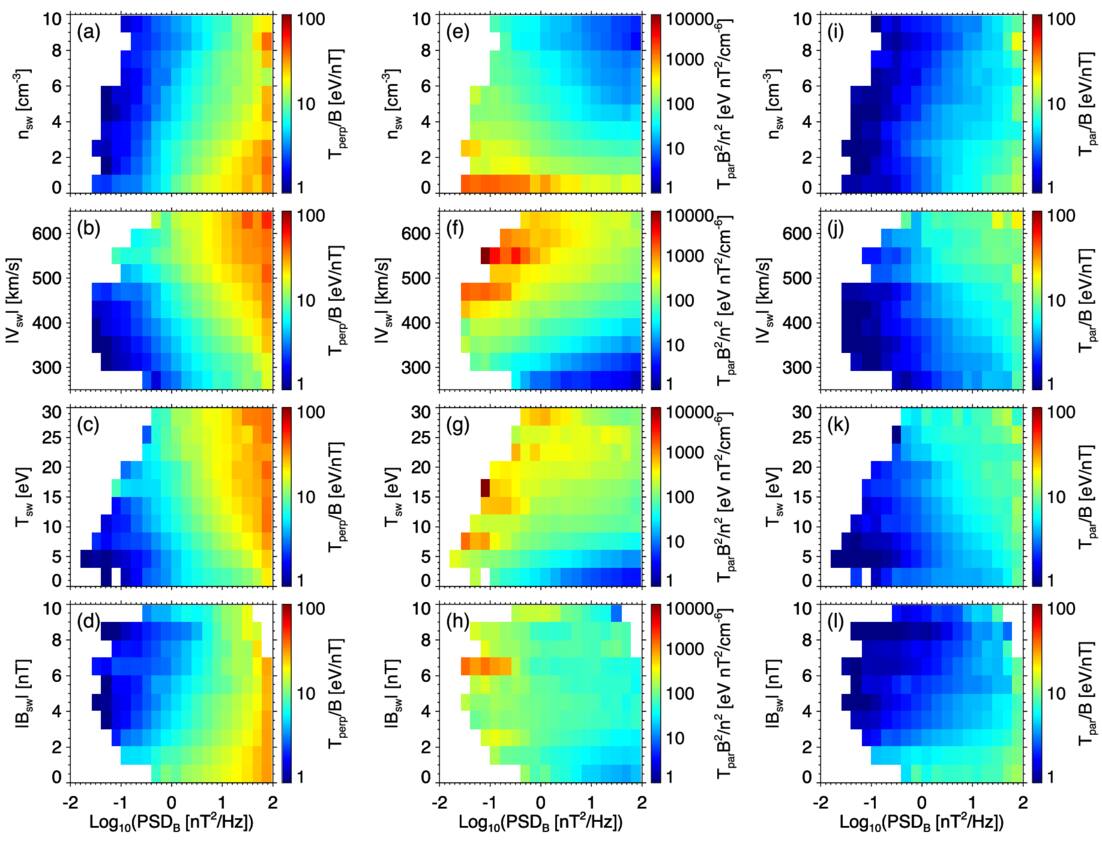
Figure 12. Two-dimensional median maps showing the dependence of core-population temperature invariants on magnetic power spectral density (as defined in Figure 11) and upstream solar wind conditions. Panels in each row correspond to the invariants shown in Figures 11(a)–(c), from left to right. Panels in each column correspond to upstream drivers: from top to bottom, solar wind density, bulk speed, temperature, and IMF strength. In each panel, color represents the median value of the corresponding invariant within each bin.
Download figure:
Standard image High-resolution imageC. C. Chaston et al. (2013) discussed several pathways for the generation of KAWs in the magnetosheath, suggesting that nonlinear processes likely dominate. Although a linear mechanism—the refractive evolution of ion-cyclotron waves into KAWs via phase mixing—has been proposed, they argued that it probably cannot account for the observed broadband, turbulent KAW structures. Instead, they emphasized the role of nonlinear instabilities driven by ion temperature anisotropies. Large-scale fluctuations produced by mirror-mode or ion-cyclotron instabilities may undergo secondary processes that transfer energy into the KAW regime. For instance, O. Alexandrova et al. (2004) proposed that ion-cyclotron wavefields may become unstable to filamentation, leading to the formation of convecting field-aligned current tubes with transverse scales comparable to the ion inertial length. These structures are expected to exhibit kinetic-scale properties consistent with KAWs. Similarly, K. Stasiewicz et al. (2001) suggested that drift instabilities acting on mirror-mode-like magnetic bubbles could generate a broad spectrum of KAWs. These structures may subsequently interact through nonlinear wave–wave coupling, forming a turbulent cascade that transfers free energy toward ion-kinetic scales, as described by S. D. Bale et al. (2005). At these scales, stochastic wave–particle interactions become effective, possibly leading to strong perpendicular ion heating. Additionally, C. C. Chaston et al. (2013) noted that upstream solar wind fluctuations and their interactions with the bow shock may also contribute to the generation of KAWs.
6. Summary and Conclusions
In this study, we present a statistical analysis of ion properties in the Martian magnetosheath based on over 190,000 observations collected by the MAVEN spacecraft between 2015 and 2023. By isolating the thermal core ion population—extracted via bi-Maxwellian fits—from the total ion population measured by SWIA, we quantitatively compare key ion parameters between the core and total populations. Our results indicate that the core population accounts for approximately 80% of the total ion number density and closely follows the bulk flow speed of the full distribution. In contrast, the total population exhibits substantially higher temperatures, thermal pressures, and plasma beta values, highlighting the significant contribution of suprathermal ions.
The temperature anisotropy of both the core and total ion populations is found to be strongly modulated by shock geometry, with greater values observed under quasi-perpendicular shocks than under quasi-parallel shocks. Interestingly, the core ion population exhibits a consistently higher perpendicular temperature anisotropy than the total population—contrary to expectations that suprathermal ions would dominate anisotropic heating. This finding suggests that additional mechanisms beyond shock compression contribute to the perpendicular heating of core ions. By examining correlations between temperature invariants and the magnetic power spectral density, we identify statistical signatures consistent with stochastic heating by KAWs, in agreement with previous observations in Earth’s magnetosheath. These findings suggest that KAWs may play a similar role in the magnetosheaths of both planets, potentially contributing to perpendicular heating and elevated temperature anisotropy in the core ion population. Spatially averaged maps show that temperature anisotropy peaks near the bow shock and gradually decreases toward the induced magnetosphere boundary, consistent with wave–particle scattering driving the plasma toward marginal stability. Meanwhile, core-to-total ratios of density, temperature, and thermal pressure increase progressively across the magnetosheath, reflecting the gradual thermalization of initially nonthermal ions. The core-to-total density ratio reaches a maximum of approximately 0.9 in the deepest regions of the magnetosheath, indicating that the ion population remains only partially thermalized even far downstream of the shock. Overall, these comparisons provide a quantitative framework for assessing the role of thermal ions in governing ion properties and advancing our understanding of thermodynamic and heating processes within the Martian magnetosheath.
Acknowledgments
We acknowledge NASA and the MAVEN mission for support through grant No. NNH10CC04C to the University of Colorado and by subcontract to Space Sciences Laboratory, University of California, Berkeley. The research described in this paper utilizes publicly available data from the MAVEN mission, including data from the SWIA (J. S. Halekas 2024) and MAG (J. E. P. Connerney 2024) instruments. All data were obtained and processed through the publicly available Space Physics Environment Data Analysis Software (SPEDAS; V. Angelopoulos et al. 2019).
Author Contributions
H.-W.S.: conceptualization, formal analysis, investigation, methodology, software, visualization, writing – original draft, and writing – review and editing. J.S.H.: conceptualization, data curation, funding acquisition, investigation, methodology, project administration, supervision, resources, validation, and writing – review and editing. S.M.C.: funding acquisition and writing – review and editing. C.Z.: Writing – review and editing. Y.W.: writing – review and editing. J.R.E.: data curation and writing – review and editing.