Abstract
Although shock waves have been well documented in fundamental-mode RRab stars, their existence in first-overtone pulsator stars, RRc stars, has remained uncertain. Building upon the spectroscopic frameworks established by M. Chadid et al., we present the first direct detection of multistructured shock phenomena in RRc stars. Using high-resolution phase-resolved spectroscopy, we identify unambiguous shock signatures, including Hα emission, line-doubling, and large-scale variations in radial velocity and line broadening.Our analysis reveals a structured sequence of distinct shock fronts: the main outward shock, ShHe+H, the ballistic shock, ShBall, and a gravitational collapse shock, ShGravity. These phenomena produce measurable dynamical and spectroscopic effects at both photospheric and higher atmospheric layers. We find that RRc stars sustain hypersonic shock regimes despite the absence of He I or He II emission typically used in RRab classification schemes. This discrepancy is attributed to the compact and low-opacity nature of RRc atmospheres, which promotes rapid shock dissipation. These discoveries challenge conventional models of RRc atmospheres and update the classification scheme. We propose an extension to existing classification frameworks to accommodate the unique shock dynamics of RRc stars. These results challenge the long-standing assumption that first-overtone RR Lyrae pulsators lack strong shocks and demonstrate that RRc stars exhibit complex, multiphase atmospheric dynamics. Altogether, our findings reshape the current understanding of RRc atmospheric dynamics.
Original content from this work may be used under the terms of the Creative Commons Attribution 4.0 licence. Any further distribution of this work must maintain attribution to the author(s) and the title of the work, journal citation and DOI.
1. Introduction
RR Lyrae stars are low-mass, helium-burning horizontal branch stars that serve as key distance indicators and tracers of old stellar populations. These stars pulsate due to the κ and γ mechanisms, leading to periodic expansions and contractions of their outer layers (S. A. Zhevakin 1953; J. P. Cox & C. Whitney 1958). RR Lyrae stars are typically classified into three main subtypes (S. I. Bailey 1902): RRab stars, which pulsate in the fundamental radial mode and exhibit asymmetric light curves; RRc stars, which pulsate in the first overtone and display more sinusoidal variations; and RRd stars, double-mode RR Lyrae variables (J. M. Nemec & P. Moskalik 2021) that simultaneously pulsate in the fundamental and first-overtone radial modes.
While RRab stars have been extensively studied, particularly for their strong shock-related spectroscopic signatures, such as hydrogen and helium line emissions, line doubling, and discontinuities in radial velocity curves (O. Struve 1947; R. Iroshnikov 1962; G. W. Preston & B. Paczynski 1964; M. Chadid et al. 2008, 2014; G. W. Preston 2009; M. Chadid 2023), RRc stars have been largely regarded as dynamically simpler. Their smaller amplitudes, higher effective temperatures, and more regular light curves have led to the longstanding assumption that strong atmospheric shocks are absent in RRc stars (H. A. Smith 2004).
However, emerging evidence, including asymmetric radial velocity curves and line profile variations, suggests that RRc stars may possess more complex atmospheric dynamics than previously thought. The recent detection of gravity modes in RR Lyrae stars (M. Chadid 2022) further supports the idea of more intricate internal and atmospheric structures.
In this work, we present the first direct spectroscopic detection of shock phenomena in RRc stars. Through high-resolution, time-series spectroscopy, we identify clear signatures of shock activity in four well-observed RRc targets.
We describe the observation, data, and methodology used in our analysis in Section 2. Sections 4 and 5 present the results of radial velocity measurements and spectral line variations, highlighting key shock-related features. Section 6 discusses the implications of these discoveries for shock dynamics, classification schemes, and the broader framework of RR Lyrae pulsation physics.
2. Observations and Data Reductions
The survey of the first-overtone RRc stars in this paper is conducted during the observing program HARPS 79.D-0462 with the High-Accuracy Radial Velocity Planetary Searcher Spectrograph (HARPS) at the La Silla Observatory, and the du Pont echelle spectrograph observing run at Las Campanas Observatory.
We carried out, on 2007 July 21, 24 observations over a complete pulsation cycle on the RRc star MT Tel using the high-resolution echelle spectrograph HARPS (R = 115,000)—fiber fed and cross-dispersed—at the ESO 3.6 m telescope at La Silla Observatory, covering the wavelength range from 380 to 690 nm with an exposure time of around 8 minutes, giving an average time resolution of 1.50% and a signal-to-noise ratio better than 50 pixel−1 at 550 nm.
We also analyze RRc stars observed with the echelle spectrograph at the Las Campanas du Pont telescope (C. Sneden et al. 2017). A total of 250 echelle observations were obtained during six nights in 2014 March, completing phase coverage of the pulsation cycles was achieved for three RRc stars, Y Crv, AU Vir, and YZ Cap. For a detailed description of the echelle spectrograph data reduction procedures and scattered-light correction, we refer the reader to B.-Q. For et al. (2011a, 2011b) and M. Chadid et al. (2017).
The data reduction of HARPS CCD images from the La Silla Observatory was carried out by use of the IRAF script. The HARPS spectra were cross-correlated with a stellar template (A. Baranne et al. 1996). Almost all lines used are metallic, and consequently, the reduced radial velocities refer to the average photospheric motion. The HARPS correlation radial velocity curves are obtained with the standard HARPS reduction pipeline, and are measured with uncertainties better than 100 m s−1 which mainly includes the convolution between the spectrum curve and appropriate spatial filter function obtained from optimization among quality factor and other parameters, 2420 absorption lines from 380 to 690 nm are taken into account, the radial velocities to the average photospheric motion are deduced from multiple metallic lines. Wavelength calibration was provided by thorium–argon lamp exposures obtained at each telescope position.
Radial velocity measurements were derived by the cross-correlation method, using single metallic and hydrogen lines with the IRAF fxcor.
Table 1 shows the basic data on these stars, HJD0, period P, V magnitude minimum  , and range of V magnitude minimum Vamp are from All Sky Automated Survey (ASAS; G. Pojmanski 2002).
Table 1. Data of RRc Stars
| ASAS Namea | Other Name | [Fe/H] | HJD0b | P |

| Vamp |
|---|---|---|---|---|---|---|
| (ASAS) | (ASAS) | (ASAS) | (ASAS) | |||
| 123811-1500.0 | Y Crv | −1.39 | 1885.8600 | 0.329045 | 11.42 | 0.49 |
| 132448-0658.8 | AU Vir | −2.04 | 1901.4000 | 0.343237 | 11.43 | 0.50 |
| 190212-4639.2 | MT Tel | −2.58 | 1955.4200 | 0.316900 | 8.75 | 0.56 |
| 211933-1507.0 | YZ Cap | −1.50 | 1874.3830 | 0.273460 | 11.11 | 0.49 |
Notes. aIn the text, these names will be shortened to the first set of digits, e.g., AS123811-1500.0 will be referred to as AS123811. b+2,450,000 days.
Download table as: ASCIITypeset image
3. Magnitude
Figure 1 shows light curves of the RRc stars in this study observed in the V band, representing the variation in V magnitude over a complete period cycle. The light curve for AS123811, Y Crv, demonstrates a periodicity with a distinct peak during a complete pulsation cycle, around phase 0.9. The magnitude varies between approximately 11.3 and 12.1, showing a significant amplitude in brightness variation. AS132448, AU Vir, exhibits a peaked light curve over a complete pulsation cycle, with its V magnitude ranging from about 11.3–12.0. The data points show a more dispersed pattern, indicating possible irregularities or additional variations in the AU Vir and Y Crv pulsation. The light curve for AS190212, MT Tel, is characterized by a smoother peak. The V magnitude ranges from around 8.6–9.4, showing a periodic variation. Finally, AS211933, YZ Cap, shows a light curve similar to the first two RRc stars. The V magnitude ranges from approximately 10.9–11.7, suggesting a significant variation in brightness over the pulsation cycle. The scatter observed in some light curves (notably AS132448 and AS123811) may reflect additional photometric variability, possibly related to the Blazhko effect (S. Blažko 1907), which typically occurs over multiple pulsation cycles. However, our spectroscopic measurements are limited to single, well-resolved pulsation cycles, minimizing any impact from long-term modulation. Thus, the photometric scatter does not affect our shock diagnostics or the conclusions drawn from phase-resolved spectroscopy.
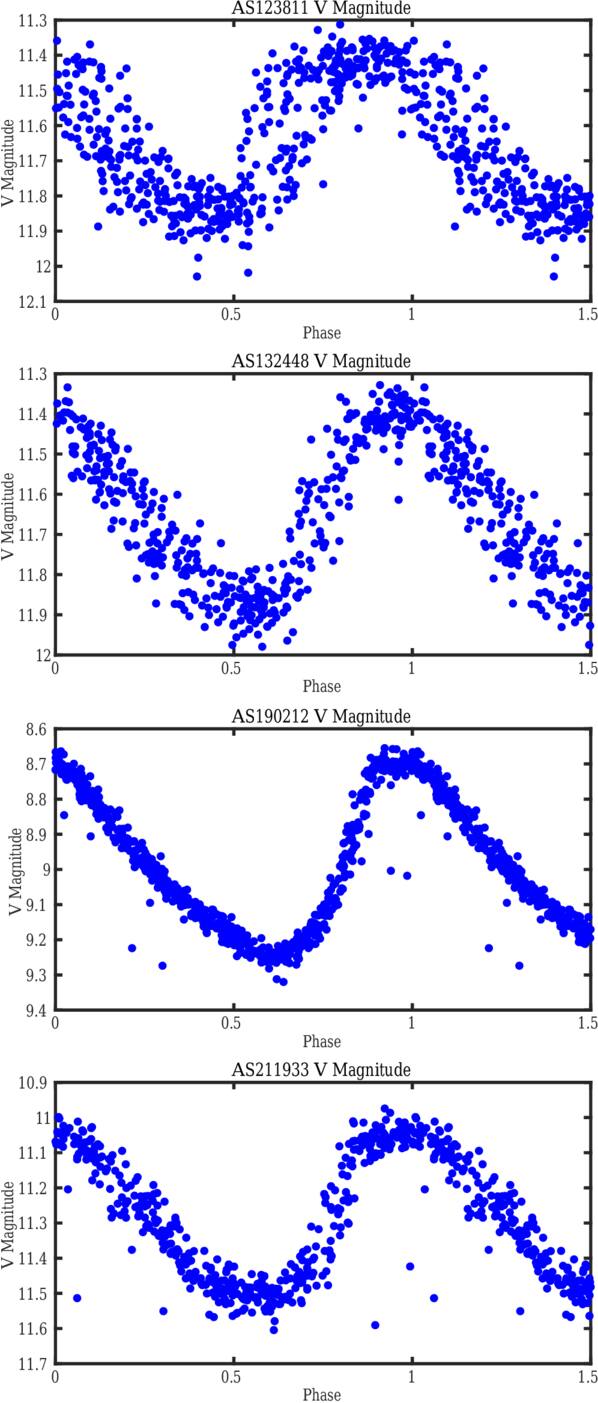
Figure 1. The V magnitude curves of four RRc stars. The light curves are taken from the ASAS V-band photometric database (G. Pojmanski 2002). These data were not obtained simultaneously with our spectroscopic observations; they are used solely to illustrate global phase behavior and verify the periodicity.
Download figure:
Standard image High-resolution image4. Average Photospheric Motion
4.1. Cross-correlation Lines
The cross-correlation radial velocity of four RRc stars is measured by the cross-correlation method (M. Chadid et al. 2017). Figure 2 shows the cross-correlation radial velocity for AS123811, Y Crv, AS132448, AU Vir, AS211933, YZ Cap, and AS190212, MT Tel, respectively. The radial velocity of the correlation profile shows an asymmetric curve with a descending branch lasting shorter than the ascent one, and representing ∼30% of the pulsation period of the star, with a subtle elbow appearing just before the peak of the light curve, around pulsation phase ϕ = 0.5.
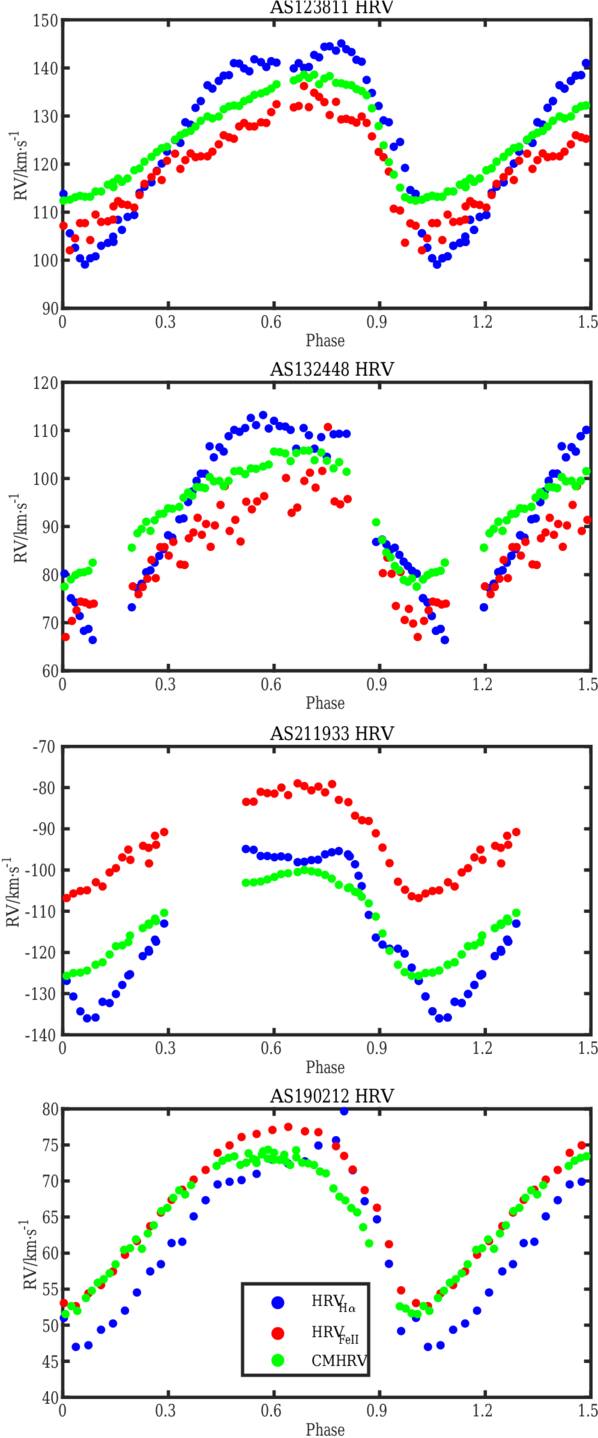
Figure 2. The cross-correlation metallic heliocentric radial velocity (CMHRV), heliocentric radial velocity (HRV) for hydrogen lines Hαλλ6563 Å and metallic lines Fe II λλ4923.921 Å of four RRc stars.
Download figure:
Standard image High-resolution image4.2. Metallic Lines
4.2.1. Metallic Radial Velocity
We measured the heliocentric radial velocity (HRV) for the metallic ionized line Fe II λλ4923.921 Å. The Fe II HRV curves for AS123811, Y Crv, AS132448, AU Vir, AS211933, YZ Cap, and AS190212, MT Tel, respectively, are shown in Figure 2. From the HRV Vr(t), we calculate the pulsation velocity in the stellar rest frame  using the formula

where p is the correction factor for geometrical projection and limb darkening and V* is the center-of-mass velocity. Since the metallic absorption line Fe II λλ4923.921 Å is formed near the photosphere,  is close to the photospheric motion, and V* is assumed to be equal to the so-called γ-velocity, in which we use the average of the HRV curve over one whole pulsation period. Here, a value of 1.36 is adopted for p as discussed by G. Burki et al. (1982).
4.2.2. Acceleration and Radius Variation
The acceleration  of the stellar surface is given from the derivative of
  , while the radius variation is given from the integration of
  :
:

where n is an integer, R0 is the mean stellar radius, which we estimate using the method from M. Marconi et al. (2005). The empirical radius used for RRc stars is given by Equation (3):
where the range of the metal content (heavy-element abundance) Z for RR Lyrae stars is from 10−4 to 10−2, corresponding to a [Fe/H] from −2.5 to −0.0 (H. A. Smith 2004), and we assume that  is linear to [Fe/H] by the reference and data from J. Fernley (1993) and M. D. Criscienzo et al. (2004). Thu, we use linear interpolation to get the relation between them:

Figure 3 shows the pulsation velocity, acceleration, and radius variation (ΔR/R) for AS123811, AS132448, AS190212, and AS211933, respectively.
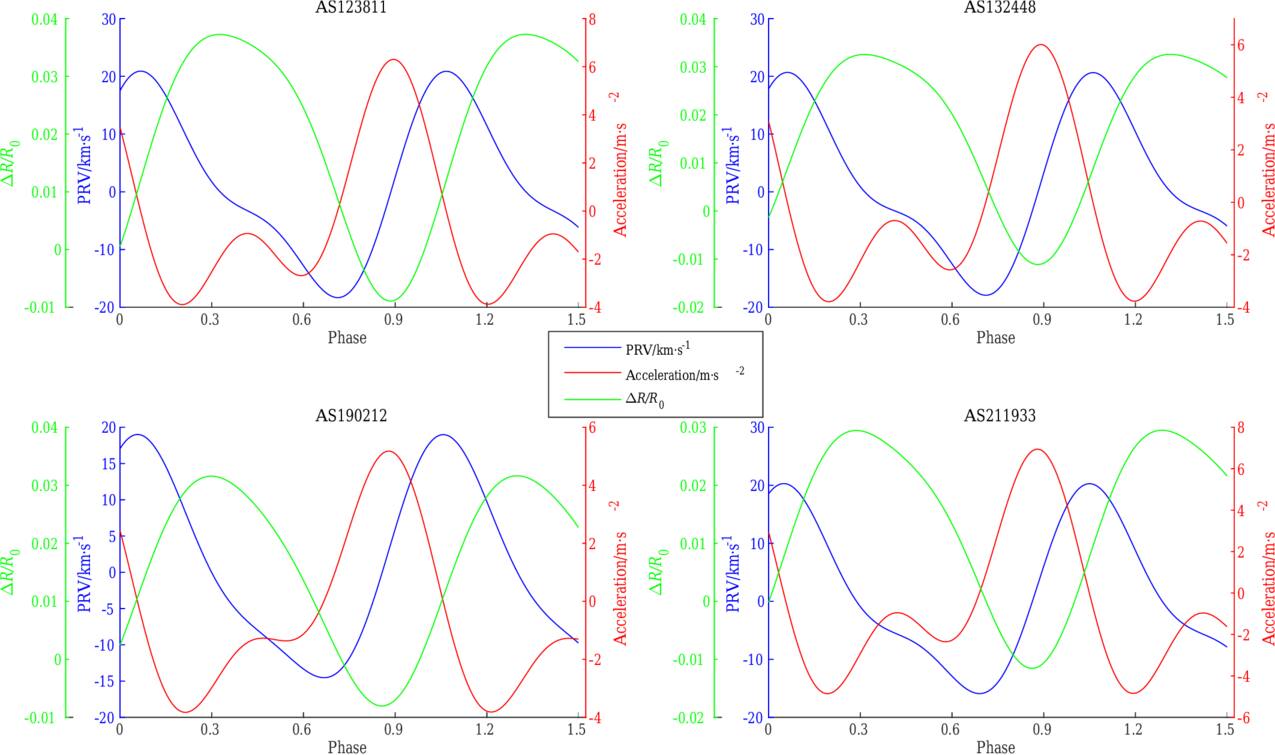
Figure 3. The PRV, acceleration, and ΔR/R for metallic lines Fe II λλ4923.921 Å of four RRc stars, with an uncertainty of ±0.14 km s−1 in pulsation velocity, ±0.11 m s−2 in acceleration, and ±177 km in radius variation.
Download figure:
Standard image High-resolution imageThe most striking feature is that the acceleration curves show a primary acceleration which occurs during the peak in the light curve around phase 0.894, 0.891, 0.879, and 0.879 for AS123811, AS132448, AS190212, and AS211933, respectively, when the radius is minimum, and a secondary acceleration, during the subtle elbow in the radial velocity curve, around phase 0.416, 0.412, 0.466 and 0.421, respectively. The amplitude of the pulsation at the photospheric level is about 17.70%, 16.61%, 15.92%, and 12.58% R⊙ for AS123811, AS132448, AS190212, and AS211933, respectively. Y Crv has the largest pulsation amplitude and, consequently, the most extended stellar photosphere. There is substantial star-to-star variation in acceleration maxima, with AS211933 reaching 7.0 m s−2 while AS190212 exhibits little variation in its acceleration throughout its pulsational phases, while the secondary acceleration is negative and negligible for the four RRc stars. This explains the deceleration of the photosphere during the subtle radial velocity elbow.
Table 2 gives the average of the HRV curve over one pulsation period for the metallic absorption line Fe II λλ4923.921 Å primary acceleration, radius variation, and mean radius.
Table 2. Main Dynamic Parameters of Four RRc Stars for Metallic Absorption Lines Fe II λλ4923.921 Å
| Star Name | γ-Velocity | Primary Acceleration | Second Acceleration | ΔR/R⊙ | R0 |
|---|---|---|---|---|---|
| (km s−1) | (m s−2) | (m s−2) | (R⊙) | ||
| AS123811 | 121.14 | 6.3024 | −0.9339 | 0.1770 | 4.748 |
| AS132448 | 86.06 | 6.0118 | −0.6957 | 0.1661 | 5.100 |
| AS190212 | 67.54 | 5.1788 | −1.2715 | 0.1592 | 5.039 |
| AS211933 | −90.47 | 6.9428 | −0.9519 | 0.1258 | 4.265 |
Download table as: ASCIITypeset image
5. High Atmospheric Dynamics
5.1. Hydrogen Radial Velocity
Figure 2 shows the hydrogen, Hαλλ6563 Å , radial velocity curve for AS123811, AS132448, AS190212, and AS211933, respectively. The hydrogen radial velocity curve shows an asymmetric curve with a descent branch lasting shorter than the ascent one, and representing ∼20% of the pulsation period of the star, with an elbow appearing just before the peak of the light curve. All RRc stars of this study possess prominent Hα radial velocity maxima and stationary values near phase ϕ = 0.50. This phenomenon, while observed in the metallic lines as negligible, is significantly more pronounced in the Hα cores, originating from the upper atmospheric layers.
5.2. Acceleration and Radius Variation
From the HRV Vr(t), we calculate the pulsation velocity in the stellar rest frame  . The acceleration
  of the stellar surface is given from the derivative of
  , while the radius variation is given from the integration of
  following the formula described in Section 4.2.2. Figure 4 shows the acceleration, radius variation, and pulsation velocity for AS123811, AS132448, AS190212, and AS211933, respectively. The most striking feature is that the acceleration curves show a primary acceleration which occurs during the peak in the light curve around phase 0.950, 0.910, 0.901, and 0.918 for AS123811, AS132448, AS190212, and AS211933, respectively, when the radius is minimum, and a secondary acceleration, during the elbow in the radial velocity curve, around phase 0.597, 0.640, 0.545, and 0.568, respectively. The average of the HRV curve over one pulsation period for primary acceleration, radius variation, and mean radius of four RRc stars is given in Table 3. The amplitude of the pulsation at the high atmospheric level is large for the four RRc stars and reaches a value around 33.10%, 34.88%, 19.80%, and 23.54% R⊙, respectively. AU Vir has the largest pulsation amplitude and, consequently, the most extended stellar high atmosphere. There is substantial star-to-star variation in primary acceleration maxima, with AS123811 reaching ∼12 m s−2 while AS132448 exhibits a small variation in its acceleration throughout its pulsational phases. The secondary acceleration is significant for the high atmosphere of four RRc stars. The AU Vir star has the largest secondary acceleration, reaching a value of 1.07 m s−2, indicating a more pronounced dynamic effect on the high atmosphere compared to the subtle secondary accelerations observed in the photosphere of four RRc stars. The radius variation curves ΔR(t) also reveal a distinct asymmetry around the mean radius. The expansion phase is steeper and shorter in duration than the contraction, which is more gradual. This asymmetry is consistent with nonlinear pulsation dynamics; the rapid expansion corresponds to the passage of a primary shock, while the slower contraction reflects radiative damping and delayed atmospheric response. Such asymmetry is a well-known signature of shock propagation in pulsating stars and further supports the shock interpretation of our observations.
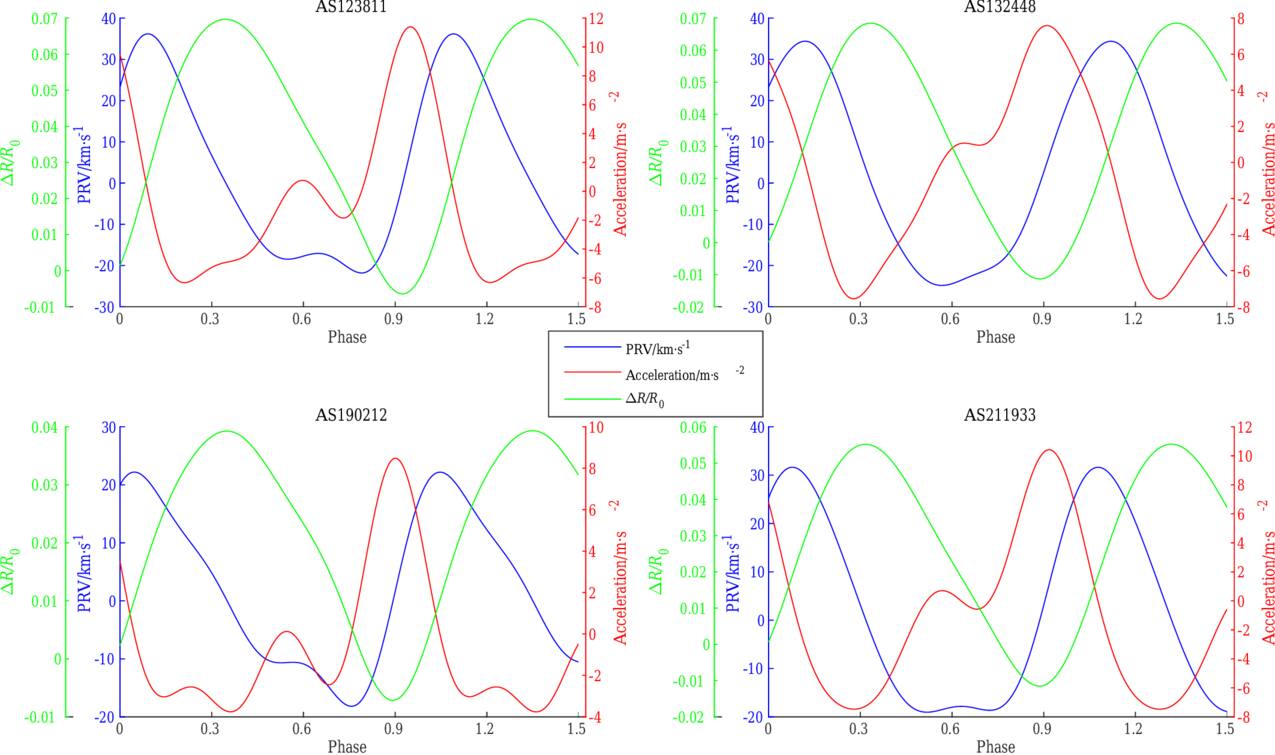
Figure 4. The PRV, acceleration, and ΔR/R0 for hydrogen lines Hαλλ6563 Å of four RRc stars, with an uncertainty of ±0.14 km s−1 in pulsation velocity, ±0.11 m s−2 in acceleration, and ±177 km in radius variation.
Download figure:
Standard image High-resolution imageTable 3. Main Dynamic Parameters of Four RRc Stars for Hydrogen Absorption Lines Hαλλ6563 Å
| Star Name | Mean Radial Velocity | Primary Acceleration | Second Acceleration | ΔR/R⊙ | R0 |
|---|---|---|---|---|---|
| (km s−1) | (m s−2) | (m s−2) | (R⊙) | ||
| AS123811 | 127.83 | 11.3944 | 0.7582 | 0.3309 | 4.748 |
| AS132448 | 93.31 | 7.5868 | 1.0695 | 0.3488 | 5.100 |
| AS190212 | 63.24 | 8.4819 | 0.1223 | 0.1980 | 5.039 |
| AS211933 | −110.03 | 10.4178 | 0.7027 | 0.2354 | 4.265 |
Download table as: ASCIITypeset image
5.3. Hydrogen Emission, Line Broadening, and Doubling Phenomena
5.3.1. Hydrogen Line Broadening Phenomena
Figures 5, 6, 7, and 9 show the evolution of Hαλλ6563 Å over the pulsation period in Y Crv, AU Vir, MT Tel, and YZ Cap, respectively. The Hαλλ6563 Å profile shows a significant broadening phenomenon during the pulsation period. Figures 8, 10, 11, and 12 demonstrate such a broadening phenomenon. The FWHM and the equivalent width (EQW) are derived from a single Gaussian fit. The FWHM curve is strongly variable during the pulsation period. Such variation is produced by the expansion itself ( C. De Jager & G. De Jonge 1978), axial rotation vsini (G. Kovacs & J. R. Buchler 1990), turbulence (G. Burki et al. 1982), and the velocity gradients (M. Chadid & D. Gillet 1996a). The FWHM curve shows a significant peak centered at ϕ = 0.90, hereafter the primary peak, occurring at the primary acceleration. A second peak occurs at ϕ = 0.55, hereafter the secondary peak, lower than the primary peak, occurring during the secondary acceleration. The EQW curve shows a very strong increase as well at the pulsation amplitude maximum, and a strong peak at the same phases centered at phase 0.90. The most striking feature in comparison with the FWHM and EQW of metallic lines is that the FWHM and EQW curves of metallic lines show no significant variation during the pulsation period for the four RRc stars.
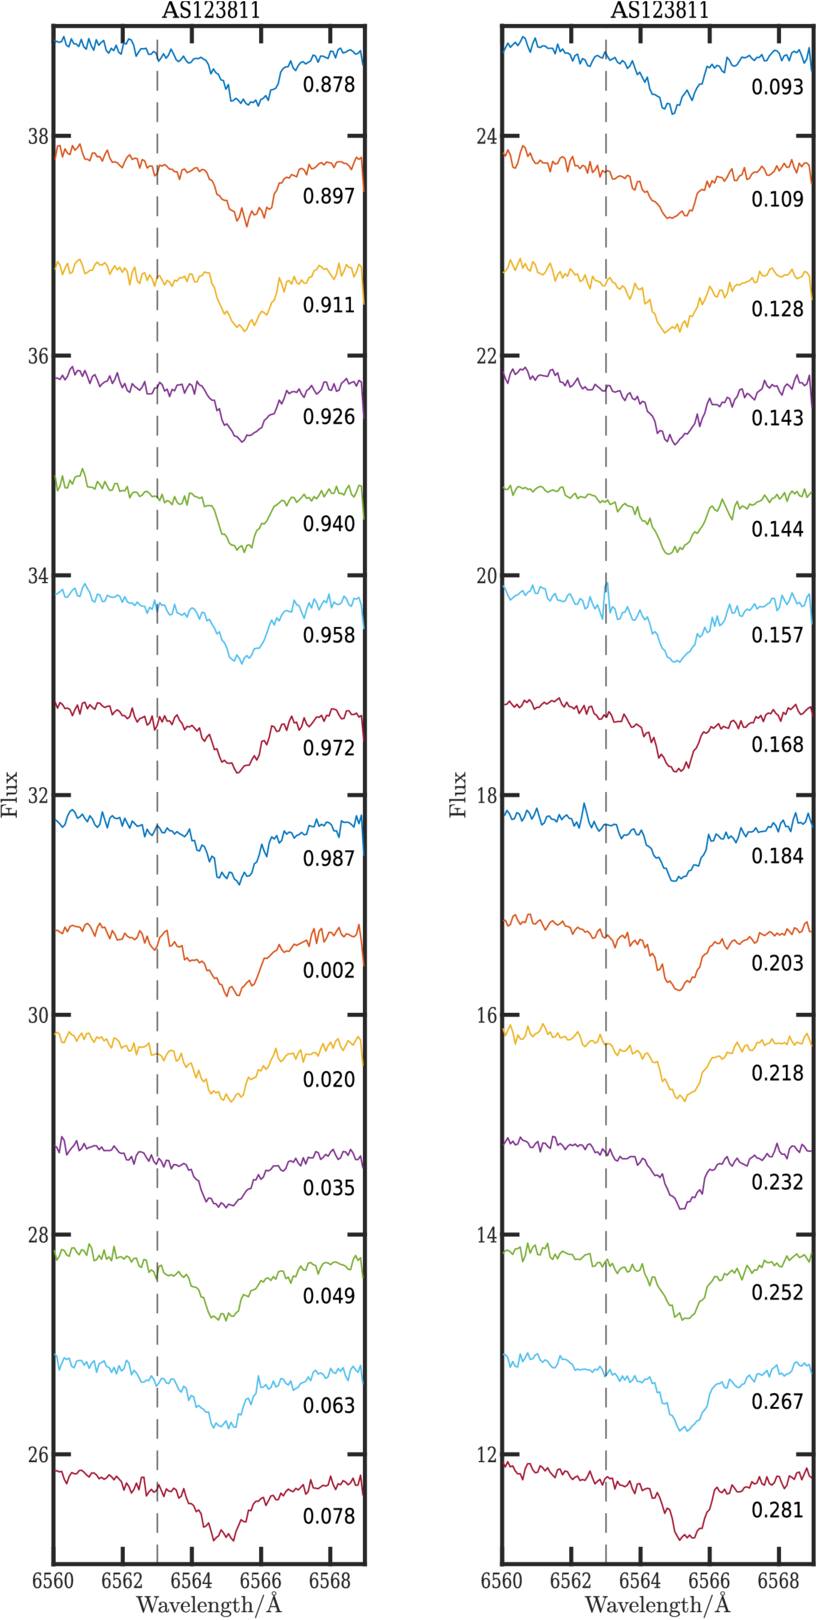
Figure 5. The hydrogen line Hα λλ6563 Å for variable phases of RRc star AS123811, in which the flux is normalized. The vertical dashed lines represent the laboratory wavelength of the Hα line in the stellar rest frame. The black number denotes the pulsation phase.
Download figure:
Standard image High-resolution image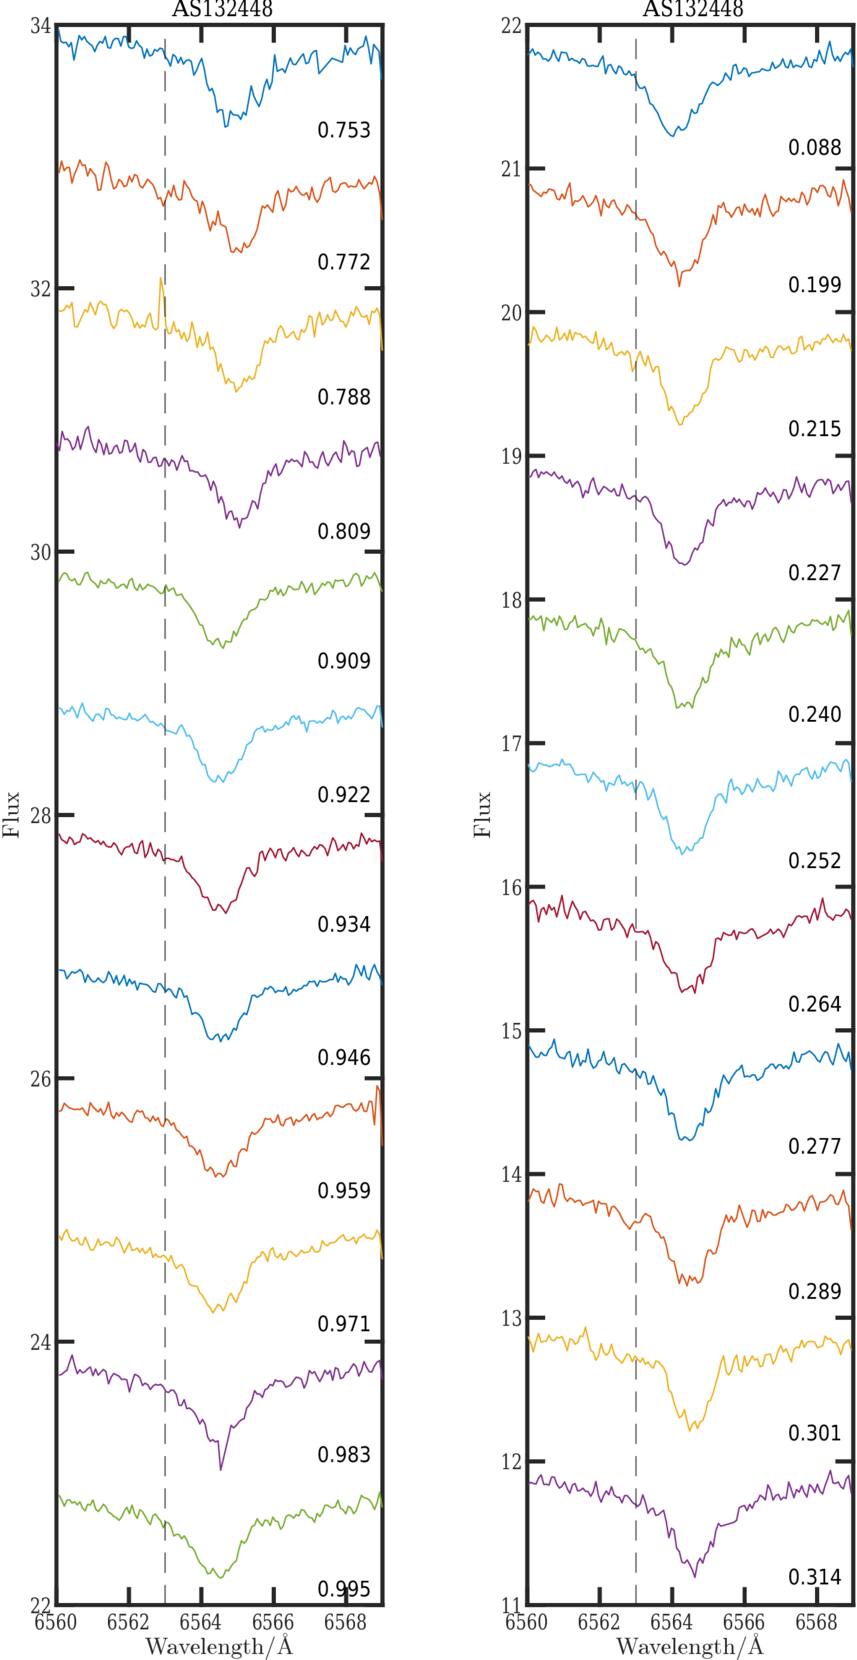
Figure 6. The hydrogen line Hαλλ6563 Å for variable phases of RRc star AS132448, in which the flux is normalized. The vertical dashed lines represent the laboratory wavelength of the Hα line in the stellar rest frame. The black number denotes the pulsation phase.
Download figure:
Standard image High-resolution image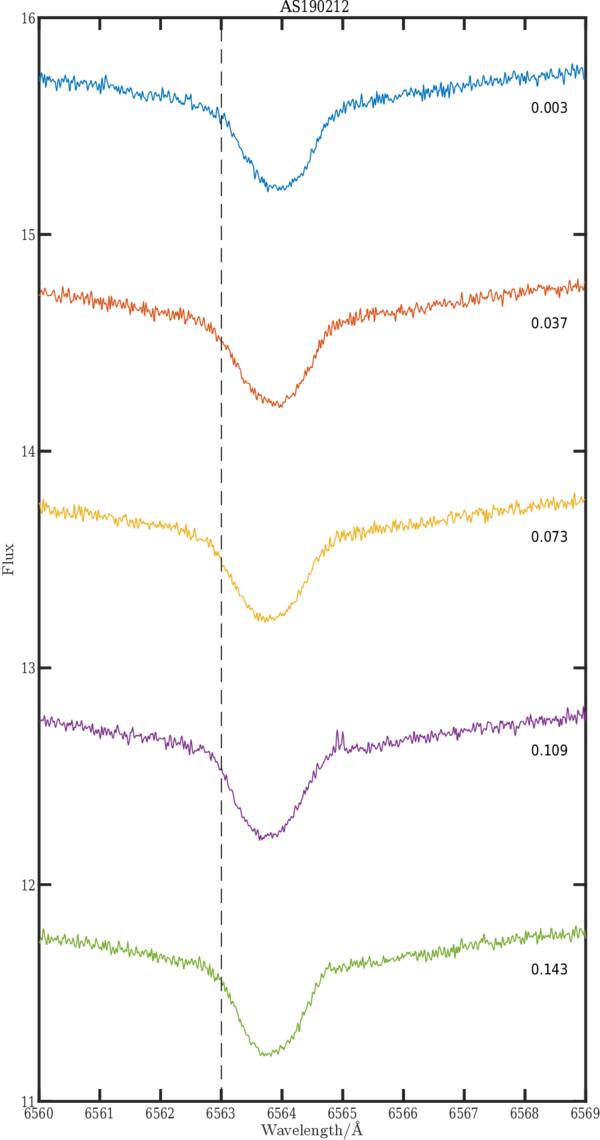
Figure 7. The hydrogen line Hα λλ6563 Å for variable phases of RRc star MT tel (AS190212), in which the flux is normalized. The vertical dashed lines represent the laboratory wavelength of the Hα line in the stellar rest frame. The black number denotes the pulsation phase.
Download figure:
Standard image High-resolution image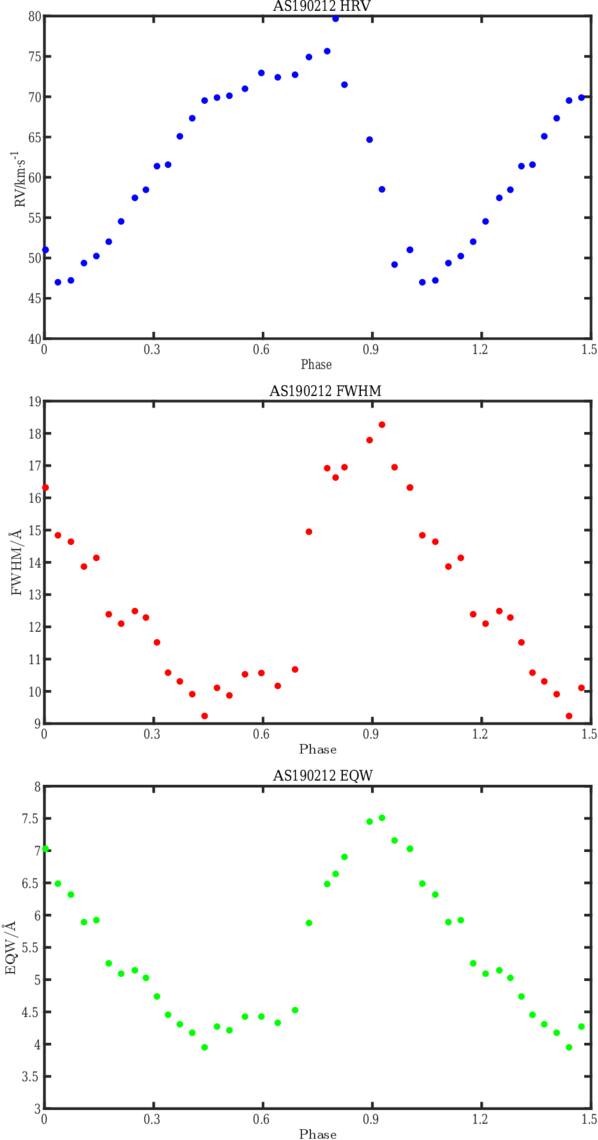
Figure 8. The HRV, FWHM, and EQW for hydrogen lines Hαλλ6563 Å of RRc star MT tel (AS190212).
Download figure:
Standard image High-resolution image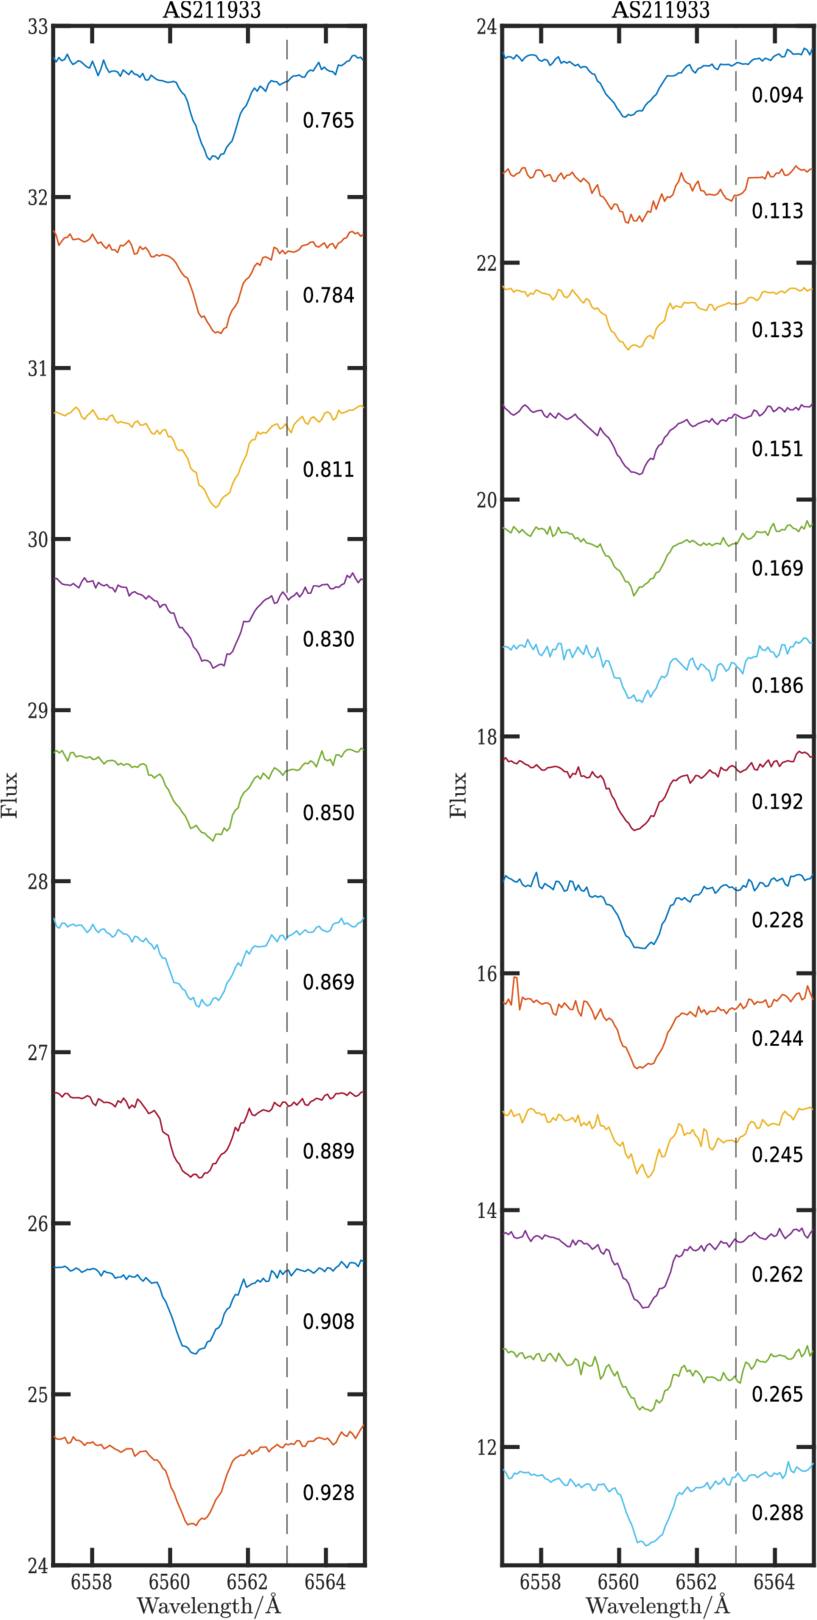
Figure 9. The hydrogen line Hαλλ6563 Å for variable phases of RRc star AS211933, in which the flux is normalized. The vertical dashed lines represent the laboratory wavelength of the Hα line in the stellar rest frame. The black number denotes the pulsation phase.
Download figure:
Standard image High-resolution image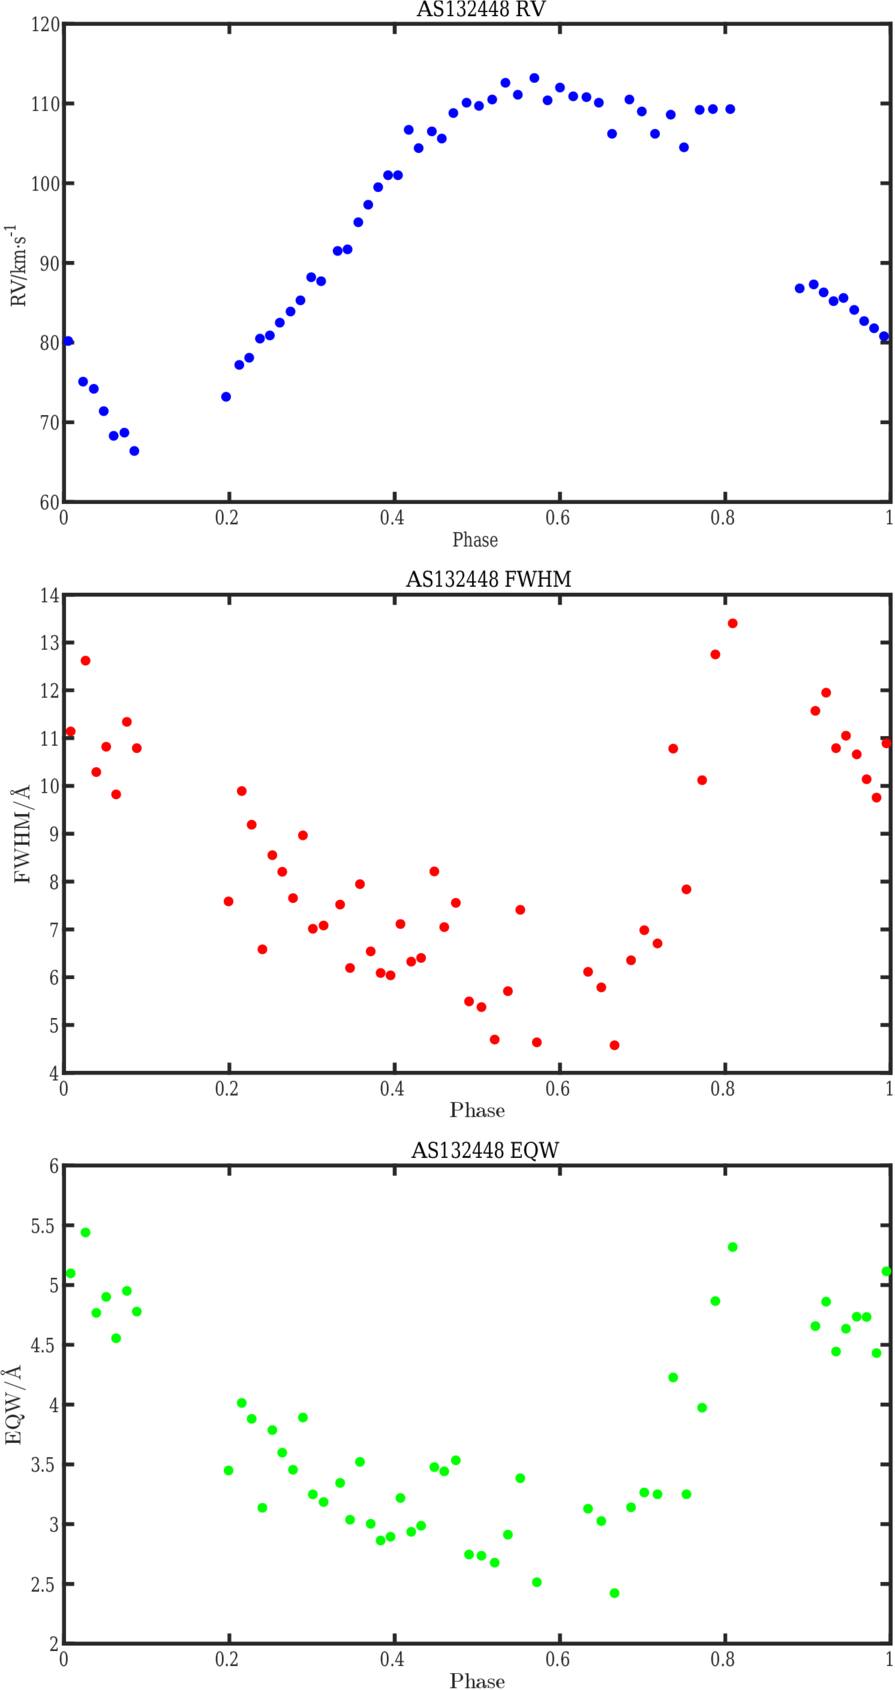
Figure 10. The HRV, FWHM, and EQW for hydrogen lines Hαλλ6563 Å of RRc star AU Vir (AS132448).
Download figure:
Standard image High-resolution image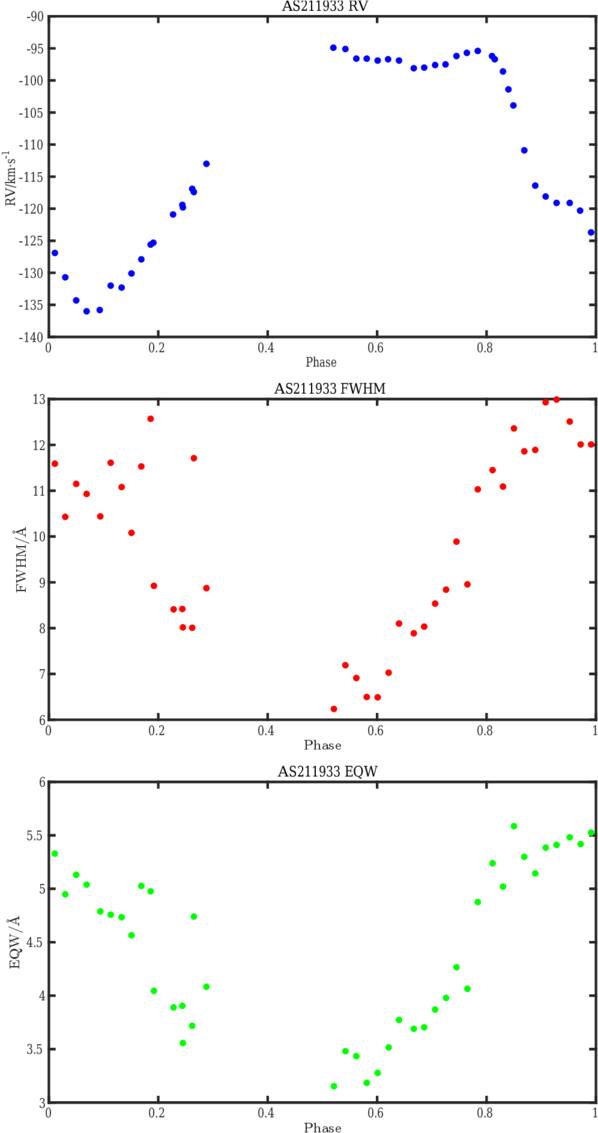
Figure 11. The HRV, FWHM, and EQW for hydrogen lines Hαλλ6563 Å of RRc star YZ Cap (AS211933).
Download figure:
Standard image High-resolution image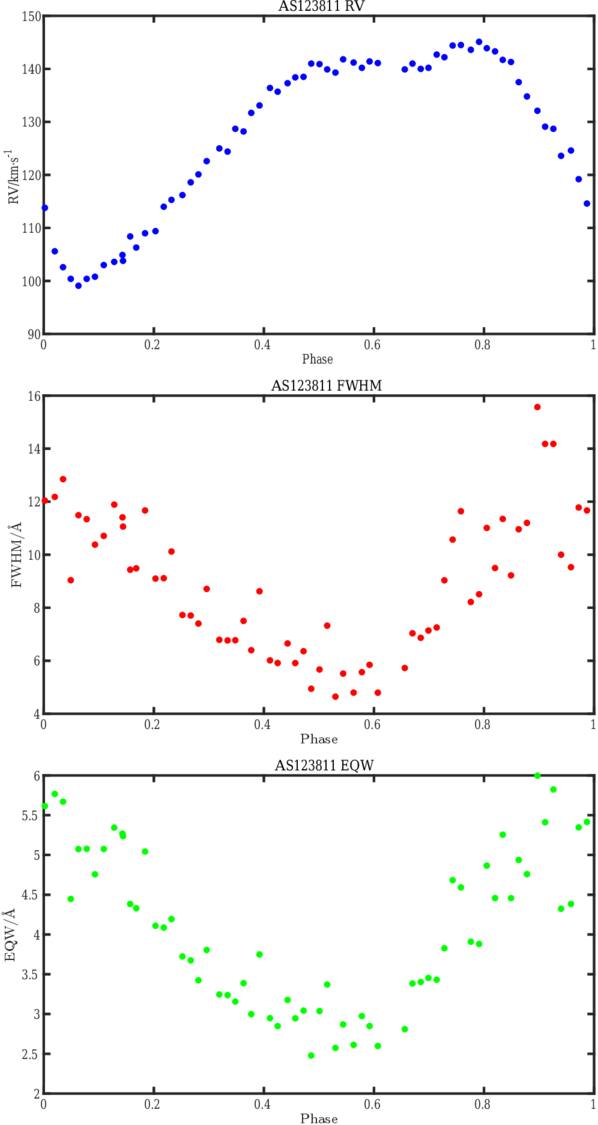
Figure 12. The HRV, FWHM, and EQW for hydrogen lines Hαλλ6563 Å of RRc star Y Crv (AS123811).
Download figure:
Standard image High-resolution image5.3.2. Hydrogen Emission Line and Line-doubling Phenomena
Figures 5, 6, 7, and 9 show the evolution of Hα over the pulsation period in Y Crv, AU Vir, MT Tel, and YZ Cap, respectively. The Balmer line presents, during the primary acceleration, a blueshifted Hα emission line followed by a Hα absorption doubling phenomenon (M. Chadid & D. Gillet 1996b). The doubling phenomenon first appears with a small blueshifted absorption component that continues to increase in intensity, while the redshifted absorption component progressively decreases in intensity until it completely disappears, giving way to the blueshifted component. The Hα emission and line-doubling phenomenon takes place during the pulsation phase interval [0.75, 0.98], 23% of the pulsation period in AU Vir; [0.87, 0.06], 20% of the pulsation period in Y Crv, and [0.76, 0.94], 18% of the pulsation period in YZ Cap. No significant signatures of the hydrogen emission line nor line-doubling phenomena are detected in the MT Tel star. Furthermore, we detect a redshifted Hα emission during pulsation phase interval [0.95, 0.25], 30% of the pulsation period in AU Vir; [0.05, 0.25], 20% of the pulsation period in Y Crv; [0.11, 0.27], 15% of the pulsation period in YZ Cap; and [0.00, 0.14], 14% of the pulsation period in MT Tel.
6. Shock Waves
6.1. Main Shock ShHe+H
Hα blueshifted emission and line doubling are detected in AU Vir, Y Crv, and YZ Cap between ϕ ≈ 0.75–0.97, when primary acceleration (ϕ ≈ 0.90) occurs near minimum radius. This is the strongest acceleration phase, causing the expansion of the stellar atmosphere. The Hα absorption lines show doubling of their cores during the primary acceleration. According to the classical Schwarzchild mechanism (M. Schwarzschild 1954), we explain the doubling phenomenon by the propagation of a strong shock wave in the atmosphere of RRc stars. The brightest Hα emissions observed during the primary acceleration are directly produced in the radiative wake of the shock waves. This main shock is created by the κ and γ mechanisms, respectively. The intensity of the main shock is correlated with the strength of the κ and γ mechanisms. Henceforth, we refer to ShHe+H.
The maximum of the FWHM and EQW of the Hα occurs when the two blue and red doubling components have the same intensity. Strong FWHM and EQW peak centered at ϕ = 0.90, mainly due to the line-doubling phenomenon caused by the ShHe+H.
The intensity of the ShHe+H shock is not significant in the most metal-poor star, MT Tel. MT Tel exhibits neither Hα emission nor line doubling, indicating weaker ShHe+H shock propagation due to its low metallicity. In contrast, the less metal-poor stars Y Crv and YZ Cap display the strongest ShHe+H main shock, accompanied by the highest dynamical acceleration (Tables 2 and 3), yet the shock is weaker in the most metal-poor ones. This suggests that even within a population of metal-poor stars, small variations in metallicity influence shock strength. The more metal-poor a star is, the closer it lies to the cooler fundamental red edge, leading to a deeper convective envelope and thicker compression zones. Consequently, the ShHe+H shock crosses the metal-poor photosphere at a lower optical depth and with a smaller Mach number. As the shock interacts with the density inhomogeneities typical of convective envelopes, it generates turbulent velocities that contribute to shock dissipation.
We attribute the weaker ShHe+H shock in the most metal-poor stars to their larger convective envelopes, which enhance turbulence and promote shock dissipation. This behavior is rooted in structural differences between metal-poor and metal-rich stars. Lower metallicity reduces the overall opacity of stellar material, resulting in more extended and deeper convective envelopes (H. A. Smith 2004; M. Chadid et al. 2017). This in turn influences the atmospheric response to pulsation and the development of radiative shocks. Early theoretical insights into this opacity–convection relationship were already noted by S. A. Zhevakin (1953).
Table 2 demonstrates a correlation between metallicity and shock intensity: the most metal-poor stars, such as MT Tel, exhibit low dynamical acceleration, indicating a weaker ShHe+H shock. This trend can be explained by the structure of convective envelopes; the more metal-poor a star is, the deeper its convective envelope, which amplifies turbulence and facilitates shock dissipation. Conversely, stars with slightly higher metallicity have less developed convective envelopes, leading to reduced dissipation and stronger ShHe+H shock. The ShHe+H shock develops further as it propagates outward, following the atmospheric extension of the star. In more extended atmospheres, the ShHe+H shock continues to travel outward into the upper layers, where its amplitude increases as the gas density decreases. As a result, the shock reaches higher Mach numbers in the upper atmosphere. Table 3 highlights how extended atmosphere influences ShHe+H shock propagation in different stars. Y Crv has the most extended atmosphere (18% R⊙), allowing the shock to develop further and reach higher Mach numbers in the upper layers (highest dynamical acceleration 11.4 m s−1). In contrast, MT Tel has the least extended atmosphere (15% R⊙), limiting shock amplification (lowest dynamical acceleration 8.5 m s−1 ). These variations indicate that stars with more extended atmospheres provide more space for the shock to strengthen as it propagates outward, while those with less extended atmospheres experience weaker shock evolution.
6.2. The Ballistic Shock ShBall
In RRab stars, the ballistic shock, ShPM3, described in M. Chadid et al. (2014) follows the main ShHe+H shock. The ShPM3 ballistic shock is produced by compression heating and induces the secondary acceleration. In RRab stars, this shock (M. Chadid et al. 2014) is strong enough to interact with the extended atmosphere, producing a detectable Hα emission and also the Hα line-doubling phenomenon, as detected for the first time by M. Chadid et al. (2017). In their study, M. Chadid et al. (2017) show that Hα line doubling is detected in the metal-poor RRab stars, but not in the metal-rich ones during ShPM3. They explain that the greater the dynamical gravity, the larger the ShHe+H shock intensity that causes a higher level of dynamical imbalance, i.e., the nonsynchronization of motions in the upper and lower photospheric layers. Stronger collision induces higher supersonic motion, ShPM3. Thus, secondary acceleration becomes more important.
M. Chadid et al. (2017) attribute these detections to the fact that the metal-poor RRab atmospheres are more extended, and the amplitudes of the ballistic motions of the metal-poor RRab atmospheres are greater than those of metal-rich RRab. In fact, the ballistic photospheric motion has its greater amplitude in metal-poor relative to metal-rich RRab stars. The greater extensions of the metal-poor envelopes complicate their atmospheric motions, and the nonsynchronization effect greatly changes atmospheric motion structure and creates chaotic behavior, mainly in the upper atmospheres. M. Chadid et al. (2017) also explain that the region of formation of spectral lines is greatly enlarged with concomitant effects on line profiles. This enlarged region of line formation in metal-poor stars is the origin of the greater duration of Hα doubling and the peak Hα emission flux. Hα emission is generally weaker in metal-rich RRab stars.
In this study, we detect that a secondary acceleration appears around pulsation phase 0.55–0.60 in AU Vir, Y Crv, YZ Cap, and MT Tel, a pronounced elbow in the radial velocity curve, coinciding with the timing of ShPM3. We detect that the stronger the dynamical gravity, the more important secondary acceleration (Tables 2 and 3), as reported by M. Chadid et al. (2017) in RRab atmospheres. However, in all four RRc stars, no Hα emission nor Hα line doubling is detected during the ShPM3 ballistic shock. This confirms that the ShPM3 temperature is insufficient to trigger hydrogen emission. This means that the ShHe+H shock intensity in RRc induces a lower level of dynamical imbalance, i.e., the nonsynchronization of motions in the upper and lower photospheric layers to RRab. On the other hand, RRc stars are less extended than RRab stars, leading to rapid dissipation. Henceforth, we refer to ShBall in RRc stars.
6.3. The Gravitational Collapse Shock ShGravity
We refer to the gravitational collapse shock as ShGravity, a newly proposed shock phenomenon in RR Lyrae stars. This return shock occurs at the onset of atmospheric contraction, emerging when the outward-moving atmospheric layers fall back toward the stellar surface under gravity, typically around pulsation phase ϕ = 0.30. In Eulerian coordinates, this is a receding shock, while in the Lagrangian frame, it is advancing. As the infalling gas collides with denser layers, it undergoes rapid recompression, producing a localized shock wave. This recompression excites hydrogen atoms, resulting in redshifted Hα emission.
Despite generating detectable spectral signatures, ShGravity has little impact on radial velocity or light curves. The absence of a pronounced velocity profile discontinuity, such as the classical elbow, indicates that the shock is confined to outer atmospheric layers, without significantly disturbing the global dynamics of the star. Moreover, the associated Hα emission is too weak to noticeably affect the overall luminosity.
ShGravity coincides with the Lump observed in RRab light curves, first identified by M. Chadid & G. Preston (2013). It bears similarities to the ShPM shock, which also produces redshifted Hα emission at ϕ ≈ 0.35, indicating inward-moving shocked gas. In RRab stars, ShPM is a strong, global shock, accompanied by a discontinuity in the radial velocity curve (the Bulge) and a luminosity feature (the Lump).
We propose that ShGravity results from the same fundamental hydrodynamical process as ShPM, but develops within the thinner and more compressible atmosphere of RRc stars. This likely explains its localized, transient character and its different energy dissipation profile.
Our spectroscopic data reveal redshifted Hα emission in RRc stars over a broader phase interval than typically observed in RRab stars (see Table 4).
Table 4. Pulsation Phase Intervals and Durations of Hα Emission with Line Doubling and Redshifted Hα Emission
| Star | Blueshifted Hα and Line-doubling Phase | Duration | Redshifted Hα Phase | Duration |
|---|---|---|---|---|
| (%) | (%) | |||
| AU Vir | [0.75, 0.98] | 23% | [0.95, 0.25] | 30% |
| Y Crv | [0.87, 0.06] | 20% | [0.05, 0.25] | 20% |
| YZ Cap | [0.76, 0.94] | 18% | [0.11, 0.27] | 15% |
| MT Tel | ⋯ | ⋯ | [0.00, 0.14] | 14% |
Download table as: ASCIITypeset image
In RRc stars, redshifted emission begins significantly earlier than in RRab stars, where it typically appears near ϕ ≈ 0.3, suggesting differences in shock dynamics. For instance, the presence of redshifted emission as early as ϕ ≈ 0.00 in MT Tel points toward the jump (ShPM1) shock described by M. Chadid et al. (2014), which marks the initial stage of atmospheric compression. Conversely, the persistence of emission up to ϕ ≈ 0.3 in AU Vir, Y Crv, and YZ Cap aligns with the Lump (ShPM) shock seen in RRab stars M. Chadid et al. (2014).
These observations suggest that in RRc stars, the ShPM1 and ShPM shocks may not be distinct events but instead represent a continuous, blended shock signature. This behavior results from the compact and compressible nature of RRc atmospheres, which enables faster transitions between different shock regimes.
Moreover, the longer duration and greater intensity of redshifted Hα emission in RRc stars point toward a relatively stronger ShGravity compared to RRab stars. In RRab stars, more extended atmospheres act as buffers; they absorb and dissipate the energy of the infall more gradually, reducing the likelihood of hydrogen excitation and emission.
Since ShGravity is powered by gravitational infall, its intensity is proportional to the kinetic energy of the collapsing layers:

At first glance, this relation suggests that denser atmospheres (higher ρ) should produce stronger shocks. However, the observational signatures, such as Hα emission, depend not only on the energy injected but also on how that energy is transported and dissipated within the atmosphere. In denser envelopes, the shock front can be more strongly damped through radiative diffusion and thermal conduction, which limits local heating and delays hydrogen excitation.
By contrast, in the lower-density atmospheres of RRc stars, the infall velocity vinfall tends to be higher, and the same or even lower total energy can lead to more effective local heating. The lower density reduces radiative damping, allowing the shock to heat the gas more efficiently and trigger observable emission. These stars also have lower atmospheric mass and higher compressibility, which leads to faster energy dissipation and shorter shock durations.
This compressibility is reflected in the atmospheric pressure scale height:

where g is the surface gravity. In RRc stars, higher g values lead to smaller H, meaning more compact atmospheres that respond more quickly to dynamic perturbations.
In contrast, RRab stars, with denser and more extended envelopes, retain shock energy longer, resulting in more sustained but often less intense emission features.
Finally, metallicity also modulates shock visibility. Since the opacity κ scales with the metal content Z,

metal-poor atmospheres (typical of RRc stars) exhibit lower opacity, which facilitates shock propagation while limiting radiative losses, thereby contributing to sharper, more transient emission signatures.
To sum up, it is the overall atmospheric structure, particularly density, compressibility, and metallicity, that governs the nature and observability of shock phenomena in RR Lyrae stars. RRc stars favor rapid, intense, but short-lived shocks, while RRab stars support slower, more buffered shock evolution.
7. Shock Velocity and Classification
7.1. Shock Velocity and the Compression Ratio
In radiative shocks, the postshock gas velocity (Vpost) and the shock velocity (Vs) are related through mass conservation and the compression ratio r = ρpost/ρpre, where ρ denotes the gas density. For an ideal monoatomic gas with adiabatic index γ = 5/3, the Rankine–Hugoniot conditions yield a theoretical compression ratio of r = 4 for strong adiabatic shocks. In the presence of radiative cooling, r can increase to values ≳7 depending on shock strength and cooling efficiency (Y. B. Zeldovich & Y. P. Raizer 1966; B. T. Draine 2011).
For RRc stars, which exhibit relatively modest radiative energy losses and partially ionized hydrogen layers, a compression ratio of r = 2.5 is considered physically realistic. This choice reflects moderate shock compression and avoids overestimating the shock strength that would result from assuming r = 3 or higher, which are more typical of RRab stars. We adopt r = 2.5 as a physically realistic compression ratio for partially radiative, nonadiabatic shocks, following the classical treatments of Y. B. Zeldovich & Y. P. Raizer (1966) and B. T. Draine (2011). This value represents an intermediate case between adiabatic conditions (r ≈ 4) and fully radiative shocks (r > 4). To assess sensitivity, we tested variations in r between 2.0 and 3.0. These produce changes in the derived shock velocity Vs of less than 15%, leaving the relative shock ranking across the stars unaffected.
From the conservation of mass flux across the shock in the stellar rest frame, and assuming Vpre = 0:

Solving for Vpost yields

Thus, for r = 2.5:

However, the observed Hα emission arises not from the immediate postshock interface, but from a radiative cooling zone located downstream, where the gas has been compressed and then decelerated. To account for this, we introduce a deceleration factor β defined by

Combining both relations:

Assuming β = 0.6 and r = 2.5 gives

This approximation is used throughout the paper to estimate shock velocities from Doppler measurements of the Hα emission, while accounting for both physical compression and postshock deceleration effects.
7.1.1. Doppler Measurement of the Hα Emission
The Hα emission arises from the radiative cooling region immediately behind the shock front, where recombination of hydrogen produces Balmer radiation. The emitting gas, compressed and decelerated postshock, exhibits a Doppler shift that reflects a velocity lower than the instantaneous postshock flow.
The observed velocity is determined via


This formulation improves upon empirical estimates by incorporating a physically motivated compression ratio (r = 2.5) and a deceleration factor β suited to the cooling zone properties of RRc stars. The resulting scaling, 
7.1.2. Temperature Effects and Method Validity
This method is reliable at temperatures above 8000 K, where hydrogen is mostly ionized and Balmer emission is strong. For RRc stars with typical effective temperatures between 7000 and 7500 K, Hα remains detectable but must be interpreted carefully due to partial recombination and potential optical depth effects.
7.1.3. Mach Number Estimation
The shock strength is quantified by the Mach number:

with the adiabatic sound speed:

(B. W. Carroll & D. A. Ostlie 2017), assuming γ = 5/3, T = 7250 K, and μ = 1.3.
Table 5 presents the shock velocities and corresponding Mach numbers for r = 2.5 and β = 0.6 in all three RRc stars analyzed.
Table 5. Shock Velocity and Mach Number for Outward and Rebound Shocks Assuming r = 2.5 and β = 0.6
| Star | Vs (He+H) |

| Vs (Gravity) |

|
|---|---|---|---|---|
| (km s−1) | (km s−1) | |||
| AS123811 | 323.6 | 30.2 | 231.2 | 21.6 |
| AS132448 | 231.2 | 21.6 | 166.5 | 15.6 |
| AS211933 | 166.5 | 15.6 | 138.7 | 13.0 |
Download table as: ASCIITypeset image
Table 6. Classification of Shock Regimes in RRc Stars
| Shock Regime | Mach Number | Observable Signatures | Example Star |
|---|---|---|---|
| Transonic | 1–2 | No emission, calm profiles | MT Tel (infall) |
| Supersonic | 2–5 | Minor asymmetries, no Hα emission | ⋯ |
| Low hypersonic | 5–8 | Hα line doubling, weak emission | YZ Cap |
| Mild hypersonic | 8–15 | Strong Hα broadening, emission peak | AU Vir |
| Strong hypersonic | 15–25 | Intense Doppler shift, no He lines | ⋯ |
| Ultrahypersonic | >25 | Sharp Hα transients, extreme velocities | Y Crv |
Download table as: ASCIITypeset image
These results confirm that both ShHe+H (main outward shock) and ShGravity (gravitational return shock) are strongly supersonic in all three stars.
The strongest shock is observed in AS123811, with a peak Mach number of 30.2 for the main ShHe+H event. This suggests a highly dynamic atmospheric expansion, consistent with an extended atmosphere and efficient energy transfer by the κ and γ mechanisms. The redshifted component, associated with ShGravity, also reaches a high Mach number of 21.6, indicating a vigorous infall and efficient recompression of the upper layers.
AS132448 shows intermediate shock intensities with Mach numbers of 21.6 (outward) and 15.6 (inward), while AS211933 presents the weakest shocks among the three stars, with Mach numbers of 15.6 and 13.0, respectively. These differences are likely influenced by variations in metallicity and atmospheric extension.
A possible explanation lies in the relative atmospheric extension, as shown in Table 3, AS123811 (Y Crv) has the most extended atmosphere (18 R⊙), allowing shocks to develop more fully as they propagate. In contrast, AS211933 (YZ Cap) has a more compact atmosphere, where the limited spatial development suppresses the amplification of shock velocities.
Furthermore, the trend in Mach number correlates with the strength of Hα features. AS123811 exhibits the highest FWHM and EQW at ϕ ≈ 0.90, coinciding with the phase of maximum dynamical acceleration and the strongest ShHe+H. The detection of significant redshifted emission in this star also confirms a strong ShGravity contribution.
In summary, RRc stars exhibit distinct yet complementary shock phenomena, ShHe+H and ShGravity, each with supersonic velocities and measurable spectral signatures. The variability in Mach number across stars provides insights into the influence of atmospheric structure, metallicity, and pulsation strength on the dynamics of shock propagation.
7.2. Shock Classification for RRc Stars
Our direct measurements of shock velocities in RRc stars reveal Mach numbers that significantly exceed the traditional classification thresholds discussed in the literature. In particular, maximum Mach values reach up to  . This estimate assumes a typical sound speed of cs ∼ 10.7 km s−1 in RRc photospheric layers (for T ∼ 7250 K, μ ∼ 1.3), and Doppler-inferred shock velocities reaching vshock ∼ 324 km s−1 (as in AS123811), well beyond the “hypersonic” regime typically defined by
  .
.
The classification scheme proposed by (M. Chadid et al. 2017), based on spectroscopic diagnostics in RRab stars, defines four regimes: transonic, supersonic, hypersonic (He I emission), and ultrahypersonic (He II emission). However, it is primarily grounded in emission features and indirect temperature diagnostics, rather than direct shock velocity measurements.
In contrast, our method deriving Vs from Doppler shifts of the Hα line and converting it into Mach numbers using a sound speed of cs ≈ 10.7 km s−1 (for T ≈ 7250 K) offers a more direct kinematic quantification of the shock strength. As a result, we find that RRc stars exhibit hypersonic shock velocities, yet without He I or He II emission lines.
This apparent discrepancy can be reconciled by considering the compact and low-opacity nature of RRc atmospheres. The shocks, while extremely fast, are short lived and may not sustain the high postshock temperatures required to excite helium lines before dissipating. This implies that RRc stars occupy a distinct shock regime, one characterized by extremely high Mach numbers, but lacking extended radiative wakes typically associated with helium ionization.
We therefore propose an extension to the standard shock classification framework, specific to RRc stars, rather than a revision of the original scheme. This approach complements the work of M. Chadid et al. (2017) by introducing a parallel classification adapted to a different subclass of RR Lyrae variables.
This updated classification is summarized below:
- 1.Ultrahypersonic.
 extremely fast shocks in compact RRc atmospheres, with no He I/II emission due to short radiative timescales.
 - 2.Strong hypersonic. sharp Hα transients, large Doppler shifts, but still no helium lines.
- 3.Mild hypersonic. clear Hα doubling, strong line broadening, occasionally weak emission.
- 4.Low hypersonic. incipient line doubling, small FWHM increases.
- 5.Supersonic. minor velocity structure, no emission.
- 6.Transonic. no Doppler effects, steady absorption.


This classification reflects the specific atmospheric dynamics of RRc stars, where extremely high shock velocities can occur within compact, radiatively efficient envelopes. The absence of He I/II lines at high Mach numbers suggests rapid shock dissipation before helium excitation, contrasting with the longer-lived, helium-emitting shocks in RRab stars.
These findings not only highlight the presence of hypersonic shocks in RRc stars but also emphasize the need to reassess how we interpret stellar shock phenomena across different subclasses of RR Lyrae variables.
While traditional spectroscopic diagnostics such as the presence of He I and He II emission lines remain effective in extended RRab atmospheres, they may be insufficient for characterizing the more compact and rapidly evolving shock environments of RRc stars. The absence of helium lines, despite extremely high shock velocities, underscores the limitations of emission-based classification schemes when applied universally.
By combining direct Doppler velocity measurements with shock compression physics, our approach offers a complementary pathway to probe the dynamical structure of RRc atmospheres. The proposed classification provides a framework to interpret shock signatures in compact stars that may otherwise appear spectroscopically quiet.
This work also opens the door to a broader investigation of dynamical diversity among RR Lyrae stars, suggesting that the interplay between metallicity, atmospheric structure, and pulsation amplitude may create a richer variety of shock regimes than previously recognized.
8. Summary
This study presents the first detection of shock waves in RRc stars, expanding our understanding of atmospheric dynamics in first-overtone pulsator stars. By analyzing high-resolution spectroscopic data, we identify key shock-related features, including hydrogen emission, line doubling, and rapid variations in radial velocity. These observations confirm that, much like RRab stars, RRc stars experience strong shock interactions that significantly influence their spectral and pulsational behavior.
The presence of multiple shock structures, such as the primary shock (ShHe+H), ballistic shock (ShBall), and gravitational collapse shock (ShGravity), demonstrates the complexity of pulsation-driven atmospheric motion in RRc stars. This discovery challenges prior assumptions that shock waves were absent in first-overtone pulsators. Instead, our findings suggest that RRc stars undergo a sequence of interacting shock waves, shaping their light curves and spectral evolution in previously unrecognized ways.
By deriving shock velocities directly from Doppler shifts of the Hα line, we estimate shock Mach numbers up to  . This estimate assumes a typical sound speed of cs ∼ 10.7 km s−1 in RRc photospheric layers (for T ∼ 7250 K, μ ∼ 1.3), and Doppler-inferred shock velocities reaching vshock ∼ 324 km s−1 well beyond the conventional threshold for hypersonic motion. These results call for a reevaluation of existing shock classification frameworks, which have so far been based predominantly on spectroscopic signatures in RRab stars, particularly the presence of He I and He II emission lines.
To account for the high velocity but spectroscopically quiet shocks observed in RRc stars, we propose an extension to the traditional classification scheme. Our framework introduces a new category, the ultrahypersonic compact regime characterized by Mach numbers above 25 but lacking helium emission due to rapid shock dissipation in compact, low-opacity atmospheres. This refined classification better captures the diversity of shock behaviors among RR Lyrae subclasses and underscores the importance of direct velocity diagnostics in stellar pulsation studies.
Furthermore, our study highlights the need to consider metallicity-dependent effects in shock propagation, as previously established for RRab stars (M. Chadid et al. 2017). The first observational evidence of such processes in RRc stars opens new avenues for understanding the interplay between stellar structure, pulsation mechanisms, and shock dynamics.
These findings not only reshape our view of RRc stars as high-dynamic systems but also reveal the limitations of classical spectroscopic indicators in compact pulsators. Moving forward, expanding the sample of RRc stars analyzed will be essential to confirm the universality of these shock phenomena.
Acknowledgments
This work is part of the doctoral research of Junzhang Li, carried out under the supervision of Merieme Chadid. We gratefully acknowledge the China Scholarship Council for awarding Junzhang Li the Excellence Doctoral Scholarship (grant No. 202206120021). We thank George Preston, Christopher Sneden, and the Carnegie Observatories team for their valuable contributions. We also thank ESO and the staff at La Silla Observatory for their support during our observing run under program ID HARPS 79.D-0462.