Abstract
We present strong gravitational lensing models for 37 galaxy clusters from the Sloan Digital Sky Survey Giant Arcs Survey. We combine data from multi-band Hubble Space Telescope Wide Field Camera 3 (WFC3) imaging, with ground-based imaging and spectroscopy from Magellan, Gemini, Apache Point Observatory, and the Multiple Mirror Telescope, in order to detect and spectroscopically confirm new multiply imaged lensed background sources behind the clusters. We report spectroscopic or photometric redshifts of sources in these fields, including cluster galaxies and background sources. Based on all available lensing evidence, we construct and present strong-lensing mass models for these galaxy clusters. The clusters span a redshift range of 0.176 < z < 0.66 with a median redshift of z = 0.45, and sample a wide range of dynamical masses, 1.5 < M200 < 35 × 1014  , as estimated from their velocity dispersions. As these clusters were selected as lenses primarily owing to a fortuitous alignment with background galaxies that results in giant arcs, they exhibit a wide range in Einstein radii, 1
3 < θE < 23
1 for a source at z = 2, with a median θE = 10
8. The reduced HST images and lens model outputs are made available to the scientific community as high-level data products with this publication.
1. Introduction
Strong-lensing models of galaxy clusters provide a detailed description of the mass distribution for the inner ∼100 kpc. This method is complementary to other mass measurements, as it provides a high-resolution measurement of substructure at the core, on spatial scales at which other proxies such as X-ray, the Sunyaev–Zel’dovich (SZ) effect, dynamical masses, and weak lensing do not resolve.
In addition, the high magnification by clusters allows their use as “cosmic telescopes” to study background galaxies. Some of the highest redshift galaxies known were discovered as magnified sources in the fields of massive strong-lensing clusters (e.g., Zheng et al. 2012; Coe et al. 2013; Zitrin et al. 2014; Watson et al. 2015; Hashimoto et al. 2018; Salmon et al. 2018). At intermediate redshifts, some of the best-studied star-forming galaxies are those that are magnified by gravitational lensing, which enables high signal-to-noise measurements (e.g., Pettini et al. 2000, 2002; Cabanac et al. 2008; Quider et al. 2009, 2010; Dessauges-Zavadsky et al. 2011; Rigby et al. 2018a), and probes sub-galactic scales (e.g., Whitaker et al. 2014). Magnifications caused by the gravity of strong-lensing clusters can exceed factors of hundreds, if galaxies are fortuitously placed in close proximity to a lensing caustic.
To use galaxy clusters as telescopes, a detailed description of their mass distribution is key. The lens model determines the lensing magnification, which in turn connects the intrinsic and observed physical properties of the background sources: size, luminosity, star formation rate, and stellar mass. Thus, lens models are necessary in order to understand these lensed galaxies in the context of their source properties.
In the era of large optical surveys, the field of strong gravitational lensing is growing beyond detailed studies of a handful of strong-lensing clusters. Mining the Sloan Digital Sky Survey (SDSS) has yielded hundreds of new galaxy cluster-scale lenses, which form the SDSS Giant Arcs Survey (SGAS). Extensive follow-up observations of clusters from this survey included optical ground-based imaging and spectroscopy with a variety of telescopes, as well as two Large Spitzer Space Telescope programs. For some of these clusters there are X-ray and SZ observations. In a Large Hubble Space Telescope (HST) Guest Observer (GO) program, GO-13003 (hereafter SGAS-HST; PI Gladders), we obtained multi-band Wide Field Camera 3 (WFC3) images.
In this paper, we present strong gravitational lensing models of 37 galaxy clusters from SGAS, based on multi-band HST data and follow-up spectroscopy.
The HST subsample of SGAS, hereafter SGAS-HST, was designed to enable detailed study of the background highly magnified galaxies, most of which are observed at redshifts of 1 < z < 3, the epoch when most of the stars in the Universe were formed (Madau & Dickinson 2014). These HST observations span a large wavelength range in order to sample the spectral energy distribution of each background galaxy. The high spatial resolution of HST reveals their morphology and stellar substructure, and combined with lensing magnification, probes sub-kiloparsec scales (e.g., Johnson et al. 2017a, 2017b; Rigby et al. 2017). The high spatial resolution of HST is critical for computing reliable lens models. It provides robust identification of images and counter-images of strongly lensed galaxies, and reveals additional lensed galaxies beyond the main (typically bright) source in each field.
This paper is organized as follows. In Section 2, we describe the SGAS; in Section 3 we present the HST imaging and the ground-based spectroscopy using the Gemini and Magellan telescopes; Section 4 describes the lens-modeling process in general, followed by cluster-specific lens model details, which are given in the subsections. We conclude in Section 6.
The reduced HST images and lens model outputs are made available to the scientific community as high-level data products with this publication via doi:10.17909/t9-cqtj-y020, on the Multimission Archive at the Space Telescope Science Institute (MAST).16
Throughout this work, unless specifically noted otherwise, we assume a flat cosmology with ΩΛ = 0.7,  , and H0 = 70 km s−1 Mpc−1. Magnitudes are reported in the AB system.
2. The Sloan Giant Arcs Survey
The SGAS is a survey for highly magnified galaxies that have been gravitationally lensed by foreground clusters of galaxies, in the SDSS (Blanton et al. 2017). The work presented here is based primarily on imaging and photometric catalogs from Data Release 7 (DR7; Abazajian et al. 2009). A full discussion of the survey, selection criteria, and purity and completeness estimate will appear in a separate paper (M. Gladders et al. 2020 in preparation). Galaxy clusters and groups were selected from the photometry catalog using the cluster red-sequence algorithm of Gladders & Yee (2000). Imaging data in g, r, i, and z were downloaded and cropped to 45 × 4
5 in size, centered on the detected clusters, with some overlap around larger clusters or filaments. The SDSS data were combined into color images, using a custom selection of scale and contrast in order to maximize the visual detectability of faint arc-like features. The color images were visually inspected by four investigators for evidence of gravitational lensing. Each inspector scored each image on a scale of 0–3, where the highest score was given to obvious strong lenses. The process included a re-inspection rate of 10% of the images by each inspector in order to quantify the selection efficiency of each inspector, and the overall completeness of the sample. Candidate lenses were followed up by larger telescopes, with most of the confirmation done at the 2.56 m Nordic Optical Telescope. Spectroscopy of high-confidence arcs was obtained using Gemini North with the GMOS multi-slit spectrograph (Bayliss et al. 2011a, 2011b). All candidate lenses with an average score above 2 have been followed up in this way with 100% completeness; we reach 95% follow-up completeness for lens candidates with an average score between 1 and 2.
The multi-wavelength follow-up campaign of the SGAS sample includes imaging from space and ground: radio observations of the SZ Effect (Gralla et al. 2011), Spitzer infrared imaging (Program ID #90232, PI: Rigby; Program ID # 70154, PI Gladders), wide field optical imaging for weak lensing with Subaru (Oguri et al. 2012), HST (GO-13003, PI: Gladders; see Section 3), UV imaging with SOAR (Bayliss 2012), and X-ray imaging with the X-ray telescope of the Neil Gehrels Swift Observatory (PI: Sharon) and Chandra (Program ID #19800436, PI: Bayliss). Spectroscopy of all the primary arcs is complete (Bayliss et al. 2011b), as well as spectroscopic campaigns to obtain redshifts of secondary arcs with Magellan (PI: Sharon) and Gemini (PI: Sharon; Johnson); see Section 3.2.
Since its initial assembly in 2008 (Hennawi et al. 2008), the SGAS sample of strong-lensing clusters has been mined for bright lensed galaxies that have been studied in detail (Bayliss et al. 2010, 2014b; Koester et al. 2010; Rigby et al. 2011, 2014, 2015, 2017; Wuyts et al. 2012a, 2012b; Dahle et al. 2013, 2015; Gladders et al. 2013; Johnson et al. 2017a, 2017b; Sharon et al. 2017; Chisholm et al. 2018). Many of the brightest lensed arcs from this program have high-quality rest-frame ultraviolet spectroscopy, obtained as part of MegaSaura (the Magellan Evolution of Galaxies Spectroscopic and Ultraviolet Reference Atlas; Rigby et al. 2018a). The study of these galaxies, which would otherwise be too faint for detailed spectroscopy, is only possible due to the magnification boost by the foreground cluster and fortuitous position of the background source in a region of highest magnification. The large sample of strong-lensing clusters also enabled research of the mass distributions of the galaxy clusters themselves (e.g., Gralla et al. 2011; Oguri et al. 2012; Blanchard et al. 2013; Sharon et al. 2014) and cosmic structure (Bayliss et al. 2011a, 2014a).
3. Observations
3.1. HST Imaging
The SGAS-HST program (GO-13003, PI: Gladders) consists of 107 orbits of HST imaging during Cycle 20. Each cluster was imaged with four WFC3 filters over three orbits. Table 1 details dates, filters, and exposure times of the HST observations. We supplement our observations with archival optical WFPC2 data from programs GO-11974 (PI: Allam) and GO-11100 (PI: Bradač), which were available for five fields. Subsequent HST programs of some of these targets acquired grism spectroscopy or additional bands, including GO-14622 (PI: Whitaker), GO-14230 (PI: Rigby), and GO-14896 (PI: Bayliss).
Table 1. HST-GO-13003 Observations
| Cluster | R.A. | Decl. | Date UT | Exposure Time (s) | ||||||||
|---|---|---|---|---|---|---|---|---|---|---|---|---|
| J2000 | J2000 | F390W | F475W | F606W | F775W | F814W | F105W | F110W | F125W | F160W | ||
| SDSS J0004−0103 | 00:04:52 | −01:03:15.80 | 2013 Sep 24 | 2388 | ⋯ | ⋯ | ⋯ | 2400 | ⋯ | ⋯ | 1112 | 1212 |
| SDSS J0108+0624 | 01:08:42 | +06:24:43.50 | 2013 Aug 3 | 2388 | ⋯ | 2400 | ⋯ | ⋯ | 1112 | ⋯ | ⋯ | 1212 |
| SDSS J0146−0929 | 01:46:56 | −09:29:52.40 | 2013 Sep 29 | 2388 | ⋯ | 2400 | ⋯ | ⋯ | 1112 | ⋯ | ⋯ | 1212 |
| SDSS J0150+2725 | 01:50:01 | +27:25:36.20 | 2013 Aug 2 | 2272 | ⋯ | 1456 | ⋯ | 1980 | ⋯ | ⋯ | ⋯ | 912 |
| SDSS J0333−0651 | 03:33:05 | −06:51:22.20 | 2013 Jul 17 | 2388 | ⋯ | ⋯ | ⋯ | 2400 | ⋯ | ⋯ | 1112 | 1212 |
| SDSS J0851+3331 | 08:51:39 | +33:31:10.83 | 2013 Feb 26 | 2368 | ⋯ | ⋯ | ⋯ | 2380 | ⋯ | ⋯ | 1112 | 1212 |
| SDSS J0915+3826 | 09:15:39 | +38:26:58.77 | 2013 Apr 3 | 2372 | ⋯ | ⋯ | ⋯ | 2388 | ⋯ | ⋯ | 1112 | 1212 |
| SDSS J0928+2031 | 09:28:06 | +20:31:25.55 | 2013 Feb 1 | 2388 | ⋯ | 2400 | ⋯ | ⋯ | ⋯ | 1112 | ⋯ | 1212 |
| SDSS J0952+3434 | 09:52:40 | +34:34:47.09 | 2013 Sep 28 | 2368 | ⋯ | 2380 | ⋯ | ⋯ | 1112 | ⋯ | ⋯ | 1112 |
| SDSS J0957+0509 | 09:57:39 | +05:09:31.80 | 2013 Mar 14 | 2388 | ⋯ | ⋯ | ⋯ | 2400 | ⋯ | ⋯ | 1112 | 1212 |
| SDSS J1002+2031 | 10:02:27 | +20:31:02.61 | 2013 May 15 | 2388 | ⋯ | 2400 | ⋯ | ⋯ | 1112 | ⋯ | ⋯ | 1212 |
| SDSS J1038+4849 | 10:38:43 | +48:49:18.73 | 2013 May 16 | 2392 | ⋯ | ⋯ | ⋯ | ⋯ | ⋯ | 1112 | ⋯ | 1212 |
| SDSS J1050+0017 | 10:50:40 | +00:17:06.91 | 2013 Apr 19 | 2388 | ⋯ | 2400 | ⋯ | ⋯ | ⋯ | 1112 | ⋯ | 1212 |
| SDSS J1055+5547 | 10:55:05 | +55:48:23.23 | 2013 Dec 7 | 2408 | ⋯ | ⋯ | 2424 | ⋯ | ⋯ | 1112 | ⋯ | 1212 |
| SDSS J1110+6459 | 11:10:18 | +64:59:47.02 | 2013 Jan 8 | 2420 | ⋯ | 2436 | ⋯ | ⋯ | 1112 | ⋯ | ⋯ | 1212 |
| SDSS J1115+1645 | 11:15:04 | +16:45:38.40 | 2013 Oct 28 | 2388 | ⋯ | ⋯ | ⋯ | 2400 | ⋯ | ⋯ | 1112 | 1212 |
| SDSS J1138+2754 | 11:38:09 | +27:54:30.90 | 2013 Mar 25 | 2384 | ⋯ | ⋯ | 2396 | ⋯ | ⋯ | ⋯ | 1112 | 1212 |
| SDSS J1152+0930 | 11:52:47 | +09:30:14.54 | 2013 May 17 | 2388 | ⋯ | 2400 | ⋯ | ⋯ | 1112 | ⋯ | ⋯ | 1212 |
| SDSS J1152+3313 | 11:52:00 | +33:13:41.72 | 2013 Jul 7 | ⋯ | 2380 | 2380 | ⋯ | ⋯ | ⋯ | 1112 | ⋯ | 1112 |
| SDSS J1156+1911 | 11:56:06 | +19:11:12.68 | 2012 Dec 4 | 2388 | ⋯ | ⋯ | ⋯ | 2400 | ⋯ | ⋯ | 1112 | 1212 |
| SDSS J1207+5254 | 12:07:36 | +52:54:58.20 | 2012 Nov 29 | 2400 | ⋯ | 2416 | ⋯ | ⋯ | 1112 | ⋯ | ⋯ | 1212 |
| SDSS J1209+2640 | 12:09:24 | +26:40:46.50 | 2013 May 5 | 2384 | ⋯ | ⋯ | ⋯ | ⋯ | 1112 | ⋯ | ⋯ | 1212 |
| SDSS J1329+2243 | 13:29:34 | +22:43:00.24 | 2013 May 16 | 2384 | ⋯ | 2400 | ⋯ | ⋯ | 1112 | ⋯ | ⋯ | 1212 |
| SDSS J1336−0331 | 13:36:00 | −03:31:28.63 | 2013 May 8 | 2388 | ⋯ | 2400 | ⋯ | ⋯ | ⋯ | ⋯ | 1112 | 1212 |
| SDSS J1343+4155 | 13:43:33 | +41:55:04.08 | 2013 Mar 13 | 2380 | ⋯ | ⋯ | ⋯ | ⋯ | 1112 | ⋯ | ⋯ | 1112 |
| SDSS J1420+3955 | 14:20:39 | +39:55:04.96 | 2013 Jan 17 | 2372 | ⋯ | 2388 | ⋯ | ⋯ | 1112 | ⋯ | ⋯ | 1112 |
| SDSS J1439+1208 | 14:39:10 | +12:08:24.75 | 2013 Jan 21 | 2384 | ⋯ | ⋯ | ⋯ | 2400 | ⋯ | ⋯ | 1112 | 1212 |
| SDSS J1456+5702 | 14:56:01 | +57:02:20.60 | 2013 Jan 10 | 2404 | ⋯ | ⋯ | ⋯ | 2424 | ⋯ | ⋯ | 1112 | 1212 |
| SDSS J1522+2535 | 15:22:53 | +25:35:29.36 | 2013 Jul 6 | 2384 | ⋯ | 2396 | ⋯ | ⋯ | 1112 | ⋯ | ⋯ | 1212 |
| SDSS J1527+0652 | 15:27:45 | +06:52:31.79 | 2013 Jan 16 | ⋯ | 2400 | 2400 | ⋯ | ⋯ | ⋯ | 1112 | ⋯ | 1212 |
| SDSS J1531+3414 | 15:31:11 | +34:14:24.91 | 2013 May 6 | 2256 | ⋯ | 1440 | ⋯ | 1964 | ⋯ | ⋯ | ⋯ | 912 |
| SDSS J1604+2244 | 16:04:10 | +22:44:16.69 | 2013 Jun 26 | 2384 | ⋯ | ⋯ | 2400 | ⋯ | ⋯ | 1112 | ⋯ | 1212 |
| SDSS J1621+0607 | 16:21:32 | +06:07:19.85 | 2013 Apr 29 | 2384 | ⋯ | ⋯ | 2400 | ⋯ | ⋯ | 1112 | ⋯ | 1212 |
| SDSS J1632+3500 | 16:32:10 | +35:00:30.16 | 2013 Oct 12 | 2372 | ⋯ | ⋯ | ⋯ | 2388 | ⋯ | 1112 | ⋯ | 1112 |
| SDSS J1723+3411 | 17:23:36 | +34:11:59.37 | 2013 Mar 14 | 2368 | ⋯ | ⋯ | 2380 | ⋯ | ⋯ | 1112 | ⋯ | 1112 |
| SDSS J2111−0114 | 21:11:19 | −01:14:23.57 | 2013 Jun 13 | 2388 | ⋯ | ⋯ | ⋯ | ⋯ | ⋯ | 1112 | ⋯ | 1212 |
| SDSS J2243−0935 | 22:43:23 | −09:35:21.40 | 2013 Aug 31 | 2388 | ⋯ | 2400 | ⋯ | ⋯ | 1112 | ⋯ | ⋯ | 1212 |
| Typical point-source limiting magnitude (5σ) | 26.39 | 26.38 | 26.11 | 25.65 | 25.49 | 25.85 | 26.17 | 25.81 | 25.66 | |||
| Limiting magnitude uncertainty | ±0.08 | ±0.03 | ±0.24 | ±0.23 | ±0.31 | ±0.22 | ±0.26 | ±0.31 | ±0.20 | |||
Note. Observing dates and exposure time of the clusters as part of HST program GO-13003. Columns 6 through 13 are the cumulative exposure times in each of the WFC3 filters, as labeled. Exposure times are in seconds. The limiting magnitudes are measured within a circular aperture of diameter 07.
Download table as: ASCIITypeset image
The GO-13003 observations were obtained with both the near-infrared (IR) and ultraviolet-visible (UVIS) channels of the WFC3 instrument (Kimble et al. 2008) in order to minimize overheads. The primary science objective of GO-13003 is to measure the physical properties of the lensed galaxies. To accommodate that, the filter choice for each cluster was driven by the redshift of the primary arc, rather than the cluster redshift, for a long baseline rest-frame wavelength coverage with broad filters for maximal throughput. Each target was observed with the reddest filter available; the F160W on the IR camera. On the blue side, all but two clusters were imaged with the F390W filter on UVIS. The two intermediate bands were chosen to straddle the 4000 Å break at the redshift of the primary arc.
The observations using the two IR filters were executed within the same orbit, and data taken with the UVIS filters were executed in a single orbit each, all within one visit. In all cases, observations were split into four sub-exposures with sub-pixel dithers. The number of sub-exposures was found to be the minimum needed to sample the point-spread function (PSF), cover the chip gap, and enable removal of cosmic rays and other artifacts, while keeping to a minimum the readout noise and losses due to charge transfer efficiency (CTE). Targets were centered on the center of Chip 1 (UVIS) and with a channel pointing offset of +235 (IR) to optimally overlap the two fields of view, and avoid placing the center of the cluster on the chip gap. Where the visibility window allowed, we selected orientation angles that place the main arc in each cluster close to the readout side of the UVIS chip in order to minimize CTE losses in our primary science targets.
In the UVIS channel, the declining CTE of the detector can cause large flux losses and increases the correlated noise in the image. To mitigate, the bluest UVIS data were taken with post-flash, to increase the image background and ensure that faint sources have high enough counts (see WFC3 Data Handbook, Rajan 2010). Post-observation image corrections were applied to individual exposures using the Pixel-based Empirical CTE Correction Software17 provided by STScI.
The WFC3-IR observations were executed within a single orbit using a sampling interval parameter SPARS25, four images per filter with small box dithers for PSF reconstruction and to cover artifacts such as the “IR Blobs” and “Death Star” (WFC3 Data Handbook; Rajan 2010). We used a custom algorithm for a secondary correction of IR blobs that were not fully accounted for in the reduction pipeline of the WFC3-IR images as follows. We generated a superflat image from all the IR imaging in our program, and constructed an empirical model of the IR blobs using GALFIT (Peng et al. 2010). The IR blobs were then suppressed from individual exposures prior to drizzling, by dividing the data by the scaled model in a process similar to flat-fielding.
Individual corrected IR and UVIS images were combined using the AstroDrizzle package (Gonzaga et al. 2012) with a pixel scale of 003 pixel−1, and drop size of 0.5 for the IR filters and 0.8 for the UVIS filters. We find that this approach provides good recovery of the PSF in all bands and maximizes the sensitivity to low signal-to-noise features such as faint lensed galaxies. Finally, all images were drizzled onto the same pixel frame.
The typical point-source 5σ magnitude limits of the entire survey are given in Table 1. We estimate the depth in each filter by randomly placing circular apertures with a diameter of 07 across the PSF-matched images. We eliminate apertures that overlap with objects, and extract from the remaining background apertures the mean and standard deviation of the noise distribution for each field and filter. We next consider the distribution of depths for each filter. While the observing strategy was similar for most observations, different fields show some variation in their achieved depth, which is quantified as the standard deviation of the distribution (listed in Table 1).
3.2. Spectroscopy
Several different programs conducted spectroscopy of SGAS fields, using multiple observatories, with the science goal determining the observation strategy. These follow-up programs generally fall under two categories. The first type of programs includes multi-object spectroscopy using either a fiber-fed spectrograph or slit masks with multiple slits or slitlets placed primarily on arc candidates and cluster galaxies. Some of the results from these programs are published in Bayliss et al. (2011b, 2014a). With these observations, we secured new spectroscopic redshifts of lensed sources, and informed lens models and statistical analysis of the lensing cross section; spectroscopy of cluster-member galaxies were used to study the dynamical properties of the lensing clusters. The second type of spectroscopic program collects deep, high spectral resolution spectroscopy of individual lensed galaxies in order to study their physical properties, leveraging the high magnification by the foreground cluster (e.g., Wuyts et al. 2012a, 2012b; Bayliss et al. 2014b; Rigby et al. 2014, 2015, 2018a; M. Akhshik et al. 2020, in preparation; M. K. Florian et al. 2020, in preparation). Where available, we use results from these programs.
In this paper, we present new spectroscopic redshifts from Gemini and Magellan multi-slit spectroscopic programs. The primary goal of these programs was securing spectroscopic redshifts of secondary arcs in SGAS-HST fields. By construction of the HST target list, the primary arcs in each field already had secure spectroscopic redshifts. The secondary arcs have either not been identified prior to the HST observations, or previous attempts with Magellan or Gemini were unsuccessful at yielding redshifts. Spectroscopic redshifts of secondary arcs are critical for an accurate lens model, as the slope of the mass profile is degenerate with the distance of the lensed galaxies used as constraints. Redshifts of multiple source planes help break this degeneracy (e.g., Smith et al. 2009; Johnson & Sharon 2016). The secondary arcs are typically fainter than the primary arcs in each field. We therefore planned the observations to have longer exposures than previous SGAS programs (Bayliss et al. 2011b, 2014a). The observing strategy was optimized for securing spectroscopic redshifts of the background galaxies. Multi-object slit masks primarily targeted the lensing features around the cluster core. We placed additional slits on cluster-member galaxies and other objects of interest. The filters and gratings were selected to provide maximal wavelength coverage, to increase the redshift range in which redshifted emission lines can be observed.
Table 2 lists for each cluster the best available spectroscopic redshift, from the new observations described here, supplemented with information from previous programs including Bayliss et al. (2011b, 2014a), public databases (e.g., SDSS), and the literature. Where spectroscopic redshifts are available for several cluster-member galaxies, we define the cluster redshift as the mean redshift of these galaxies. Otherwise, the redshift of the cluster is assumed to be the redshift of the brightest cluster galaxy (BCG). In our lensing analysis, the redshift of each cluster is taken to be known exactly without errors; the uncertainty has a negligible effect on the lensing analysis.
Table 2. Cluster Properties
| Cluster | Redshift | σv | Nspec | M200 | Spectroscopy Reference | θE(zs = 2) | |
|---|---|---|---|---|---|---|---|
| (km s−1) | (1014 ) ) |
″ | |||||
| 1 | SDSS J0004−0103 | 0.514 ± 0.003 | 556 ± 178 | 9 | 1.5
|
Carrasco+17 | 3.9 |
| 2 | SDSS J0108+0624 | 0.5478 ± 0.0002 | ⋯ | 1 | ⋯ | SDSS DR12 BCG | 2.3 |
| 3 | SDSS J0146−0929 | 0.4469 ± 0.00006 | ⋯ | 1 | ⋯ | SDSS DR12 BCG | 12.4 |
| 4 | SDSS J0150+2725 | 0.30619 ± 0.00005 | ⋯ | 1 | ⋯ | SDSS DR12 BCG | 12 |
| 5 | SDSS J0333−0651 | 0.5729 ± 0.0006 | ⋯ | 1 | ⋯ | BCG spectrum from APO/DIS | 9.6 |
| 6 | SDSS J0851+3331 | 0.3689 ± 0.0007 | 890 ± 130 | 41 | 6.6
|
Bayliss+14 | 16.4 |
| 7 | SDSS J0915+3826 | 0.3961 ± 0.0008 | 960 ± 120 | 39 | 8.1
|
Bayliss+14 | 16.3 |
| 8 | SDSS J0928+2031 | 0.192 ± 0.0009 | 965 ± 209 | 19 | 9.2
|
This work: GMOS, SDSS DR12 | 10.6 |
| 9 | SDSS J0952+3434 | 0.357 ± 0.003 | 706 ± 214 | 10 | 3.3
|
This work: GMOS, SDSS DR12 | 10.9 |
| 10 | SDSS J0957+0509 | 0.4482 ± 0.001 | 1250 ± 290 | 25 | 17.3
|
Bayliss+14 | 6.1 |
| 11 | SDSS J1002+2031 | 0.319 ± 0.006 | 1110 ± 170 | 37 | 13.0
|
This work: GMOS, SDSS DR12 | ⋯ |
| 12 | SDSS J1038+4849 | 0.4308 ± 0.0003 | 659 ± 69 | 48 | 2.6
|
Irwin+15,Bayliss+14 | 10.4 |
| 13 | SDSS J1050+0017 | 0.5931 ± 0.0008 | 560 ± 80 | 32 | 1.5
|
Bayliss+14 | 15.4 |
| 14 | SDSS J1055+5547 | 0.466 ± 0.003 | 678 ± 220 | 13 | 2.8
|
Bayliss+11 | 18.4 |
| 15 | SDSS J1110+6459 | 0.656 ± 0.006 | 1022 ± 226 | 18 | 8.4
|
Johnson+17 | 10.1 |
| 16 | SDSS J1115+1645 | 0.537 | ⋯ | 1 | ⋯ | BCG spec Stark+13 | 8.6 |
| 17 | SDSS J1138+2754 | 0.451 ± 0.008 | 1597 ± 380 | 11 | 35.7
|
Bayliss+11 | 15.6 |
| 18 | SDSS J1152+0930 | 0.517 ± 0.009 | 1360 ± 320 | 6 | 21.3
|
Bayliss+11 | 6.6 |
| 19 | SDSS J1152+3313 | 0.3612 ± 0.0007 | 800 ± 90 | 38 | 4.8
|
Bayliss+14 | 7.3 |
| 20 | SDSS J1156+1911 | 0.54547 ± 0.00013 | ⋯ | 1 | ⋯ | SDSS DR12 BCG | 6.7 |
| 21 | SDSS J1207+5254 | 0.275 ± 0.003 | 790 ± 410 | 4 | 4.9
|
SDSS DR12, Kubo+10 | 6.7 |
| 22 | SDSS J1209+2640 | 0.5606 ± 0.0012 | 1155 ± 217 | 25 | 12.8
|
This work, Bayliss+11 | 22.7 |
| 23 | SDSS J1329+2243 | 0.4427 ± 0.0007 | 830 ± 120 | 31 | 5.1
|
Bayliss+14 | 9.3 |
| 24 | SDSS J1336−0331 | 0.17637 ± 0.00003 | ⋯ | 1 | ⋯ | SDSS DR12 BCG | 12.1 |
| 25 | SDSS J1343+4155 | 0.418 ± 0.006 | 1011 ± 290 | 7 | 9.3
|
Bayliss+11 | 7.9 |
| 26 | SDSS J1420+3955 | 0.607 ± 0.006 | 1095 ± 175 | 13 | 10.6
|
Bayliss+11 | 16.7 |
| 27 | SDSS J1439+1208 | 0.42734 ± 0.00013 | ⋯ | 1 | ⋯ | SDSS DR12 BCG | 17.6 |
| 28 | SDSS J1456+5702 | 0.484 ± 0.009 | 1536 ± 320 | 10 | 31.2
|
Bayliss+11 | 13 |
| 29 | SDSS J1522+2535 | 0.602 ± 0.006 | 1187 ± 300 | 14 | 13.5
|
This work: GMOS, SDSS DR12 | 13.3 |
| 30 | SDSS J1527+0652 | 0.392 ± 0.005 | 923 ± 233 | 14 | 7.2
|
Bayliss+11 | 1.4 |
| 31 | SDSS J1531+3414 | 0.335 ± 0.005 | 998 ± 190 | 11 | 9.4
|
Bayliss+11 | 17.7 |
| 32 | SDSS J1604+2244 | 0.286 ± 0.004 | 1042 ± 335 | 9 | 11.0
|
This work: GMOS, SDSS DR12 | 10.9 |
| 33 | SDSS J1621+0607 | 0.3429 ± 0.0005 | 721 ± 97 | 48 | 3.6
|
This work, Bayliss+11 | 10.8 |
| 34 | SDSS J1632+3500 | 0.466 ± 0.006 | 1212 ± 350 | 11 | 15.6
|
This work: GMOS, SDSS DR12 | 14.3 |
| 35 | SDSS J1723+3411 | 0.44227 ± 0.00009 | ⋯ | 1 | ⋯ | SDSS DR12 BCG | 6.8 |
| 36 | SDSS J2111−0114 | 0.6363 ± 0.0009 | 1090 ± 146 | 48 | 10.3
|
Bayliss+11, Carrasco+17 | 5.7 |
| 37 | SDSS J2243−0935 | 0.447 ± 0.005 | 996 ± 200 | 20 | 8.8
|
Bayliss+11 | 23.1 |
Note. Spectroscopic redshifts, velocity dispersions, masses, and Einstein radii for the SGAS-HST lensing clusters.  is the number of unique cluster-member galaxies with spectroscopic redshifts that were used to compute the velocity dispersion. We used the Gapper estimator for clusters with
  and the bi-weight sample variance otherwise (see Section 3.2). M200 masses were calculated from the velocity dispersions based on the scaling relations found by Evrard et al. (2008). References for spectroscopic redshift measurements of cluster galaxies are as follows: Carrasco et al. (2017), Bayliss et al. (2011b, 2014b), Irwin et al. (2015), Johnson et al. (2017b), Kubo et al. (2010), Stark et al. (2013). The last column lists the effective Einstein radii (
 ) for a source at redshift zs = 2, from the best-fit lens model derived by this work. θE is calculated as
  where A is the area enclosed by the tangential critical curve.
Download table as: ASCIITypeset image
The velocity dispersion of each cluster is measured from all available spectroscopic redshifts. For clusters with a small number of galaxies with spectroscopic redshifts, Nspec < 15, we use the Gapper estimator (Beers et al. 1990). Otherwise, we use the square root of the bi-weight sample variance (Beers et al. 1990; Ruel et al. 2014). The uncertainties on the velocity dispersion are calculated as  , following Ruel et al. (2014). The velocity dispersions are listed in Table 2.
The dynamical masses are given for reference, and are calculated from the velocity dispersions based on the scaling relations found by Evrard et al. (2008).
3.2.1. Gemini/GMOS-North Spectroscopy
Spectroscopic observations of SGAS clusters were obtained using the Gemini North telescope as part of programs GN-2015A-Q-38 (PI: Sharon) and GN-2015B-Q-26 (PI: Sharon) using the Gemini Multi-Object Spectrograph (GMOS; Hook et al. 2004).
All Gemini/GMOS-North observations were conducted in queue mode using the R400_G5305 grating in first order and the G515_G0306 long pass filter. Table 3 lists the observation dates and exposure times for the clusters that were targeted in these programs. We designed one multi-object slit mask for each cluster, placing slits on the high priority secondary arcs in each cluster for which spectroscopic redshifts had not been previously measured. Other slits were placed on cluster galaxies, selected by their color relative to the cluster red sequence.
Table 3. Summary of Spectroscopic Observations
| Cluster | Telescope/Instrument | UT Date | Exposure Time | Program ID |
|---|---|---|---|---|
| SDSS J0851+3331 | Gemini/GMOS-North | 2015 Apr 18 | 2 × 2400 s | GN-2015A-Q-38 |
| SDSS J0928+2031 | Gemini/GMOS-North | 2015 Apr 18,19 | 2 × 2400 s | GN-2015A-Q-38 |
| SDSS J0952+3434 | Gemini/GMOS-North | 2015 Oct 23, 2016 Jan 3 | 2 × 2880 s | GN-2015B-Q-26 |
| SDSS J1002+2031 | Gemini/GMOS-North | 2016 Jan 4, 7 | 2 × 2880 s | GN-2015B-Q-26 |
| SDSS J1002+2031 | Gemini/GMOS-North | 2011 May 22 | 2 × 2400 s | GN-2011A-Q-19 |
| SDSS J1110+6459 | Gemini/GMOS-North | 2016 Jan 8 | 2 × 2880 s | GN-2015B-Q-26 |
| SDSS J1207+5254 | Gemini/GMOS-North | 2016 Feb 4 | 2 × 2880 s | GN-2015B-Q-26 |
| SDSS J1209+2640 | Gemini/GMOS-North | 2016 Feb 9 | 2 × 2880 s | GN-2015B-Q-26 |
| SDSS J1329+2243 | Gemini/GMOS-North | 2011 Jun 2 | 2 × 2400 s | GN-2011A-Q-19 |
| SDSS J1604+2244 | Gemini/GMOS-North | 2011 Apr 29 | 2 × 2400 s | GN-2011A-Q-19 |
| SDSS J1632+3500 | Gemini/GMOS-North | 2012 Apr 15 | 2 × 2400 s | GN-2011A-Q-19 |
| SDSS J0146−0929 | Magellan/IMACS MOS | 2013 Nov 6 | 3 × 2400 s | ⋯ |
| SDSS J0150+2725 | Magellan/IMACS MOS | 2013 Mar 16 | 6 × 2400 s (2 masks) | ⋯ |
| SDSS J1152+0930 | Magellan/IMACS MOS | 2014 Apr 24, 25, 26 | 10 × 2400 s (2 masks) | ⋯ |
| SDSS J1336−0331 | Magellan/IMACS MOS | 2013 Jul 11, 2014 Apr 24 | 10 × 2400 s (2 masks) | ⋯ |
| SDSS J1336−0331 | Magellan/LDSS3 long-slit | 2013 May 2 | 2400 s | ⋯ |
| SDSS J1439+1208 | Magellan/IMACS MOS | 2014 Apr 26 | 2 × 2400+3300 s | ⋯ |
| SDSS J1439+1208 | Magellan/IMACS long-slit | 2013 Mar 17 | 2 × 1200 s | ⋯ |
| SDSS J1621+0607 | Magellan/IMACS MOS | 2013 Aug 3 | 3 × 2400 s | ⋯ |
| 2014 Apr 24, 25, 26 | 2 × 3000, 2 × 2880, 2 × 2700 s | ⋯ | ||
| SDSS J1621+0607 | Magellan/LDSS3 long-slit | 2013 May 2 | 1800+2400 s | ⋯ |
| SDSS J2111−0114 | Magellan/IMACS MOS | 2013 Aug 2, 3, 2014 Apr 24,25 | 2 × 3600, 6 × 2400 s | ⋯ |
| SDSS J2243−0935 | Magellan/IMACS MOS | 2013 Jul 11, 2013 Nov 6, 7 | 4 × 2400 s | ⋯ |
| SDSS J0333−0651 | Magellan/FIRE | 2013 Mar 1 | 2400 s | ⋯ |
| SDSS J0928+2031 | Magellan/FIRE | 2013 Feb 28 | 2400 s | ⋯ |
| SDSS J1439+1208 | Magellan/FIRE | 2013 Feb 28 | 9600 s | ⋯ |
| SDSS J0108+0624 | APO/DIS | 2012 Jan 20 | 2 × 1200 s | ⋯ |
| SDSS J0150+2725 | APO/DIS | 2012 Jan 20 | 2 × 3000 s | ⋯ |
| SDSS J1456+5702 | MMT/Blue Channel | 2014 May 4 | 2 × 1200 s | ⋯ |
Note. Spectroscopic observation dates and exposure times. UT date lists the date or dates of the observation. Number of exposures and integration time of each exposure are listed in the fourth column. Magellan observations are typically split over two or more sub-exposures. Program ID lists the proposal identifier in the Gemini archive.
Download table as: ASCIITypeset image
We also report redshifts from program GN-2011A-Q-11 (PI: Gladders) of primary arcs and cluster members that were not published elsewhere. Those observations, as well as the data reduction procedures of the GMOS data, are described in Bayliss et al. (2014a).
3.2.2. Magellan Spectroscopy
We followed up clusters that are observable from the south, with decl. <20°, with the Magellan 6.5 m telescopes at Las Campanas Observatory, Chile. As with the Gemini observations described in the previous section, we obtained spectra of secondary arcs that were identified in the HST data, and not targeted by Bayliss et al. (2011b). We observed eight cluster fields with the Inamori-Magellan Areal Camera & Spectrograph (IMACS) on the Baade telescope, using multi-slit spectroscopy. We designed one or two masks per field, placing 10 slitlets on the lensed galaxies at highest priority, and filling the rest of the 27
2 × 27
2 field of view with cluster-member galaxies and other sources. We observed one cluster field with 1
0 long-slit. Observations were typically several exposures of 2400 s each.
We report redshifts in two cluster fields that we observed with the Low Dispersion Survey Spectrograph 3 (LDSS3) camera on the Clay telescope using either the 10 or 1
5 long slit.
We report new redshift measurements in three fields: SDSS J0333−0651, SDSS J0928+2031, and SDSS J1439+1208, using the Folded-port InfraRed Echellette (FIRE) on the Baade telescope. The observations took place on 2013 March 1 with clear weather conditions and 07 seeing. We used the Eschelle disperser with 1
0 slit, typically integrating for 40 minutes.
3.2.3. Apache Point Observatory Spectroscopy
Observations with the Dual Imaging Spectrograph (DIS) on the 3.5 m telescope at Apache Point Observatory (APO) on 2012 January 20 were used to measure the redshifts of two arcs in this paper. The observation strategy and data reduction procedures are identical to those detailed in Bayliss (2012).
3.2.4. Multiple Mirror Telescope Observatory Spectroscopy
Observations with the 6.5 m Multiple Mirror Telescope (MMT) using the Blue Channel spectrograph were obtained on 2014 May 4 (PI: Bayliss) for one of the targets in this paper, the giant arc in SDSS J1456+5702. We used the 500 line grating in first order, tilted to set the central wavelength to 5575 Å, using the 125 wide long-slit aperture at a position angle (PA) of 87
3 east of north. The source was at airmasses between 1.18 and 1.38 during the science exposures, and conditions remained clear with consistently subarcsecond seeing. The science frames were followed by HeNeAr arc lamp wavelength calibration frames and quarts lamp flat calibration frames taken at the same PA. We bias-subtracted, flat-field corrected, and wavelength calibrated the data with standard IRAF routines in the iraf.noao.imred.ccdred and iraf.noao.onedspec packages. We then used custom IDL code built using the XIDL package to subtract a two-dimensional model of the sky on a pixel-by-pixel basis. The science spectrum was boxcar extracted to capture from the full extended object profile of the giant arc along the slit, using a 3″ wide aperture. The final combined spectrum covers a range in in wavelength of ∼4000–7175 Å, with a dispersion of 1.19 Å per pixel and a median spectral resolution, R = δλ/λ ≃ 1150.
4. Strong-lensing Analysis
We compute strong-lensing models using the public software Lenstool (Jullo et al. 2007). Lenstool assumes a “parametric” solution to describe the mass distribution, and solves for the best-fit set of parameters using Markov Chain Monte Carlo (MCMC) sampling of the parameter space. The best-fit model is defined as the one that results in the smallest scatter between observed and model-predicted image positions in the image plane.
We model each cluster as a linear combination of mass halos, representing the dark matter mass distribution attributed to the cluster and to correlated large scale structure, and individual cluster galaxies. The halos are modeled as pseudo-isothermal ellipsoidal mass distribution (PIEMD, also known as dPIE; Jullo et al. 2007), with seven parameters: position x, y; ellipticity e; position angle θ; core radius rcore; cut radius rcut; and a normalization σ0. We note that σ0, the effective velocity dispersion, is correlated with, but not identical to, the observed velocity dispersion of the mass halo. The relation to the observed velocity dispersion, σv, can be found in Elíasdóttir et al. (2007) for the PIEMD potential. The two mass slope parameters, rcore and rcut, define an intermediate region rcore ≲ r ≲ rcut within which the mass distribution is isothermal; the potential transitions smoothly to a flat profile toward r = 0, and asymptotes to zero at large radii.
The normalization and radii parameters of the galaxy-scale halos are scaled to their observed luminosity (see Limousin et al. 2005 for a description of the scaling relations). The positional parameters (x, y, e, θ) are fixed to their observed measurements, as measured with Source Extractor (Bertin & Arnouts 1996).
Unless noted otherwise, all the parameters of cluster-scale halos are allowed to vary, with the exception of rcut, which is far outside the strong-lensing region and thus cannot be constrained by the lensing evidence. We therefore fix this parameter at 1500 kpc.
We estimate the statistical uncertainties on individual model parameters from the MCMC sampling of the parameter space. These uncertainties do not include systematic uncertainties due to modeling choices, structure along the line of sight, or correlated structure and substructure, which have been shown to cause systematic uncertainties (e.g., Zitrin et al. 2015; Acebron et al. 2017; Johnson et al. 2017b; Meneghetti et al. 2017; Priewe et al. 2017; Cerny et al. 2018). From the lensing potential we compute the mass distribution, convergence, shear, magnification, and deflection maps. We refer the reader to Johnson et al. (2014) for a concise description of these derivatives, and their dependence on the cluster and source distances. We estimate the statistical uncertainties of these lensing outputs by computing a suite of models sampled from the MCMC chain.
4.1. Identification of Cluster Galaxies
Cluster members are identified as forming a tight ridge in color–magnitude diagrams, often referred to as “red sequence” (e.g., Gladders & Yee 2000; Koester et al. 2007). The color of the red sequence depends on the cluster redshift and the selection of filters. We note that some fraction of the galaxy population is not quiescent (Butcher & Oemler 1978, 1984), and thus the red-sequence method forms an incomplete cluster-member selection. However, this fraction decreases significantly in the inner 1 Mpc (e.g., Fairley et al. 2002; Bai et al. 2007; Loh et al. 2008; Porter et al. 2008; Saintonge et al. 2008; Hansen et al. 2009). In cases where the lensing signal is clearly affected by individual galaxies, even when they are not on the red sequence, we include these galaxies in the model.
4.2. Lensed Sources
The SGAS clusters were selected based on visual inspection of SDSS images of lines of sight toward galaxy clusters. Therefore, by construction of the sample, each cluster has at least one bright arc detectable with shallow ground-based imaging. Deeper follow-up provided a multitude of fainter arc candidates, some of which were confirmed by spectroscopy (Bayliss et al. 2011b). In optical bands, the depth of the HST imaging does not exceed that of the ground data; however, the excellent resolution allows us, in most cases, to unambiguously identify multiple images, detect substructure in extended arcs, and discriminate among arc candidates. The deep HST near-IR imaging provides wide wavelength coverage with a lever arm on color variance, and a window to the high-redshift universe as well as highly extinguished star-forming galaxies. In discovering new arc candidates, we are often assisted by the preliminary lens model, which is based on the primary arc and other known lensed galaxies. The initial model is often successful in predicting the approximate location of possible counter-images. This is typical for lens models that assume some form of correlation between the mass distribution and the light of cluster galaxies (e.g., Broadhurst et al. 2005). We note that this process of using an initial model to aid in the discovery of new arcs is not limited to mass-follows-light models; fully parametric models such as Lenstool can provide good initial guesses. Following the recommendations of Johnson & Sharon (2016), each time a lensed source was spectroscopically confirmed, we reassessed any images with no spectroscopic confirmation that have been predicted by the lens model before adding them back in as lensing constraints.
In some cases, we use information from photometric redshift analysis of lensed galaxies as a prior. Photometric redshifts were derived using the EAzY code (Brammer et al. 2008), which fits linear combinations of seven templates to the broadband spectral energy distributions that span a broad range of galaxy colors while minimizing color and redshift degeneracies. A K-band apparent magnitude prior and systematic errors due to template mismatch are taken into account, following (Whitaker et al. 2011).
Owing to the superior resolution of HST and the broader wavelength coverage compared to the previous ground-based data, we discovered new arc candidates in most of the cluster fields. These are presented in Tables 4–10, with coordinates, IDs, and where available, spectroscopic or photometric redshifts.
4.3. Lensing Analysis of Individual Clusters
In this section, we provide details on the identification of lensed sources and modeling choices for each cluster in this HST program. The ability to construct a unique, high-fidelity, lens model varies from cluster to cluster, and is dominated by the availability of lensing constraints, availability of spectroscopic redshifts, and other factors that are less straightforward to quantify such as the distribution of lensing constraints in the field of view. Numerical estimators that are often used for assessing models, such as χ2, reduced χ2, and rms, may be good indicators of the statistical errors in the parameter space, but do not necessarily encompass the full uncertainty (e.g., Johnson & Sharon 2016; Cerny et al. 2018). We therefore resort to providing a subjective assessment of the reliability of each model as a well-understood cosmic telescope. We rate the lens models in three broad categories: Category A denotes a high-quality, robust model, whose magnification is relatively well constrained; in category B we place acceptable models, with somewhat higher systematic uncertainties; and C denotes poor models, that are underconstrained. Models that fall at the top or bottom of these quality bins are denoted with + or −, respectively. We indicate below the caveats and point to sources of uncertainty for individual cluster models if they significantly reduce the reliability of the model, i.e., fall in category B or C.
Tables 4–10 list the lensing constraints in each field, which are described in the subsections below. We tabulate the IDs, coordinates, and redshifts of the lensed galaxies, as well as individual emission knots within the lensed galaxies that were used as constraints. The IDs appear as AB.X where A is a number or a letter indicating the source ID (or system name); for images with identified substructure, B is a number or a letter indicating the ID of the emission knot within the system; and X is a number indicating the ID of the lensed image within the multiple-image family. For example, 1a.3 would be the third image of emission knot a in system #1. Images without clearly identified substructure would appear as A.X. In a few cases, we retain the naming systems that were used in previous publications.
In Figures 1 through 7, we present the 37 clusters in this program. The images are rendered from three of the HST bands as noted in the bottom-left corner of each panel. The clusters are shown in order of R.A., and their names are shown on the top left. The field of view of each panel is selected in order to best show the strong-lensing region; we plot a 5″ scale bar at the bottom-right corner of each panel. The critical curves are overplotted in red, representing the loci of maximum magnification for a source at redshift z, as indicated in the bottom left of each panel. We plot the locations of the observed lensed galaxies. Each family is labeled in the same color; for clarity, we do not label multiple knots within the lensed images; they are given in Tables 4–10. Finally, spectroscopic redshifts are listed at the top-right corner of each panel, with the same color code. For completeness, we list spectroscopic redshifts of sources even if they fall outside of the field of view of the panel.
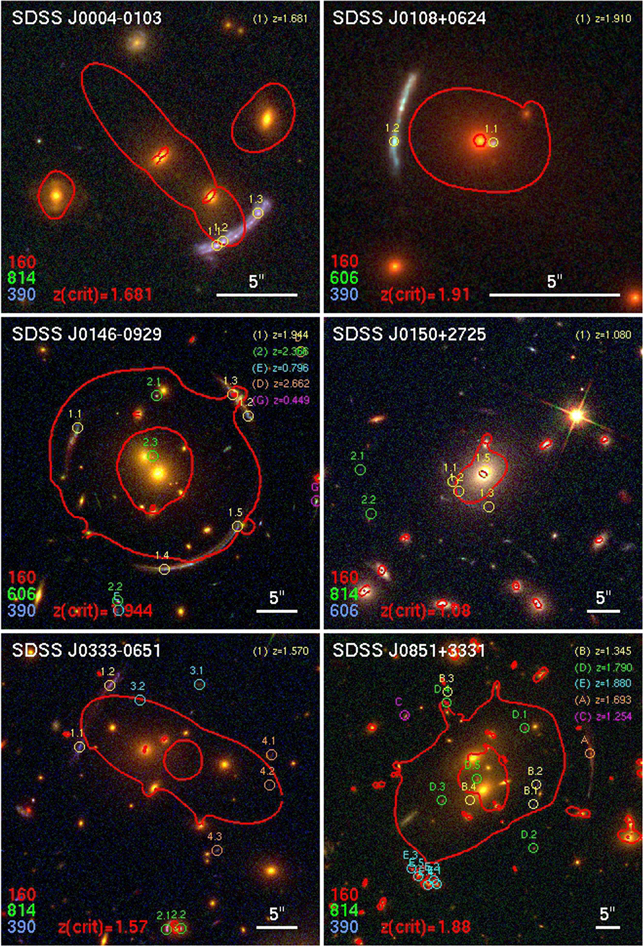
Figure 1. Composite color images of the SGAS-HST clusters SDSS J0004−0103, SDSS J0108+0624, SDSS J0146−0929, SDSS J0150+2725, SDSS J0333−0651, and SDSS J0851+3331. North is up and east is left in all panels. The images are from the HST bands that best show the lensed galaxies, with the filters noted in the bottom-left corner of each panel. The coordinates, redshifts, and references are tabulated in Table 4.
Download figure:
Standard image High-resolution image4.3.1. SDSS J0004−0103
The HST imaging confirms the bright arc that was previously discovered in ground-based data. The HST resolution reveals the clumpy morphology of this arc. We identify several distinct emission knots, and determine that the arc consists of three merging partial images of the background source. We use individual emission clumps as lensing constraints. The cluster itself is diffuse, with no obvious dominant galaxy at its core. We use the Gapper estimator to calcuate the velocity dispersion from spectroscopic redshifts of nine cluster galaxies measured by Carrasco et al. (2017), σv = 556 ± 178 km s−1. This velocity dispersion is consistent with a small group rather than a rich cluster. We use the velocity dispersion as an upper limit on the lensing mass distribution when computing the lens model.
Due to the limited lensing constraints and the uncertainty of where the cluster center is, the lens model is not unique and has large systematic uncertainty. We rank its fidelity for predicting the magnification anywhere in the field and its ability to constrain the mass distribution as C (poor, underconstrained). At the same time, the model is successful at reconstructing the morphology and geometry of the lensed source and explaining the lensing configuration, and can be used to place limits on the magnification of the lensed galaxy.
4.3.2. SDSS J0108+0624
We confirm the identification of one bright arc, at a projected angular distance 33 from the BCG, at
 = 1.91 (Rigby et al. 2018b). The HST data reveal a demagnified counter image separated 0
52 from the BCG. We also identify several bright emission knots, color variation along the magnified arc, and clumpy morphology in both images, which helps constrain the lens model. No additional lensed galaxies were identified. The internal morphology and color variation along the giant arc indicate that this is a system of two images, with the giant arc being one complete image of the source, and the demagnified central image the second image. A third image is predicted behind the central cluster galaxy. We observe faint F390W emission at this location. However, as some of the other cluster members show faint emission in this filter at their centers as well, the data cannot rule out that this emission is coming from the central cluster galaxy. This model is not as well constrained as others in this sample, as the constraints come from a single lensed galaxy with only two images. Since the lens is dominated by a central galaxy and the identification of the central image provides a good constraint on the center of the lens, the model is of sufficient fidelity for measuring the mass distribution in the core. However, we place it in category B due to the high uncertainty on the lensing magnification.
4.3.3. SDSS J0146−0929
The primary source lensed by SDSS J0146−0929 appears as an incomplete Einstein ring around the BCG, with a mean projected radius of 121. The HST resolution reveals morphology and color variation along the lensed galaxy. We identify image 1.1 (northeast of the BCG) to be a complete image of the source. The arc that appears to the south of the BCG is a merging pair of two partial images of the source, which we label 1.4 and 1.5. The arc northwest of the BCG is affected by the lensing potential of two interloper galaxies, likely cluster members, leading to a complex critical curve at this location and breaking up this arc into two partial images 1.2 and 1.3 (the “main” arc) and additional partial images buried in the light of the interlopers. We use several emission clumps in the source as constraints. The spectroscopic redshift of this galaxy was reported by Stark et al. (2013). We identify and spectroscopically confirm a second lensed galaxy with two secure images, 2.1 and 2.2. One image was predicted by the lens model near the center of the cluster. We identify a likely candidate, but it is not used as a constraint.
We obtained multi-slit spectroscopy from Magellan on 2013 Nov 6, using IMACS on the Baade telescope (Table 11). From these data, we measured the redshift of source #2,  = 2.366, from [C iii] 1907, C iii] 1909 Å. The other background sources with spectroscopic redshifts that are listed in Table 11 are likely not strongly lensed (i.e., we do not expect them to have counter-images). The model is well represented by a central cluster-scale halo and cluster-member galaxies. We leave the slope parameters of the two galaxies near the northwest arc as free parameters, and fix their positional parameters to their observed values. The lens model is well constrained, and we classify it in category A.
4.3.4. SDSS J0150+2725
The main arc in this field is a low surface brightness galaxy at  = 1.08, measured from the [O ii] 3727, 3729 Å line in spectroscopy from the 3.5 m telescope at the APO, obtained on 2012 January 20, with the APO/DIS instrument. Although some candidates were suggested from ground data, a careful inspection of the HST images shows that their morphology or color are not the same and thus we rule them out as strongly lensed systems. We identify a counter image of the giant arc very close to the central galaxies, embedded in the BCG light. However, the distinct blue color of this galaxy gives it a high contrast against the cluster galaxies, which are mostly dropped out of our bluest band (F390W). We also identify two faint images of a candidate lensed galaxy. A third image is predicted, but would be less magnified and fall under our detection limit. The lensing constraints are sufficient for a robust model, however, due to the lack of spectroscopic redshift for source #2 the slope of the mass distribution is not well constrained. We therefore classify the model in category B (acceptable with higher uncertainty).
4.3.5. SDSS J0333−0651
The giant arc in this field, source # 1 at  = 1.57, was spectroscopically confirmed with Magellan/FIRE observation obtained on 2013 March 1. It is likely a single, highly distorted and flexured lensed galaxy. It appears resolved in the HST data; however, its substructure and color variation do not show lensing symmetry. We identify one secure lensed source, likely a galaxy–galaxy lensing event forming a partial Einstein ring around an elliptical galaxy 22
2 south of the BCG (close to the bottom of Figure 1). We have no spectroscopic data for this source. We further identify two other candidate lensed systems, labeled 3 and 4.
Due to the limited strong-lensing constraints, the lens model for this cluster is less robust than other clusters in our program. We therefore classify it as B+. Spectroscopic redshifts of sources #3 and #4 would strengthen the model, as well as deeper observations to identify additional (fainter) images that are expected to occur for system #3. Alternatively, if no further constraints are revealed, future analysis may use the flexion (curved distortion due to the third derivatives of the lensing potential) of the main arc as a constraint to improve the fidelity of the model (e.g., Cain et al. 2016). Flexion constraints are currently not implemented in the lens-modeling algorithm we use.
4.3.6. SDSS J0851+3331
This cluster lenses a few background sources, some of which were identified by Bayliss et al. (2011b). Source A at zspec = 1.6926 (Bayliss et al. 2011b, labeled A1 and A2), appears as a highly stretched and flexured arc, with significant color gradient, and is a single image. The two images of source B that were identified and measured by Bayliss et al. (2011b), labeled B.1, B.2 at  = 1.3454, have matching morphology in the HST imaging, with the expected lensing symmetry. We identify two new counter-images for this source, B.3 and B.4, for a total of four images of the lensed source. Source C is a single image. We identify two new lensed systems in the HST data: source D has five images around the center of the cluster, with spectroscopic redshift zspec = 1.79, measured from HST-WFC3-IR grism spectroscopy with HST (GO-14622, PI: Whitaker). Source E has four secure images, and is brightest in the infrared bands. The lensing configuration of the images of source E is dominated by two cluster galaxies ∼20″ south of the BCG. A candidate partial fifth image is identified. This source was the science target of GO-14622, which measured a spectroscopic redshift zspec = 1.88, confirming the photometric redshift that we initially inferred based on Spitzer observations and the HST data presented here. An analysis of this source will be presented in a forthcoming publication (M. Akhshik et al. 2020, in preparation). Given the number, quality, and distribution of constraints, the model is of high fidelity, and we classify it in category A.
4.3.7. SDSS J0915+3826
This cluster was previously modeled by Bayliss et al. (2010) based on ground-based data. That work identified two lensed sources, and measured their redshifts: source A at  = 1.501 and source B, a Lyα-emitting galaxy at
  = 5.2. Our new HST imaging confirm the interpretation of these images as lensed galaxies. Furthermore, with the HST resolution we pin down the lensing morphology of the giant arc and determine that it is made of three merging images of the source galaxy. Several emission knots are clearly identified within the galaxy. For source B, Bayliss et al. (2010) were unable to identify a counter image, and therefore this source was not used as a constraint. Our HST data help reveal two counter-images with the same unique color as source B, enabling its use as lensing constraint. Lensing potential from a nearby cluster-member galaxy perturbs the critical curve at the location of B.1. The model is of high fidelity, and we classify it in category A.
4.3.8. SDSS J0928+2031
The distribution of cluster-member galaxies and the lensing evidence in this field suggest that SDSS J0928+2031 is composed of two subhalos, each dominated by a bright elliptical galaxy. The northwest halo appears to be the more massive, based on the lensing evidence and its appearance in archival Chandra data. This cluster was selected as a strong lens based on an identification of an elongated arc north of the BCG, labeled 1 in Figure 2. The giant arc likely forms along the critical curve for its redshift, with a bright knot falling just outside of the caustic and thus not multiply imaged. We identify several additional lensing constraints near the northwest core of the cluster. Spectroscopy was obtained with the Magellan Clay telescope using FIRE on 2013 February 28, securing spectroscopic redshifts of the main arc at  = 1.891, and of two other sources that are likely not multiply imaged (Table 11). We note a group of red galaxies near source C, which appear to be low-redshift dusty galaxies; while their FIRE spectra did not have high enough signal-to-noise for a high-confidence redshift, their Spitzer luminosity and optical colors are similar to those of source C, and the spectra are consistent with z ∼ 1.9. We obtained multi-slit spectroscopy from Gemini North as part of program GN15AQ38 (PI: Sharon), and measured spectroscopic redshifts of arc candidates 2 and 3 and cluster-member galaxies (see Tables 5, 11, respectively).
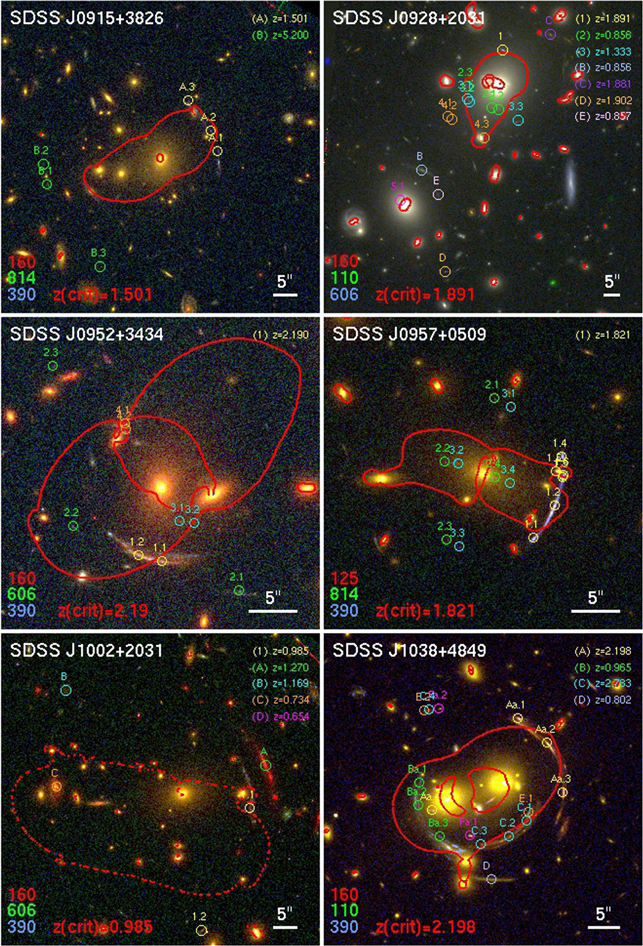
Figure 2. Same as Figure 1, for the clusters SDSS J0915+3826, SDSS J0928+2031, SDSS J0952+3434, SDSS J0957+0509, SDSS J1002+2031, and SDSS J1038+4849. The coordinates, redshifts, and references are tabulated in Table 5.
Download figure:
Standard image High-resolution imageThe second bright galaxy in this cluster lies 46″ southeast of the BCG in projection. We identify a flexured galaxy at  = 0.856 northwest of the galaxy, in the direction of the BCG. No counter-images are identified for this galaxy, and it is likely in the strong–weak lensing regime rather than strongly lensed. We identify a candidate radial arc, system 5, and use it as a constraint in the south halo. The lack of strong-lensing constraints prevents us from robustly modeling the mass distribution that may be attributed to a possible dark matter clump in the south region. The projected mass density implied from the model is consistent with the velocity dispersion, which we measured from 15 galaxies we observed with GMOS and four galaxies from SDSS DR12. The model therefore provides a reliable description of the mass and magnification around the northwest core (category A), from multiple lensing constraints and source redshifts around its core; but it is underconstrained in the area surrounding the southeast core (category C).
4.3.9. SDSS J0952+3434
A giant arc is observed south of the cluster core ( = 2.1896, Kubo et al. 2010). The giant arc does not show particular symmetry, and we do not robustly identify a counter image. We identify tentative faint multiple images of other sources that can be used to constrain the lens model. However, the low confidence with which they are identified, and the lack of confirmation of a counter image for the giant arc, results in a low-confidence lens model (category B). The lens model, the loose appearance of the galaxy distribution, and overall density of galaxies, are consistent with the low projected velocity dispersion we calculate for this cluster (Table 2) from spectroscopic redshifts of eight cluster-member galaxies from Gemini/GMOS and two galaxies with spectra in SDSS DR12 (Table 11).
4.3.10. SDSS J0957+0509
The HST data show that the giant arc of source 1 in SDSS J0957+0509 is composed of several merging images of a single background galaxy. Cluster-member galaxies that are in close projected proximity to the arc contribute to a complex lensing configuration. We identify five bright images within the giant arc, and one faint demagnified image near the center of a galaxy 78 west of the BCG. The redshift of this source was measured by Bayliss et al. (2011b),
 = 1.821. In addition to the giant arc, we identify two other lensed systems in the HST data, #2, #3. Each of these systems has four visible images, with a fifth demagnified image predicted by the lens model near the center of the BCG. The lens model is reliable, and we classify it as A−. Securing spectroscopic redshifts for sources #2 and #3 would add confidence to the model that is otherwise well constrained.
4.3.11. SDSS J1002+2031
Ground-based imaging of this cluster show an obvious giant arc, located 140 west of the BCG, labeled #1 in Figure 2. A second elongated feature appears bright in red/infrared bands, 18
1 west of the BCG, labeled A in Figure 2. Using our HST imaging data, we identify a tentative candidate counter image for the giant arc (labeled #1.2). The red feature, which also looks like an elongated arc from the ground, appears as two galaxies in the HST data. It does not have a counter image, and is likely a magnified single image. We do not identify other strong-lensing constraints in the data. We observed this field using GMOS on Gemini North (GN11AQ19 and GN15BQ26) and obtained spectroscopic redshifts of background galaxies and cluster-member galaxies. The spectroscopy places the blue giant arc at zspec = 0.985, and galaxy A that was initially identified as a red arc at
 = 1.27. Another bright background galaxy, C, is found 26
1 east of the BCG, with spectroscopic redshift
 = 0.734. These two spectroscopically confirmed, singly imaged galaxies help in constraining possible lens models, as we can rule out models that predict counter-images for these galaxies. Nevertheless, we find that these constraints are not sufficient for a robust lens model. This model is therefore classified as C− (poor, underconstrained). The dashed critical curve that is shown in Figure 2 represents a family of models that is capable of reproducing the lensing geometry of the blue arc; however, these models are likely incorrect because they predict counter-images for galaxy A.
4.3.12. SDSS J1038+4849
As can be seen in Figure 2, there are several giant arcs with large azimuthal coverage around the cluster core. Bayliss et al. (2011b) measured spectroscopic redshifts of four unique sources (see Table 5). The new HST data improve upon archival data with the long wavelength baseline. Since the lensed images vary significantly in color and morphology, these new data are useful for a robust identification of the matched counterparts in the lensed images of each source, and in distinguishing the sources from each other.
We follow the naming scheme of Bayliss et al. (2011b) for the giant arcs; however, the exact locations of constraints within each arc are slightly different, owing to the superior HST resolution. Source A, at  = 2.198, is identified northwest of the cluster core, as a giant arc of three merging images. The images are highly magnified in the tangential direction, and several emission clumps can be isolated in each. The source is likely a galaxy pair. We identify a fourth image of this source east of the cluster core.
Source B, at  = 0.9652 is seen as a giant arc southeast of the cluster core, brightest in the UVIS bands. The lens model clarifies the lensing configuration of this system: the source galaxy appears to be a spiral galaxy with bright bulge and two loose spiral arms. The central part of the galaxy has one image, that appears slightly distorted in the tangential direction. This is the brightest part of this arc, labeled as image B1 in Bayliss et al. (2011b). In the source plane, some emission knots in one of the spiral arms cross the caustic, forming the elongated giant arc Ba.1, Ba.2, Ba.3.
Source C, at  = 2.7830, is lensed into a giant arc composed of three merging images south of the core, and a newly identified counter image north-northeast of the core. The model predicts a demagnified central image for this source, two to four magnitudes fainter, in the light of the central galaxies. We do not identify this image in the current data depth.
Source D in Bayliss et al. (2011b), at  = 0.802, is a distorted singly imaged galaxy, and not used as a constraint in the lens model.
We identify two new lensed galaxies. Source E is likely part of system C; however, since it has significantly bluer color than system C we leave its redshift as a free parameter. The model-predicted redshift for this source is consistent with that of source C. We identify two images of source F, south and north of the cluster core. A third image is predicted by the lens model to appear near the center of the cluster, predicted to be two magnitudes fainter. We do not identify this demagnified image.
The model is well constrained and is classified in category A.
4.3.13. SDSS J1050+0017
Our lens model of this cluster was presented in Bayliss et al. (2014b), who measured the physical properties of one of the giant arcs (system C, at  = 3.625). We refer the reader to this publication for a full description of the lens model and spectroscopic confirmation of the lensed galaxies. We follow the naming scheme of Bayliss et al. (2014b) in the brief description below; see also Table 6 and Figure 3.
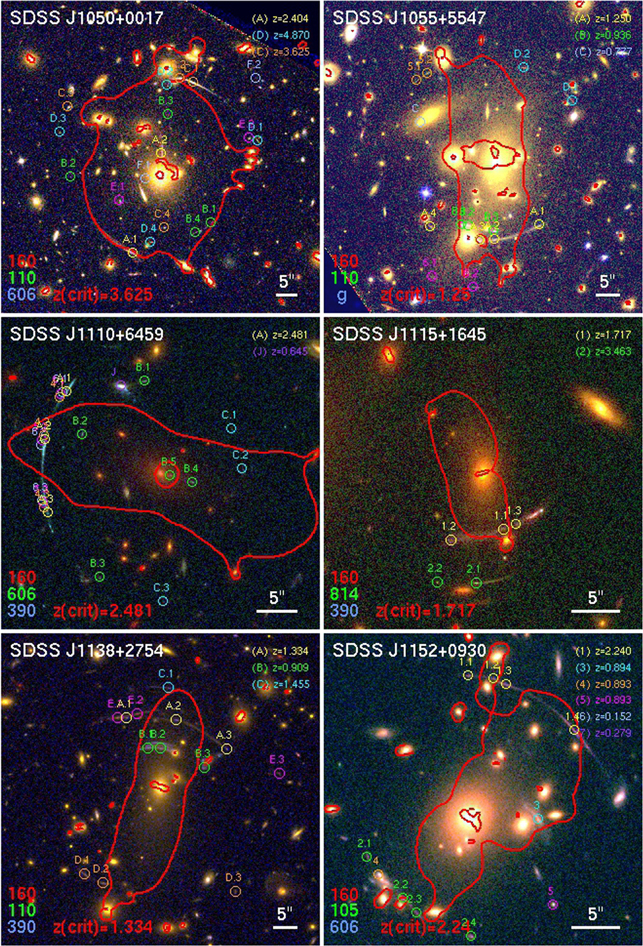
Figure 3. Same as Figure 1, for the clusters SDSS J1050+0017, SDSS J1055+0017, SDSS J1110+6459, SDSS J1115+1645, SDSS J1138+2754, and SDSS J1152+0930. The coordinates, redshifts, and references are tabulated in Table 6.
Download figure:
Standard image High-resolution imageWe identify several lensed sources in the field of SDSS J1050+0017. Source A has two images: a giant tangential arc south of the cluster center, and a radial arc north of the BCG. We identify three images of source B, a faint tangential arc and a counter image. Source C has four images, two of them form the giant arc northwest of the cluster center, and the other two appear northeast and south of the BCG. Source D has four images around the cluster core, and we identify two images each for sources E and F. The model only uses as constraints the spectroscopically confirmed systems: A, C, and D. The model is well constrained and is classified in category A.
4.3.14. SDSS J1055+5547
During the UVIS observation of SDSS J1055+5547, the fine guidance sensors failed to lock on one of the two guide stars, and the HST visit was executed with only one guide star and gyro control. As a result, the UVIS observation of this cluster failed. The WFC3-IR imaging in F110W and F160W were not significantly affected. Our request for a re-observe of the failed visits was denied due to STScI’s strict policy of not re-observing failed observations when more than 90% of the targets in the program are complete. Since the UVIS data were critical for the science outcome of GO-13003, this cluster was excluded from the analysis of the lensed background sources. Nevertheless, we provide a lens model for this cluster, from a combination of the WFC3-IR data and archival Subaru imaging in g, r, and i (see Oguri et al. 2012 for details of the Subaru observation of this field). Figure 3 is a color rendition made from the F160W and F110W in red and green, respectively, and Subaru r band in blue. The HST data are superior in resolution, and the Subaru data complement them with a broad wavelength coverage which is useful for a robust identification of lensed features. Furthermore, we identify the cluster-member galaxies in this field from the Subaru data, using the r and i bands.
The cluster lenses several background galaxies, four of them were identified and targeted for spectroscopy by Bayliss et al. (2011b). The lensed images of source A ( = 1.250) and source B (
 = 0.936) appear in the south of the field. Nearby galaxies complicate the lensing configuration of A and B. Source C (
 = 0.777) in Bayliss et al. (2011b) is a single image of a background galaxy. Source D was targeted for spectroscopy, but did not yield a redshift measurement. We identify a candidate counter image for this system. We identify other lensing features around the cluster core, as listed in Table 6. The model is well constrained and is classified in category A.
4.3.15. SDSS J1110+6459
The lensing analysis and spectroscopic observations of SDSS J1110+6459 are presented in Johnson et al. (2017b) in more detail. We identify four multiply imaged lensed galaxies, denoted A, B, C, D in Figure 3. The main arc, A, is a giant arc formed by a naked-cusp configuration of three merging images of the same source galaxy. In Johnson et al. (2017b) we measured a source redshift  = 2.4812 from Gemini spectroscopy of all three arcs, and identified more than 20 emission knots in each of the three segments of the arc, thanks to the high tangential magnification. In Johnson et al. (2017a, 2017b) and Rigby et al. (2017) we measured their size, luminosity, and star formation rate, and find that the typical source-plane unlensed size is <100 pc. System B is a five-image set, comprised of three tangential and two radial arcs, with distinctive color and morphology. System C is detected with two secure images. A third candidate is predicted by the model but not unambiguously confirmed. System D is identified as three separate emission knots near system A (labeled D, E, F in Johnson et al. 2017b). It is not spectroscopically confirmed; however, as its deflection angle is slightly different than that of system A we conclude that it is a separate galaxy from system A, which happens to be on the same line of sight. The best-fit model redshift for this system is zmodel = 2.37.
We refer the reader to Johnson et al. (2017b) for the full details of the lens model of SDSS J1110+6459. In short, this cluster was modeled using the hybrid Lenstool method, with the cluster potential modeled as a combination of mass components centered on grid nodes, following the prescription of Jullo & Kneib (2009). The halos of cluster galaxies were added as described in Section 4.1. The model is well constrained and is classified in category A.
We also note a “jellyfish” galaxy in this cluster at  = 0.6447, spectroscopically confirmed at the cluster redshift near image B.1 (Johnson et al. 2017b). Based on its morphology, this galaxy is likely going through a rapid epoch of star formation as it falls into the cluster (Sun et al. 2010; Ebeling et al. 2014; McPartland et al. 2016).
4.3.16. SDSS J1115+1645
Two lensed galaxies are spectroscopically confirmed in the field of SDSS J1115+1645, both south of the cluster BCG. The redshift of System 1 was measured by Stark et al. (2013),  = 1.7170. The redshift of system 2 was measured by Bayliss (2012), zspec = 3.4630. The SDSS DR12 catalog provides spectroscopic redshift of another cluster galaxy at
  = 0.5350, at a projected radius of 51
2 from the BCG.
We identify a foreground structure on the line of sight to the lensing cluster, likely a cluster or a group, at  ∼ 0.19. The structure appears as a clear red sequence in the color–magnitude diagram of the field. Three galaxies in this cluster/group have spectroscopic redshifts in SDSS DR12, zSDSS = 0.19107, 0.19372, 0.19602, within ∼3′ from the lens. The foreground cluster/group is likely boosting the lensing efficiency of SDSS J1115+1645, as seen in other strong-lensing selected clusters (Bayliss et al. 2014a). The lensing evidence suggests that the cluster at
  is responsible for the observed lensing configuration; however, due to the small number of constraints the current analysis cannot quantify the contribution of the intervening structure. The model is classified in category B because, although it has lensing constraints from two galaxies, they are both on the south side of the cluster leaving its north region underconstrained.
4.3.17. SDSS J1138+2754
Five lensed galaxies are identified in this field. All the spectroscopic redshifts were measured by Bayliss et al. (2011b). Source A has three images north of the BCG; all three images were spectroscopically confirmed at  = 1.334. Source B, at
  = 0.909, has three images, two of them form a thick arc north of the BCG. Source C is likely a single image, also north of the BCG, with a tentative redshift
  = 1.455. Two images of source D were also identified and targeted by Bayliss et al. (2011b) but the spectra did not yield a redshift measurement. We identify a candidate third image for this system. The new HST data help discriminate the different part of what looks like a single giant arc in the ground-based data. We identify a new lensed candidate, labeled E.
We measure a photometric redshift for source D, zphot = 2.94 from the HST and Spitzer photometry. Since the images of this galaxy are the only constraints south of the BCG, we use the photometric redshift as a prior in our analysis. The model is well constrained and is classified as A−. A spectroscopic redshift measurement of source D would add confidence to model predictions south of the core.
4.3.18. SDSS J1152+0930
System 1 forms a faint thin giant arc northwest of the BCG, identified as source D in Bayliss et al. (2011b); we rename the lensed features in this field for clarity. The arc is fairly smooth in the HST data with no prominent substructure. A faint elongated arc appears in the southwest of the cluster, which we interpret as four images of a lensed galaxy. Other faint arc-like features are observed in the data; however, we are unable to confirm additional multiple-image lensing constraints. We measure a redshift for system 1 of  = 2.24, from tentative [C iii] 1907, C iii] 1909 Å lines in low signal-to-noise multi-slit spectra using IMACS on the Magellan Baade telescope, observed in 2014 April. The same observations result in spectroscopic redshift of two foreground sources at
  = 0.152 (source 6) and
  = 0.279 (source 7). We confirm the redshifts of background sources that were formerly measured by Bayliss et al. (2011b) for the galaxies labeled 3 (A2) and 4 (A3); however, the HST data, as well as the lens model, indicate that these are single images. Given the similar redshifts of galaxies 3, 4, 5,
  ∼ 0.893, it is likely that they are part of a small background group. The lens model is based on the northwest and southeast arcs, with the redshift of the former used as a fixed constraint. Table 6 lists the positions that were used as constraints. However, due to the relative smooth appearance of the faint arcs, it is difficult to identify the exact locations of the counterparts of each multiply imaged feature. The model is classified as A−. A spectroscopic redshift measurement of source #2 would add confidence to the model in the southeast area.
4.3.19. SDSS J1152+3313
Bayliss et al. (2011b) measured the redshifts of two lensed galaxies in this cluster: source A ( = 2.491), which forms the giant arc in the west, and two images of source B (
 = 4.1422). With the HST data, the internal structure of the giant arc is resolved, and we identify several unique features in it that are used as lensing constraints. We find that the giant arc is made of three merging images of the background galaxy. In addition, we identify three counter-images, for a total of six detectable images for this system. A seventh image is predicted by the lens model near the center of the southern central galaxy (near A.6); several features are detected in the galaxy light, but as they cannot be uniquely matched with features in the other arcs, we do not use this image as a constraint. For source B we identify four images, with a fifth, demagnified image predicted by the lens model to appear near the center of the south central galaxy, but is too faint to be uniquely identified in the galaxy light. We identify two images of a new lensed galaxy, labeled C, with two images, and a demagnified third predicted near the core of the north central galaxy. It was not targeted for spectroscopy and therefore its redshift is unknown. The model is well constrained and is classified in category A.
4.3.20. SDSS J1156+1911
In the field of SDSS J1156+1911 we detect one giant arc at  = 1.543 (Stark et al. 2013). We assume a cluster redshift from the spectroscopic measurement of its BCG,
  from SDSS. The BCG redshift was also measured by Stark et al. (2013). We do not detect a counter image for the giant arc. The lens model and the color gradients within the arc indicate that the east and west portions of the arc are not multiply imaged. The source galaxy crosses two caustics in the source plane, resulting in magnification and stretching of only a small part of the galaxy. The model is reliable for reconstructing the morphology of the lensed galaxy, and can explain its lensing geometry. Given the limited lensing constraints we classify it in category B.
4.3.21. SDSS J1207+5254
SDSS J1207+5254, at z = 0.275, was reported by Kubo et al. (2010). The cluster core contains several elliptical galaxies, and not one dominant central galaxy. The small curvature of the  = 1.926 giant arc is a result of an elongated projected mass density distribution, caused by a secondary halo, which coincides with the bright elliptical galaxy to the northeast. The cluster was observed in our Gemini program, but the pipeline failed to generate useable flat fields for most of the mask due to scattered light from the bright acquisition stars.
Interestingly, an overdensity of luminous red galaxies is apparent in the WFC/IR data northwest of the cluster center, and based on the color and brightness it is likely a background structure.
The giant arc in SDSS J1207+5254 is a naked-cusp configuration of three images, two of which are partial images. We identify 10 individual emission knots that are used as constraints; no counter image is identified in the data beyond the giant arc, as expected in such configuration. A secondary system of two high-confidence arcs is identified southwest of the cluster center, with unknown redshift. A third image in this system is predicted by the lens model to be embedded in the light of a cluster-member galaxy, and is visually confirmed; this third image is not used as a constraint in the model. The lens model is classified as B+, with higher uncertainties in the southwest region.
Comparing the new HST data and gri Gemini/GMOS observations taken on 2008 December 23 as part of GN-2008A-Q-25, we found in the GMOS data a point-like source that does not have a counterpart in the HST image, at R.A., decl. = [181.8982, 52.918553]. Since this source only appears in the archival images we were unable to confirm it spectroscopically. If extragalactic, this source could be a supernova (SN) at the cluster redshift without an apparent host, i.e., an intracluster SN. These have been shown to compose as much as 20% of cluster SNe (Gal-Yam et al. 2003; Sharon et al. 2010; Sand et al. 2011). Alternatively, the transient could be a supernova in the foreground or behind the cluster, with an undetected faint host. The magnification at the position of the transient depends on the source redshift, but given its close proximity to the cluster center (see Figure 4) it could be significant, ranging from 1.8 for a source at z = 0.4, to 7 for a source at z = 1, and ∼17 for a source at z = 2. The transient appears in two of the three bands, with g > 25.9 ± 0.3, r = 23.87 ± 0.07, and i = 23.28 ± 0.08. The duration of the GMOS observations was 10 minutes, during which the position of the source remains stable. For a thorough discussion of SN alternatives in a single-epoch discovery we refer the reader to Gal-Yam et al. (2002) and Sharon et al. (2010).
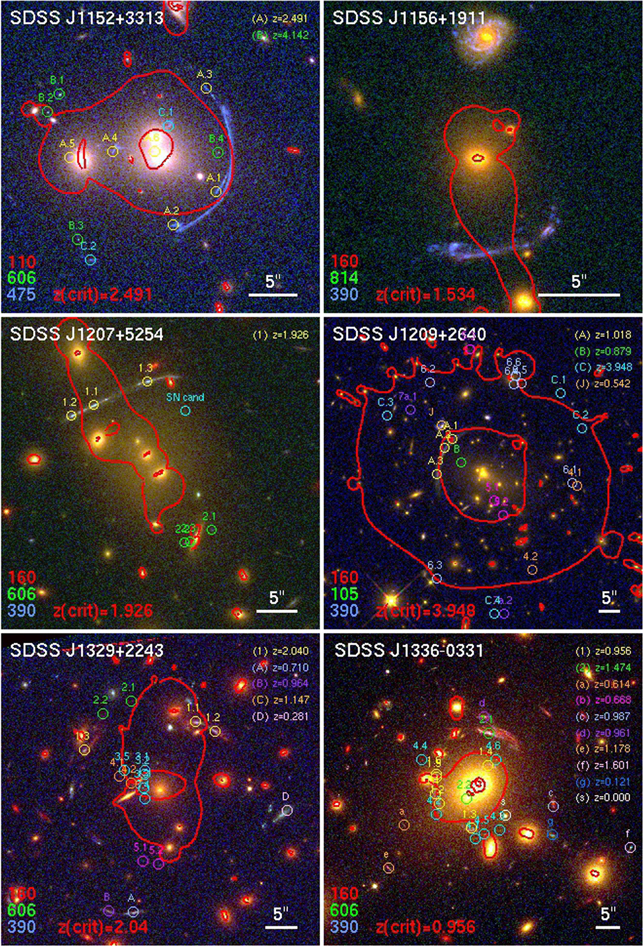
Figure 4. Same as Figure 1, for the clusters SDSS J1152+3313, SDSS J1156+1911, SDSS J1207+5254, SDSS J1209+2640, SDSS J1329+2243, and SDSS J1336−0331. The coordinates, redshifts, and references are tabulated in Table 7.
Download figure:
Standard image High-resolution image4.3.22. SDSS J1209+2640
The discovery of the lensing cluster SDSS J1209+2640 was reported by Ofek et al. (2008). This paper identified several lensed candidates, and measured the redshift of the brightest arc, A,  = 1.018. Bayliss et al. (2011b) measured spectroscopic redshifts of source B,
  = 0.789, and C,
  = 3.948. With archival WFC2 data and the broad wavelength coverage made available by our new HST data, we identify the counter-images of C, and several new arcs. We keep the ID names of systems A, B, and C, and relabel the new systems below.
Source 4.1 is approximately the suggested candidate D in Ofek et al. (2008). Bayliss et al. (2011b) obtained a spectrum of this arc, but was unable to secure spectroscopic redshift for it. We identify a candidate counter image for it in the south part of the field, which was labeled H2 in Ofek et al. (2008).
Source 5 is identified as a radial pair southwest of the BCG, 5.1 and 5.2, with a counter image in the north part of the field. This system has unique colors and diffuse surface brightness that helps in its identification.
Source 6, with six images, is bright in the WFC3-IR bands and virtually absent from the optical data. Since we also detect this source in our Spitzer imaging, we conclude that it is likely a z ∼ 1–3 dusty galaxy, which is supported by the lens model. A cluster galaxy in the north part of the cluster core complicates the lensing configuration and is responsible for three of the images.
We identify two candidate images for source 7, one of which is the arc labeled I in Ofek et al. (2008).
The lensing signal of this cluster is modeled with one halo for the cluster and halos for the cluster galaxies. We let the parameters of the galaxy near the three north images of system 6 to be solved for by the lens model. We note that to reproduce the lensing evidence this model requires external shear in addition to these components. The model is well constrained, and classified in category A.
Our Gemini/GMOS spectroscopy did not yield new redshifts for arc candidates in this field. We add 10 spectroscopic redshifts for cluster-member galaxies to the measurements of Bayliss et al. (2011b) and update the velocity dispersion of this cluster (Table 2). Finally, we note a galaxy that is likely undergoing ram pressure stripping, near the core of the cluster, at R.A, decl. = [182.3517695, 26.68261135], labeled J. Its redshift as well as that of a nearby galaxy were measured by Ofek et al. (2008) as  = 0.542.
4.3.23. SDSS J1329+2243
The main lensed system in this field has three images of a galaxy at  = 2.04, north of the cluster center. Spectroscopic confirmation of the three images was obtained with Gemini/GMOS-North (Bayliss et al. 2014a). From the same multi-slit observations, we measure the spectroscopic redshifts of other sources in the field.
The orientation of sources A and B, located south of the BCG, suggest that they may be multiple images of the same source. We rule out this scenario based on their different spectroscopic redshifts,  = 0.710 and
  = 0.964, respectively, which also places them outside of the strong-lensing region. Similarly, the spectroscopic redshifts of galaxies C and D confirm that they are single images.
We identify a few faint sources as multiple-image candidates based on colors and morphology, as listed in Table 7 and plotted in Figure 4. We used all the knots in system 1 as constraints in the model, the two secure images of system 2, and the two secure radial images of system 4, the latter two systems with unknown redshift set as a free parameter. The lensing morphology of system 3 is complicated by several cluster galaxies in the core of the cluster. The five listed images have similar colors and surface brightnesses in all the bands in which they appear; however, we cannot definitively determine whether they are all images of the same source. The lens model is consistent with several images being produced at this region. Nevertheless, these images are not used as constraints in the model published here. Deeper imaging to secure the identification of system 3, and spectroscopic redshifts of sources 2, 4, 5 would strengthen the model and increase its fidelity. It is otherwise well constrained, and we classify it as A−.
4.3.24. SDSS J1336−0331
We identify two giant arcs in this field. Southeast of the BCG, we detect an elongated arc (source 1), with a counter image on the opposite side of the BCG. The giant arc is composed of at least two images, with a cluster-member galaxy adding complexity to the lensing potential that results in partial arcs between this galaxy and the BCG. A bright lensed galaxy (source 2) appears north of the BCG, with a significantly redder core. We identify and spectroscopically confirm a radial arc south of the BCG, making this a system of two images. Two other faint galaxies are identified as multiply imaged lensed systems and used as constraints. We observed SDSS J1336−0331 with the Magellan Clay 6.5 telescope using the LDSS3 instrument. Long-slit spectroscopy of the two bright components of source 1 south of the BCG confirm their spectroscopic redshift at  = 0.96. IMACS multi-slit mask spectroscopy observed with the Magellan 6.5 m Baade telescope confirms the radial arc south of the BCG (labeled 2.2 in Figure 4) as a counter image of 2.1, the giant arc to the north, at
  = 1.47. The same spectrum reveals multiple emission lines from the cluster redshift, likely from the galaxies at the core of the cluster. This spectrum, as well as a prominent dust lane in the light of the BCG, indicates significant star formation at the core of this cluster. The model is well constrained, and classified in category A.
4.3.25. SDSS J1343+4155
A giant arc appears at the east side of the cluster core, with  = 2.091 (Diehl et al. 2009). The HST resolution reveals some substructure in the giant arc, which helps with its interpretation as three merging partial images of the background galaxy, which crosses a naked caustic cusp in the source plane. There are no counter-images identified, as expected in this configuration. The discovery and spectroscopy of a
  = 4.994 lensed Lyα emitting galaxy in the field of SDSS J1343+4155 was reported by Bayliss et al. (2010). A candidate counter image that was suggested by Bayliss et al. (2010) appears to not have the exact same color and morphology as the spectroscopically confirmed image. We therefore do not use it as a lensing constraint. The model does not predict multiple images for the Lyα emitter. We identify three faint images of a candidate third lensed galaxy. The improvement upon the model presented in Bayliss et al. (2010) includes revised constraints: we use the identified emission knots in the giant arc, remove the candidate counter image of the Lyα emitter, and add candidate 2 with free redshift. In addition, we account for contributions from individual cluster galaxies, which was not implemented in Bayliss et al. (2010). Since all the lensing constraints appear in one side of the cluster core, degeneracies between model parameters increase the uncertainties, especially in regions which have no lensing constraints (i.e., the southwest part of the cluster, where the Lyα source appears). We therefore classify it in category B.
4.3.26. SDSS J1420+3955
The appearance of two giant arcs in ground-based optical data led to the selection of this cluster as a strong lens. The HST imaging reveal several other lensed galaxies, resulting in a total of 10 lensed systems in this field. The lensing evidence indicates that SDSS J1420+3955 is a complex structure. Bayliss et al. (2011b) report the spectroscopic redshifts of two giant arcs, labeled A and B. The lensing configuration of arc A, at  = 2.161, appears to be affected by a cluster galaxy, forming at least five images or partial images of the source around the cluster member, with a sixth complete image 25
7 north of it. The unique colors and morphology make this a confident identification. Arc B is at
 = 3.066; the HST imaging reveals multiple emission knots and enables the identification of a counter image, B.3.3.
Newly identified lensed features include a red giant arc (source 3) with a counter image, bright in the WFC3/IR imaging, as well as other lensed galaxies, some of which form radial arcs. We identify two radial images of source 4. A group of three sources 5, 6, and 7, have four identified images each. Source 8 forms three images near one of the cluster galaxies near the core, and a fourth image northwest of the core of the cluster. None of these newly identified sources have spectroscopic redshifts measured.
We also identify strong-lensing evidence around two bright cluster galaxies located 53″ and 68″ west of the BCG. We use these lensing features to constrain the contribution from these structures to the overall lensing mass of SDSS J1420+3955.
Overall, the cluster is constrained by images from 10 lensed galaxies, providing ample positional constraints. However, the lack of spectroscopic redshifts for all but two galaxies is a limitation. A spectroscopic redshift of any of sources 5, 6, 7, or 8 would place the cluster in category A; we currently classify it as A−.
4.3.27. SDSS J1439+1208
The main arc in this field appears as a merging pair (source 1), with redshift  = 1.494, measured from Magellan/FIRE spectroscopy. A preliminary lens model predicts the location and morphology of a counter image (1.3) and radial arc, readily discovered in the HST imaging (1.4), with robust confirmation by colors and morphology. We further discover another set of two images (2.1, 2.2) and a candidate radial image (2.4). The lens model predicts a fourth image between images 2.1 and 2.2. We detect a likely candidate counter image in that location (2.3).
We pursued spectroscopic confirmation of the lensed candidates, using the Magellan Baade 6.5 m telescope with the IMACS camera. On 2013 March 17 we obtained long-slit spectra of B1, 1.2, and 2.2. On 2014 April 26 we obtained multi-slit spectroscopy, targeting the candidate counter image of the main arc, 1.3, arc 2.1, and the candidate arc B2. These observations resulted in spectroscopic redshift of 2.1,  = 1.580 from [O ii] 3727, 3729 Å line. The slit on 1.3 was unfortunately placed on a chip gap, and did not yield data. A comparison between the spectra of B1 and B2 leads to the conclusion that they are not images of the same source. We observe a strong emission line in the spectrum of B1 that is not observed in B2, placing it at
  = 3.48 if it is coming from Lyα. A low-confidence emission line in the MOS spectrum of B1 suggests that it may be at
  = 1.53, if this line is [O ii] 3727, 3729 Å.
The model is well constrained and classified in category A.
4.3.28. SDSS J1456+5702
The HST imaging of SDSS J1456+5702 reveals the details of an extended, low-surface brightness arc. While giant arcs are often observed to be long and thin, this one has an unusual width of 34. A counter image is detected close to the BCG. Due to its low surface brightness, this was the only main arc in GO-13003 that lacked spectroscopic redshift prior to its HST observation. We secured a spectroscopic redshift for the giant arc,
 = 2.366, from S ii, O i, Si ii, and C ii lines in a Blue Channel spectrum obtained at MMT on 2014 May 4 (PI: Bayliss).
The lensing morphology of this system is primarily of three images: the giant arc in the south, a counter image north of the BCG, and a demagnified image near the core. The morphology of the giant arc is slightly complicated by cluster-member galaxies, causing some parts of the central region of the giant arc to be highly magnified and with added multiplicity.
Bayliss et al. (2011b) measured spectroscopic redshifts of three other galaxies in this field (Table 8), most notably two galaxies at similar redshift, A1 and A2, on opposite sides of the cluster core. The HST imaging indicates that these galaxies are not images of the same source; the lens model is also consistent with these galaxies being single images. The model is well constrained and classified in category A.
4.3.29. SDSS J1522+2535
In this field, we find one highly magnified galaxy, with five multiple images. The galaxy is clearly resolved, and displays a bright core (brighter in the infrared bands) as well as spiral structure. The proximity to cluster galaxies complicates the lensing configuration. In particular, a cluster galaxy is superimposed near the core of image 1.1 but does not significantly distort it. Images 1.4 and 1.5 are more strongly affected by the BCG and other bright galaxies near it. Nevertheless, due to its unique colors and morphology, all five images of the lensed galaxy are robustly identified. Moreover, all the images are spectroscopically confirmed by our Gemini/GMOS spectroscopy (Table 11), at zspec = 1.7096. Some of the lens model parameters of the three galaxies in close proximity to the lensed images were left as free parameters. The model is well constrained and classified in category A.
4.3.30. SDSS J1527+0652
SDSS J1527+0652 was reported in Koester et al. (2010), as a highly magnified galaxy at  = 2.76. The bottom-right panel in Figure 5 zooms in on the arc, which appears 14
5 south of the core of a galaxy cluster that is outside of the figure. The foreground cluster does not have one obvious central galaxy. The added resolution of the HST observations reveal that the lensing geometry is locally dominated by the lensing potential of an elliptical galaxy, boosted by the cluster potential. The arc is composed of three partial images; counter-images are neither detected nor predicted by the lens model. The arc at
 = 2.76 is the most obvious lensing feature in this field; however, it is not sufficient for constraining the mass distribution of the cluster itself. To constrain the cluster halo, we rely on several faint multiply imaged lensed galaxies. These galaxies are not spectroscopically confirmed. The lens model is consistent with the velocity dispersion measured from spectroscopy of 14 cluster galaxies (Bayliss et al. 2011a), σv = 923 ± 233 km s−1. The conversion between velocity dispersion and the PIEMD σv parameter is given in Elíasdóttir et al. (2007).
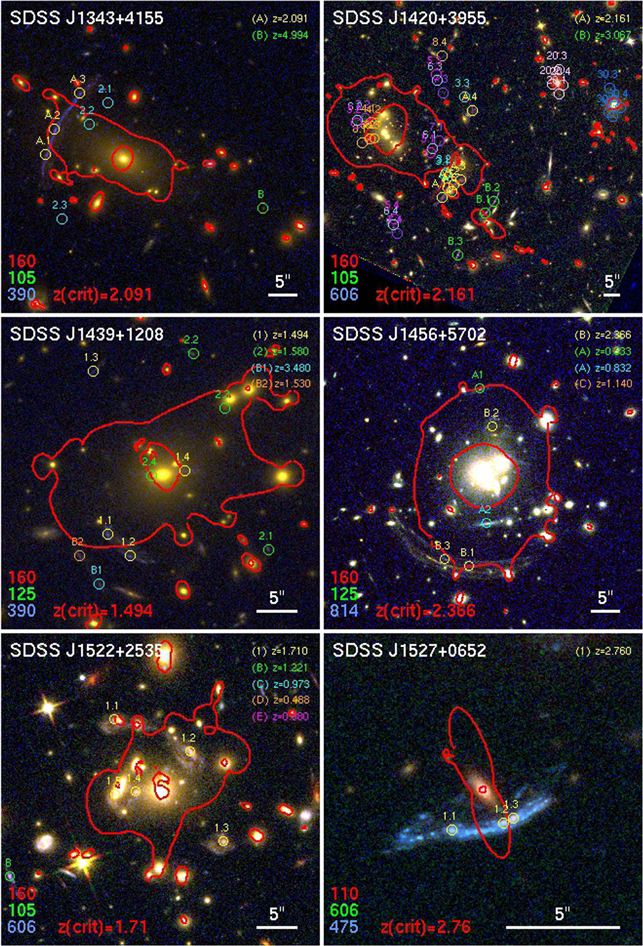
Figure 5. Same as Figure 1, for the clusters SDSS J1343+4155, SDSS J1420+3955, SDSS J1439+1208, SDSS J1456+5702, SDSS J1522+2535, and SDSS J1527+0652. The coordinates, redshifts, and references are tabulated in Table 8.
Download figure:
Standard image High-resolution image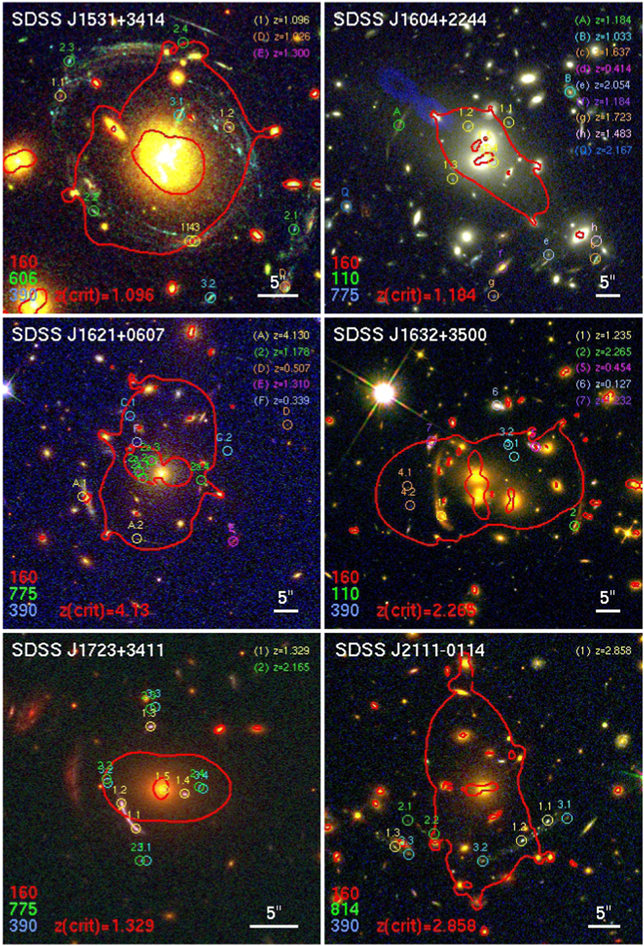
Figure 6. Same as Figure 1, for the clusters SDSS J1531+3414, SDSS J1604+2244, SDSS J1621+0607, SDSS J1632+3500, SDSS J1723+3411, and SDSS J2111−0114. The coordinates, redshifts, and references are tabulated in Table 9.
Download figure:
Standard image High-resolution imageR. Bordoloi et al. (2020, in preparation) observed this galaxy with the Keck Cosmic Web Imager (KCWI) on UT 2017 June 21, with a field of view of 165 × 20
4, resulting in IFU spectroscopy of the main highly magnified galaxy and nearby galaxies. The observations indicate that some of the emission that is evident in our HST imaging comes from a line-of-sight interloper at
 = 2.543. Magellan/MagE observations (Rigby et al. 2018b) reveal several intervening absorption systems (J. Rigby et al. 2020, in preparation), including one at
  = 2.543, for which an emission-line component is seen in the KCWI data, which explains diffuse emission seen in the HST imaging. J. Rigby et al. (2020, in preparation) also find several other intervening absorption systems at lower redshifts. The KCWI data also measure the redshift of several nearby galaxies, finding a small group at z ≃ 0.43, including the galaxy nearest to the main arc. We therefore employ an iterative approach in modeling the lens. We first compute a lens model for the cluster as explained above; we then treat the cluster as providing cosmic shear, and proceed to model the galaxy near the main arc. The large number of observed emission clumps constrain the lens model, which is composed of the lens galaxy as well as contribution from external shear.
We also note a fainter arc at R.A., decl. = [231.92365, 6.862152778] caused by lensing by an elliptical galaxy close to the edge of our HST field of view. This lensed arc was not used to constrain the lens model.
The lensing constraints available are not sufficient for a robust model of the galaxy cluster; we classify the cluster model in category C. Nevertheless, like other models with similar lensing configuration (e.g., SDSS J1004−0103), this model provides a reliable description of the lensing configuration of the main arc in the field. For its high magnification uncertainty, we classify the lens model that is used for this lensed source in category B.
4.3.31. SDSS J1531+3414
We refer the reader to Sharon et al. (2015) for detailed description of the lensing analysis of SDSS J1531+3414. We provide a short description here. In the field of this cluster we confirm three strongly lensed galaxies. Source 1 with five images, source 2 with five images, and source 3 with a tangential and radial arc. Bayliss et al. (2011b) observed this field with multi-object spectroscopy, and secured a redshift for source 1 at  = 1.096. For the other two sources, only lower limits were measured, z > 1.49 for both. Our lensing analysis in Sharon et al. (2015) confirms that galaxies A5, A6, B2, and C1 in Bayliss et al. (2011b) are single images. The model is well constrained and classified in category A.
4.3.32. SDSS J1604+2244
This cluster was identified as a strong lens based on a bright elongated arc, labeled A, at  = 1.184, which is located ∼18″ west of the two bright galaxies that dominate the cluster center. We measured the redshift of this arc, as well as six cluster-member galaxies, using Gemini GMOS (program GN11AQ19). The cluster is at relatively low redshift compared to other clusters in this sample, zcluster = 0.286. The arc appears to be a single image. Although other arc-like features are observed in the HST data, we are able to identify only one secure family of multiple images that can be used to constrain the lens model. The system, labeled as source 1, consists of five images with distinct morphology and color. We measure the photometric redshift of the three images that are not too blended in the light of the foreground galaxies, finding
  = 0.53. We compute a lens model with the photometric redshift used as prior, 0.5 < z1 < 0.8. We require that the lens model does not produce counter-images for singly imaged galaxies. The model is classified in category B; a spectroscopic redshift of source 1 would improve its reliability.
4.3.33. SDSS J1621+0607
Three arcs were identified by Bayliss et al. (2011b), who were able to measure spectroscopic redshifts for two of them. Source A, which has two images, is a Lyα emitter at  = 4.131. Source B is at
  = 1.1778. Source C was targeted for spectroscopy, but the observation did not yield a redshift. With the HST data, we find that A.1 is buried in the light of a foreground galaxy; we do not identify a third image for this source. We find two counter-images for arc B, and obtained spectroscopic confirmation with Magellan using the LDSS3 long-slit on 2013 May 2. From the lensing analysis, we conclude that the arc identified as B1 by Bayliss et al. (2011b) is a merging pair of two partial images, whereas the other two images are complete. We relabel B1 as 2.1 and 2.2, and the complete images are 2.3 and 2.4. The region of highest surface brightness in 2.3 and 2.4 falls outside of the caustic, and thus is not seen in the merging pair 2.1–2.2. We use three distinct features in this galaxy as constraints—the bright core of the galaxy in 2.3 and 2.4, a dark dust lane, and a blue region that appears clearly in all the images. There is no robust identification of a counter image for C; we therefore do not use it as a constraint in the lens model. Its elongation and curvature suggest that it is lensed. From the best-fit model, this arc could be a merging pair straddling the critical curve at z ∼ 2.4, with a counter image near R.A., decl. = [245.3811204, 6.123205304]. We identify a few plausible candidate images within 2″ of this location. This interpretation is consistent with the conclusion of Bayliss et al. (2011b), that arc C is likely in the “redshift desert,” based on the lack of emission lines in its Gemini/GMOS spectrum. The lens model is consistent with the velocity dispersion that we measure from our IMACS MOS observation (Table 2), supplemented with the redshifts reported by Bayliss et al. (2011b). The model is well constrained and classified in category A.
4.3.34. SDSS J1632+3500
This field displays two giant arcs, approximately 15″ east and west of the cluster core. Spectroscopic redshifts were obtained from Gemini North GMOS observations in 2012 April 15 for the two sources: source 1 at  = 1.235, and source 2 at
  = 2.265. The spectrum of the bright region in the eastern giant arc indicates the possible presence of an AGN, inferred from He i emission. The same Gemini observations secure spectroscopic redshift of a star-forming galaxy that is likely a cluster member, projected to be near the cluster core, with somewhat large velocity offset from the mean (
 = 0.454 and
  = 0.466, respectively), but within 2.5σ of the projected velocity dispersion. Other background, foreground, and cluster members with spectroscopic redshift measurement are listed in Tables 9 and 11. Our HST imaging data confirm that the two giant arcs are extremely distorted lensed images; however, no counter-images are identified. We used the extended shape of the giant arcs as constraints in the lens model. In both cases, the brightest part of the galaxy (i.e., the galaxy core) lies outside of the lensing caustic and thus are singly imaged. Two other possible lensed systems are identified and their positions are used as constraints in the lens model; their redshifts are left as free parameters. The mass model is well constrained by the two giant arcs. However, the lensing magnification of the giant arcs has high uncertainty due to its close proximity to the critical curve, where small variations in the model result in large change in magnification. We therefore classify the model in the B category. Spectroscopic confirmation of the two lensed candidates is likely to improve the model.
4.3.35. SDSS J1723+3411
The bright arc in this field is one of the brightest lensed galaxies known to date, at  = 1.3294 ± 0.0002 Kubo et al. (2010). The source is lensed into five images, two of which merge to form the bright arc, images 1.1 and 1.2. The third and fourth images, 1.3 and 1.4, are easily identified, and the fifth is a demagnified image near the core of the BCG, 1.5. Since the BCG light drops out from our bluest HST filter, the fifth image is is clearly identified 0
3 from the center of the galaxy. We identify four images of a likely galaxy pair, labeled as sources 2 and 3. A redshift for source 2 was measured from HST grism data (GO-14230, PI: Rigby),
 = 2.165 based on [O iii] 4959, 5007 Å emission lines. We were unable to derive a redshift for source 3. The lens model published here assumes that source 3 is at the same redshift as source 2; we have computed models that leave this redshift as a free parameter, and these models are indistinguishable from the one with a fixed redshift for source 3. A distorted red galaxy east of the images 2.2 and 3.2 is likely a single image. The model is well constrained and labeled as A.
Interestingly, the HST data reveal a dust lane in the light of the BCG, indicating possible recent star formation (e.g., Cooke et al. 2016).
4.3.36. SDSS J2111−0114
Carrasco et al. (2017) obtained spectroscopy of 46 cluster members in this field from the Very Large Telescope. In calculating the cluster redshift and velocity dispersion (Table 2), we add to these measurements six additional redshifts for cluster members from Bayliss et al. (2011b). The spectroscopic redshift of the main arc,  = 2.858, is adopted from Bayliss et al. (2011b). The strong-lensing constraints in this field are the main arc and two other candidate systems, all of which are in naked-cusp configuration. Since all the lensing constraints appear south of the BCG, this field is underconstrained on the north side. We therefore classify this model in category B. The lens model is in good agreement with the observed velocity dispersion.
4.3.37. SDSS J2243−0935
The primary arc in this field is an elongated arc at  = 2.09 (Bayliss et al. 2011b). Rigby et al. (2018b) report that the lensed source hosts a broad-line AGN, based on broad rest-frame UV emission lines. This interpretation is confirmed by the morphology of this galaxy in the HST imaging, which shows a point-source embedded in a spatially extended host (labeled 1.1 in Figure 7). This straight arc is located 52″ east of the core of the cluster, in the direction to a prominent group of cluster-member galaxies. This lensing morphology, showing an arc with minimal or no curvature, is typically found in cluster mergers or bimodal distribution when arcs form in the region between two dominant halos. We find that the morphology of this arc is also affected by a small cluster-member galaxy projected on the line of sight, resulting in multiple images of a few of the emission knots in the host galaxy.
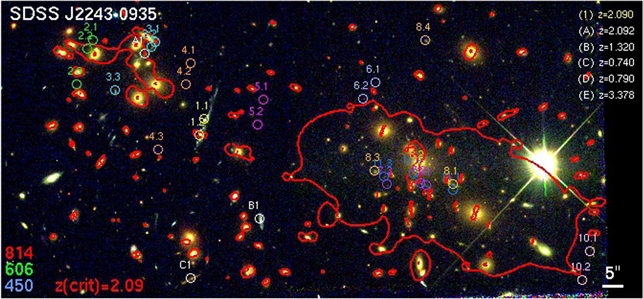
Figure 7. Same as Figure 1, for the cluster SDSS J2243−0935. The coordinates, redshifts, and references are tabulated in Table 10.
Download figure:
Standard image High-resolution imageThe F390W imaging data reveal a faint point-source embedded in the light of the cluster galaxy, separated from its core, likely a counter image of the AGN nucleus (labeled 1.2). One of the MagE slits in the observations of Rigby et al. (2018b) partially covers this source. A careful extraction and inspection of the two-dimensional spectrum at the position of the candidate counter image suggest faint emission from this region; however, the signal-to-noise ratio is not sufficient to spectroscopically confirm it as a counter image of the nucleus. The AGN (1.1) clearly appears as an X-ray point source in archival Chandra observations of this field, detected at 7.5σ above the background. The X-ray emission from the positions of the optical point source (1.2) is detected at 2.2σ above the background, confirming that it is likely a counter image of the AGN.
We identify several other multiply imaged lensed galaxies around the west (main) and east (secondary) halos of this cluster core that help constrain the lens model. However, spectroscopic observations with the IMACS instrument on the Magellan Baade telescope, targeting the lensed images, did not yield redshifts for these multiple-image families. Source 3 appears close to a source that was observed by Bayliss et al. (2011b) to be at  = 2.092; however, the color and morphology of this source are not consistent with the sources identified as multiply imaged, and we therefore conservatively leave the redshift of source 3 as a free parameter. Several instances of galaxy–galaxy lensing are identified within the HST field of view, owing to the overall high projected mass density in this region of the sky. We note these identifications, as well as the lensing constraints, in Table 10.
The lack of spectroscopic redshifts of multiply imaged lensed galaxies leave this cluster underconstrained. The redshifts of all but source 1 are left as free parameters. However, to improve the accuracy of the lens model and avoid catastrophic solutions we place priors on the redshift parameter of the most prominent arcs in each subhalo, informed by their photometric redshifts. These are source #2 near the east halo, with photometric redshifts measured from images 2.1 and 2.3, and source #8 near the west halo, with photometric redshifts measured from images 8.1 and 8.3. We use the photometric redshift posterior distribution to inform our redshift priors,  and 2.95 < z8 < 3.05.
This cluster was independently identified via its X-ray signal by Ebeling et al. (2010) and is also known as MACS J2243−09. Schirmer et al. (2011) use weak lensing to map the cosmic web around this cluster and report on the filamentary structure around it. They report a mass of 
 within
  Mpc. Our strong-lensing analysis estimates that the mass within 500 kpc is
 . Although highly uncertain due to the lack of spectroscopic redshifts, this mass estimate is consistent with the weak lensing measurement. We classify this model as A–. Its fidelity can be improved by securing spectroscopic redshifts of some of the lensed galaxies.
5. Discussion
In this paper, we assign a subjective qualitative assessment to each model, based on the availability and distribution of constraints, availability of spectroscopic redshifts, and ability of the lens model to consistently reproduce the lensing constraints. As we note in Section 4.3, the literature often quantifies the relative quality of lens models by quoting the rms of the scatter between the observed and model-predicted image-plane locations of lensed images (image plane rms, or rmsi). However, while the rmsi provides a useful comparative goodness-of-fit when assessing different models that use the same constraints, it may be misleading, especially in underconstrained systems. A comparison between the quality categories and the best-fit model rmsi is shown in Figure 8. As expected, the rmsi is not a good predictor of the subjective quality categories. Models in category A span a large range of image plane rms, between 01 and 0
65. On the other hand, some of the poor models with few constraints appear to have very small rmsi (rmsi < 0
2), which does not encompass the systematic sources of model error. Johnson & Sharon (2016) explore this behavior using simulated data and show that the rmsi is not a predictor of model quality when considering models with different numbers of constraints: while the accuracy and precision of magnification and mass improves with larger number of constraints, the rmsi becomes worse; this is due to the finite flexibility of most lens-modeling algorithms. We therefore encourage the user to consider the noted strengths and shortcomings of each model, given in Section 4.3, when using the lens model outputs.
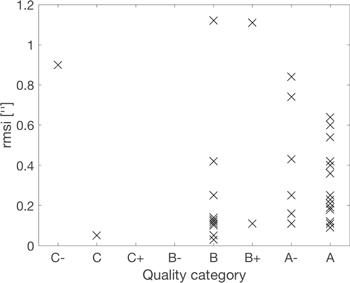
Figure 8. Comparison of image plane rms (rmsi) and the qualitative model quality assessment. We find that the rmsi is not a good indicator of model quality.
Download figure:
Standard image High-resolution imageWe estimate the effective Einstein radius of each cluster,  , the radius of a circle with the same area A enclosed by the tangential critical curve for a source at redshift zs = 2, and tabulate them in Table 2. The effective Einstein radius correlates with the area in which strong lensing can occur around each lens, and depends primarily on the mass enclosed in the core of the cluster. From the lens models presented in this work, we find that the SGAS-HST clusters span a large range of effective Einstein radii,
  , with a median
  . Notably,
  does not correlate with the total mass of the cluster (estimated from their velocity dispersion as M200), as can be seen in Figure 9. A more comprehensive analysis of indicators of lensing strength, extending beyond this strong-lensing sample, will be presented in a future paper (C. Fox et al. 2020, in preparation). Since strong-lensing measures the projected mass density at the core of the cluster, combining strong lensing with a mass estimate at the outskirts can put constraints on the slope of the mass profile and can measure its concentration (e.g., Gralla et al. 2011; Oguri et al. 2012; Merten et al. 2015). An investigation of the concentration–mass relation in a large sample of strong-lensing clusters is underway (J. Remolina González et al. 2020, in preparation).
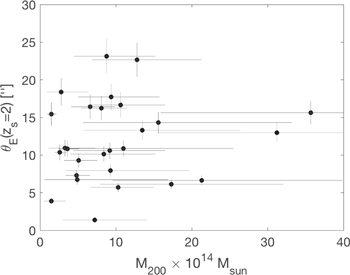
Figure 9. Comparison the effective Einstein radii and the dynamical mass M200 (Table 2) shows no correlation between the two; see Section 5. The uncertainties on the Einstein radii are estimated at 10%.
Download figure:
Standard image High-resolution image6. Summary
We present strong lens models for 37 galaxy clusters from the SGAS Large HST program, GO-13003. The lens models are constrained by positions of multiply imaged lensed galaxies that were uniquely identified in the HST imaging. We measured spectroscopic redshifts for lensed galaxies from data obtained with Magellan, Gemini, APO, and HST. The lensing constraints that were used in this work, including image positions and redshifts from this work and from the literature, are listed in the Appendix.
Magnification from strong-lensing clusters of galaxies enables studies of the magnified sources behind them. The magnification boost increases the observed brightness of the background galaxies, leading to higher signal-to-noise ratio per unit time of spectroscopic observations, allowing us to study galaxies that would otherwise require an unrealistic amount of observing time with current facilities. The lensing distortion increases the observed spatial resolution of the background source, which enables studies of star formation on spatial scales as small as a few tens of parsecs at cosmic noon.
In order to take full advantage of the lensing magnification in analyzing the background galaxies, one needs to incorporate the information from lens models. Once the properties of the foreground lens are properly modeled, the derived lens model outputs are used in order to convert the observed measurements of background sources to their intrinsic ones. The deflection maps are used to ray-trace the light from the image plane to the source plane, and thus reconstruct the undistorted image of the source galaxy. They are used to determine the morphology of the source and measure or constrain the spatial extent of substructure within the source. The magnification, which may vary significantly along giant arc-like images in the image plane, linearly converts between lensed and unlensed luminosity, and properties that are derived from it (i.e., star formation rate, stellar mass).
With this publication, we release the lens model outputs of each field. The availability of constraints in each field varies, and depends not only on the lensing strength of the foreground cluster, but also on the extent of follow-up observations, depth of the available data, spatial distribution of constraints, and in many cases, fortuitous alignment between the sources and the lens. A description of the models and an assessment of their reliability are given in this paper. The lensing outputs are specific to the redshifts in the system, but can be converted to any source redshift; the equations needed for this conversion can be found in Johnson et al. (2014, Section 4.3). We also provide a set of model outputs computed from the MCMC process, from which uncertainties can be estimated. The public models were generated and tested for compatibility with Lenstool version 7.1. The high-level data products and reduced HST imaging data are hosted on the Multimission Archive at the Space Telescope Science Institute (MAST),18 and can be accessed via doi:10.17909/t9-cqtj-y020.
Support for HST program GO-13003 was provided by NASA through a grant from the Space Telescope Science Institute, which is operated by the Association of Universities for Research in Astronomy, Inc., under NASA contract NAS 5-26555. Based on observations made with the NASA/ESA Hubble Space Telescope, obtained at the Space Telescope Science Institute, which is operated by the Association of Universities for Research in Astronomy, Inc., under NASA contract NAS 5-26555. These observations are associated with programs GO-13003, GO-14622, GO-14230, GO-14896. Some of the data presented in this paper were obtained from the Multimission Archive at the Space Telescope Science Institute (MAST). These data are associated with programs GO-11974, GO-11100. K.S. acknowledges support from the University of Michigan’s President’s Postdoctoral Fellowship. K.E.W. gratefully acknowledge support by NASA through Hubble Fellowship grant #HF2-51368 awarded by the Space Telescope Science Institute, which is operated by the Association of Universities for Research in Astronomy, Inc., for NASA. M.B.B. acknowledge support by NASA through grant HST-GO-14896-01. H.D. acknowledges support from the Research Council of Norway. Based on observations obtained at the Gemini Observatory, which is operated by the Association of Universities for Research in Astronomy, Inc., under a cooperative agreement with the NSF on behalf of the Gemini partnership: the National Science Foundation (United States), the National Research Council (Canada), CONICYT (Chile), the Australian Research Council (Australia), Ministério da Ciência, Tecnologia e Inovação (Brazil) and Ministerio de Ciencia, Tecnología e Innovación Productiva (Argentina). This paper includes data gathered with the 6.5 m Magellan Telescopes located at Las Campanas Observatory, Chile. Observations reported here were obtained at the MMT Observatory, a joint facility of the University of Arizona and the Smithsonian Institution. This work makes use of the Matlab Astronomy Package (Ofek 2014). We thank the anonymous referee for their thoughtful review of this manuscript
Appendix A: Lensing Constraints
This appendix tabulates the identified multply imaged lensed sources in each field. For each source, we list the coordinates of the observed images and of emission knots within these image that were used as lensing constraints. Where available, we list the spectroscopic or photometric redshift of the background source. The coordinates and redshifts of other foreground or background sources are given as well.
Tables 4–10 correspond to Figures 1–7. (Tables 4, 5, 6, 7, 8, 9, and 10 correspond to Figures 1, 2, 3, 4, 5, 6, and 7, respectively.)
Table 4. List of Lensing Constraints for Clusters Shown in Figure 1
| ID | R.A. | Decl. | zspec | zspec | Notes |
|---|---|---|---|---|---|
| J2000 | J2000 | Reference | |||
| SDSS J0004−0103 | |||||
| 1.1 | 1.215462 | −1.055917 | 1.681 | Rigby+18 | |
| 1.2 | 1.215350 | −1.055859 | |||
| 1.3 | 1.214755 | −1.055367 | |||
| 1a.1 | 1.215583 | −1.055996 | |||
| 1a.2 | 1.215140 | −1.055762 | |||
| 1a.3 | 1.214867 | −1.055521 | |||
| 1b.1 | 1.215821 | −1.055905 | |||
| 1b.2 | 1.215276 | −1.055667 | |||
| 1b.3 | 1.214801 | −1.055190 | |||
| 1 c.1 | 1.214795 | −1.055314 | |||
| 1 c.2 | 1.215224 | −1.055719 | |||
| 1 c.3 | 1.215689 | −1.055942 | |||
| 1d.1 | 1.215385 | −1.055875 | |||
| 1d.2 | 1.215428 | −1.055900 | |||
| SDSS J0108+0624 | |||||
| 1.1 | 17.174978 | 6.412078 | 1.91 | Rigby+18 | |
| 1.2 | 17.176051 | 6.412092 | |||
| 1a.1 | 17.175900 | 6.412684 | |||
| 1a.2 | 17.175025 | 6.412060 | |||
| 1b.1 | 17.175964 | 6.412493 | |||
| 1b.2 | 17.174992 | 6.412063 | |||
| 1 c.1 | 17.174932 | 6.412091 | |||
| 1 c.2 | 17.176030 | 6.411886 | |||
| SDSS J0146−0929 | |||||
| 1.1 | 26.736156 | −9.496396 | 1.9436 | This work, FIRE; Stark+13 | |
| 1.2 | 26.730240 | −9.495975 | |||
| 1.3 | 26.730774 | −9.495248 | |||
| 1.4 | 26.733138 | −9.501209 | |||
| 1.5 | 26.730610 | −9.499755 | |||
| 11.1 | 26.736201 | −9.496491 | |||
| 11.2 | 26.730257 | −9.495890 | |||
| 11.3 | 26.730918 | −9.495014 | |||
| 12.1 | 26.736238 | −9.496558 | |||
| 12.2 | 26.730315 | −9.495800 | |||
| 12.3 | 26.730955 | −9.494963 | |||
| 12.4 | 26.733018 | −9.501201 | |||
| 13.1 | 26.736386 | −9.496849 | |||
| 13.2 | 26.730378 | −9.495644 | |||
| 13.3 | 26.731003 | −9.494875 | |||
| 14.1 | 26.736177 | −9.496564 | |||
| 14.2 | 26.730148 | −9.496054 | |||
| 2.1 | 26.733406 | −9.495280 | 2.3660 | This work, IMACS | |
| 2.2 | 26.734766 | −9.502288 | |||
| 2.3 | 26.733561 | −9.497364 | Candidate | ||
| 21.1 | 26.733440 | −9.495278 | |||
| 21.2 | 26.734715 | −9.502318 | |||
| E | 26.73471004 | −9.502603976 | 0.7962 | This work, IMACS | Single image, near 2.2 |
| D | 26.72841422 | −9.493789352 | 2.6623 | This work, IMACS | Single image |
| G | 26.72786667 | −9.498882957 | 0.4485 | This work, IMACS | Single image |
| SDSS J0150+2725 | |||||
| 1.1 | 27.505066 | 27.426420 | 1.0800 | This work, APO | 2012 Jan 20 |
| 1.2 | 27.504752 | 27.426018 | |||
| 1.3 | 27.503328 | 27.425350 | |||
| 1.5 | 27.503476 | 27.426849 | |||
| 11.1 | 27.505501 | 27.427167 | |||
| 11.2 | 27.503379 | 27.426822 | |||
| 2.1 | 27.509517 | 27.426914 | ⋯ | ||
| 2.2 | 27.508971 | 27.425031 | |||
| SDSS J0333−0651 | |||||
| 1.1 | 53.271663 | −6.856274 | 1.5700 | This work, FIRE | Possibly single image |
| 1.2 | 53.270623 | −6.854172 | |||
| 2.1 | 53.268675 | −6.862509 | ⋯ | Galaxy–galaxy lensing | |
| 2.2 | 53.268182 | −6.862460 | |||
| 3.1 | 53.267530 | −6.854139 | ⋯ | Candidate | |
| 3.2 | 53.269571 | −6.854654 | Candidate | ||
| 4.1 | 53.265041 | −6.856527 | ⋯ | Candidate | |
| 4.2 | 53.265125 | −6.857559 | Candidate | ||
| 4.3 | 53.266938 | −6.859791 | Candidate | ||
| SDSS J0851+3331 | |||||
| B.1 | 132.908460 | 33.517522 | 1.3454 | Bayliss+11 | |
| B.2 | 132.908210 | 33.518601 | |||
| B.3 | 132.914270 | 33.523888 | |||
| B.4 | 132.912760 | 33.517752 | Candidate radial arc | ||
| B1.1 | 132.908500 | 33.517410 | |||
| B1.2 | 132.908200 | 33.518789 | |||
| D.1 | 132.909040 | 33.521854 | 1.79 | GO-14622, PI: Whitaker | |
| D.2 | 132.908460 | 33.515032 | |||
| D.3 | 132.914680 | 33.517739 | |||
| D.4 | 132.914390 | 33.523319 | |||
| D.5 | 132.912310 | 33.518961 | |||
| D1.1 | 132.909056 | 33.521854 | |||
| D1.2 | 132.908477 | 33.515017 | |||
| D1.3 | 132.914686 | 33.517705 | |||
| D1.4 | 132.914439 | 33.523272 | |||
| D1.5 | 132.912316 | 33.519003 | |||
| E.1 | 132.915050 | 33.512978 | 1.88 | GO14622, PI: Whitaker | |
| E.2 | 132.915260 | 33.513197 | |||
| E.3 | 132.916770 | 33.513843 | |||
| E.4 | 132.915660 | 33.512927 | |||
| E.5 | 132.916314 | 33.513417 | Candidate partial image | ||
| E1.1 | 132.915090 | 33.513014 | |||
| E1.2 | 132.915220 | 33.513155 | |||
| E1.3 | 132.916820 | 33.513869 | |||
| A | 132.904550 | 33.520420 | 1.6926 | Bayliss+11 | Single image |
| C | 132.917233 | 33.522550 | 1.2539 | Bayliss+11 | Single image |
Note. Lensing constraints and other background or foreground galaxies with spectroscopic redshifts in the fields of SGAS-HST clusters SDSS J0004−0103, SDSS J0108+0624, SDSS J0146−0929, SDSS J0150+2725, SDSS J0333−0651, and SDSS J0851+3331. The IDs of images of lensed galaxies are labeled as  where A is a number or a letter indicating the source ID (or system name); B is a number or a letter indicating the ID of the emission knot within the system; and X is a number indicating the ID of the lensed image within the multiple-image family.
References. Rigby et al. (2018b), Stark et al. (2013), Bayliss (2012), Bayliss et al. (2010, 2011b, 2014b), Kubo et al. (2010), Johnson et al. (2017b), Ofek et al. (2008), Diehl et al. (2009).
A machine-readable version of the table is available.
Table 5. List of Lensing Constraints for Clusters Shown in Figure 2
| ID | R.A. | Decl. | zspec | zspec | Notes |
|---|---|---|---|---|---|
| J2000 | J2000 | Reference | |||
| SDSS J0915+3826 | |||||
| A.1 | 138.908560 | 38.450062 | 1.5010 | Bayliss+10,11 | |
| A.2 | 138.909080 | 38.451231 | |||
| A.3 | 138.910690 | 38.452942 | |||
| Aa.1 | 138.910780 | 38.452817 | |||
| Ab.2 | 138.908530 | 38.449497 | |||
| Ab.3 | 138.910140 | 38.452420 | |||
| Ac.1 | 138.908590 | 38.448827 | |||
| Ac.2 | 138.910780 | 38.452575 | |||
| Ac.3 | 138.909643 | 38.451724 | |||
| B.1 | 138.920960 | 38.448191 | 5.2000 | Bayliss+10,11 | |
| B.2 | 138.921280 | 38.449322 | |||
| B.3 | 138.917120 | 38.443534 | |||
| SDSS J0928+2031 | |||||
| 1 | 142.018470 | 20.532302 | 1.8910 | This work, FIRE | |
| 2.1 | 142.019460 | 20.527312 | 0.8555 | This work, GMOS | |
| 2.2 | 142.018810 | 20.527153 | |||
| 2.3 | 142.021730 | 20.529145 | |||
| 3.1 | 142.021720 | 20.528090 | 1.3327 | This work, GMOS | |
| 3.2 | 142.021500 | 20.527861 | |||
| 3.3 | 142.017040 | 20.526253 | |||
| 4.1 | 142.023490 | 20.526590 | ⋯ | Candidate | |
| 4.2 | 142.023160 | 20.526368 | |||
| 4.3 | 142.020190 | 20.524736 | |||
| 5.1 | 142.027803 | 20.519392 | ⋯ | Candidate radial arc near south halo | |
| B | 142.025835 | 20.522019 | 0.8563 | This work, GMOS | Single distorted image near south core |
| C | 142.014117 | 20.533593 | 1.8806 | This work, FIRE | Single image |
| D | 142.023744 | 20.513353 | 1.9020 | This work, FIRE | Single image |
| E | 142.024390 | 20.519945 | 0.8565 | This work, GMOS | Single image |
| SDSS J0952+3434 | |||||
| 1.1 | 148.167560 | 34.577362 | 2.1900 | Kubo+10 | |
| 1.2 | 148.168350 | 34.577527 | |||
| 2.1 | 148.164870 | 34.576523 | ⋯ | ||
| 2.2 | 148.170630 | 34.578348 | |||
| 2.3 | 148.171320 | 34.582908 | |||
| 3.1 | 148.166930 | 34.578496 | ⋯ | ||
| 3.2 | 148.166430 | 34.578438 | |||
| 4.1 | 148.168820 | 34.581285 | ⋯ | ||
| 4.2 | 148.168810 | 34.581105 | |||
| SDSS J0957+0509 | |||||
| 1.1 | 149.411832 | 5.156988 | 1.8210 | Bayliss+11 | |
| 1.2 | 149.411235 | 5.157918 | |||
| 1.3 | 149.410998 | 5.158717 | |||
| 1.4 | 149.411013 | 5.159312 | |||
| 1.5 | 149.411191 | 5.158897 | |||
| 1.6 | 149.410982 | 5.158763 | |||
| 2.1 | 149.412957 | 5.160956 | ⋯ | ||
| 2.2 | 149.414378 | 5.159153 | |||
| 2.3 | 149.414307 | 5.156947 | |||
| 2.4 | 149.412930 | 5.158728 | |||
| 3.1 | 149.412476 | 5.160714 | ⋯ | ||
| 3.2 | 149.413997 | 5.159112 | |||
| 3.3 | 149.413951 | 5.156746 | |||
| 3.4 | 149.412504 | 5.158557 | |||
| SDSS J1002+2031 | |||||
| 1.1 | 150.607950 | 20.516451 | 0.985 | This work, GMOS | Giant arc |
| 1.2 | 150.610894 | 20.509550 | ⋯ | Candidate counter image | |
| A | 150.607010 | 20.518948 | 1.270 | This work, GMOS | Single image |
| B | 150.619170 | 20.523185 | 1.169 | This work, GMOS | Single image |
| C | 150.619715 | 20.517718 | 0.734 | This work, GMOS | Single image |
| D | 150.596254 | 20.514684 | 0.654 | This work, GMOS | Single image |
| SDSS J1038+4849 | |||||
| Aa.1 | 159.676917 | 48.825040 | 2.198 | Bayliss+11 | A in Bayliss+11 |
| Aa.2 | 159.675061 | 48.823981 | |||
| Aa.3 | 159.674008 | 48.821871 | |||
| Aa.4 | 159.682485 | 48.821117 | |||
| Ab.1 | 159.676659 | 48.824781 | |||
| Ab.2 | 159.676111 | 48.824502 | |||
| Ab.3 | 159.674327 | 48.820902 | |||
| Ab.4 | 159.682786 | 48.821117 | |||
| Ba.1 | 159.683319 | 48.822281 | 0.9652 | Bayliss+11 | B in Bayliss+11 |
| Ba.2 | 159.683427 | 48.821341 | |||
| Ba.3 | 159.682014 | 48.820000 | |||
| Bb.1 | 159.683632 | 48.821441 | |||
| Bb.2 | 159.683631 | 48.821830 | |||
| Bb.3 | 159.682515 | 48.820109 | |||
| C.1 | 159.676358 | 48.820663 | 2.7830 | Bayliss+11 | C in Bayliss+11 |
| C.2 | 159.677509 | 48.819994 | |||
| C.3 | 159.679320 | 48.819666 | |||
| C.4 | 159.682720 | 48.825398 | |||
| Ca.1 | 159.676575 | 48.820271 | |||
| Ca.2 | 159.675840 | 48.820938 | |||
| Ca.4 | 159.682460 | 48.825365 | |||
| Cb.1 | 159.676223 | 48.820798 | |||
| Cb.2 | 159.678027 | 48.819816 | |||
| Cb.3 | 159.679071 | 48.819662 | |||
| E.1 | 159.676264 | 48.821019 | ⋯ | ||
| E.2 | 159.683006 | 48.825364 | |||
| Fa.1 | 159.680013 | 48.820036 | ⋯ | ||
| Fa.2 | 159.682045 | 48.825450 | |||
| Fb.1 | 159.680118 | 48.820050 | ⋯ | ||
| Fb.2 | 159.681968 | 48.825473 | |||
| D | 159.678666 | 48.818142 | 0.8020 | Bayliss+11 | Single image |
Note. Lensing constraints and other background or foreground galaxies with spectroscopic redshifts in the fields of SGAS-HST clusters SDSS J0915+3826, SDSS J0928+2031, SDSS J0952+3434, SDSS J0957+0509, SDSS J1002+2031, and SDSS J1038+4849. The IDs of images of lensed galaxies are labeled as  where A is a number or a letter indicating the source ID (or system name); B is a number or a letter indicating the ID of the emission knot within the system; and X is a number indicating the ID of the lensed image within the multiple-image family.
References. Rigby et al. (2018b), Stark et al. (2013), Bayliss (2012), Bayliss et al. (2010, 2011b, 2014b), Kubo et al. (2010), Johnson et al. (2017b), Ofek et al. (2008), Diehl et al. (2009).
A machine-readable version of the table is available.
Table 6. List of Lensing Constraints for Clusters Shown in Figure 3
| ID | R.A. | Decl. | zspec | zspec | Notes |
|---|---|---|---|---|---|
| J2000 | J2000 | Reference | |||
| SDSS J1050+0017 | |||||
| A.1 | 162.668160 | 0.280149 | 2.4040 | Bayliss+14 | |
| A.2 | 162.666250 | 0.286671 | |||
| B.1 | 162.663000 | 0.282145 | ⋯ | ||
| B.2 | 162.672260 | 0.285115 | |||
| B.3 | 162.665830 | 0.289216 | |||
| B.4 | 162.664060 | 0.281483 | |||
| D.1 | 162.659930 | 0.287493 | 4.8700 | Bayliss+14 | |
| D.2 | 162.665880 | 0.291141 | |||
| D.3 | 162.672950 | 0.288075 | |||
| D.4 | 162.666960 | 0.280862 | |||
| C.1 | 162.664160 | 0.291329 | 3.6250 | Bayliss+14 | |
| C.2 | 162.665070 | 0.291628 | |||
| C.3 | 162.672400 | 0.289762 | |||
| C.4 | 162.666086 | 0.281812 | |||
| E.1 | 162.669020 | 0.283582 | ⋯ | ||
| E.2 | 162.660530 | 0.287685 | |||
| F.1 | 162.667300 | 0.285000 | ⋯ | ||
| F.2 | 162.660050 | 0.291583 | |||
| SDSS J1055+5547 | |||||
| A.1 | 163.764788 | 55.802890 | 1.2500 | Bayliss+11 | |
| A.2 | 163.769380 | 55.802066 | |||
| A.3 | 163.770840 | 55.802015 | |||
| A.4 | 163.775825 | 55.802779 | |||
| B.1 | 163.772724 | 55.802923 | 0.9360 | Bayliss+11 | |
| B.2 | 163.771971 | 55.802880 | |||
| B.3 | 163.769481 | 55.802571 | |||
| Ba.1 | 163.772510 | 55.802923 | |||
| Ba.2 | 163.772229 | 55.802893 | |||
| Ba.3 | 163.769323 | 55.802577 | |||
| D.1 | 163.761436 | 55.809967 | ⋯ | D in Bayliss+11 | |
| D.2 | 163.766349 | 55.811872 | |||
| 5.1 | 163.777241 | 55.811158 | ⋯ | ||
| 5.2 | 163.776207 | 55.811533 | |||
| 6.1 | 163.775678 | 55.799939 | |||
| 6.2 | 163.771550 | 55.799350 | |||
| C | 163.776906 | 55.808742 | 0.777 | Bayliss+11 | Single image |
| SDSS J1110+6459 | |||||
| A.1 | 167.581480 | 64.999411 | 2.4812 | Johnson+17, Stark+13 | |
| A.2 | 167.583170 | 64.997795 | |||
| A.3 | 167.582980 | 64.995273 | |||
| B.1 | 167.575130 | 64.999798 | ⋯ | ||
| B.2 | 167.580210 | 64.997948 | |||
| B.3 | 167.578800 | 64.993072 | |||
| B.4 | 167.571270 | 64.996332 | |||
| B.5 | 167.573070 | 64.996565 | |||
| C.1 | 167.568090 | 64.998147 | ⋯ | ||
| C.2 | 167.567230 | 64.996781 | |||
| C.3 | 167.573630 | 64.992252 | Candidate | ||
| 4.1 | 167.582030 | 64.999212 | ⋯ | ||
| 4.2 | 167.583280 | 64.997903 | |||
| 4.3 | 167.583280 | 64.995456 | |||
| 5.1 | 167.581910 | 64.999308 | ⋯ | ||
| 5.2 | 167.583400 | 64.997748 | |||
| 5.3 | 167.583360 | 64.995603 | |||
| 6.1 | 167.581760 | 64.999396 | ⋯ | ||
| 6.2 | 167.583470 | 64.997575 | |||
| 6.3 | 167.583400 | 64.995701 | |||
| J | 167.577020 | 64.999612 | 0.6447 2 | Johnson+17 | “Jellyfish” galaxy |
| SDSS J1115+1645 | |||||
| 1.1 | 168.767840 | 16.758996 | 1.7170 | Stark+13 | |
| 1.2 | 168.769390 | 16.758679 | |||
| 1.3 | 168.767450 | 16.759129 | |||
| 2.1 | 168.768650 | 16.757464 | 3.4630 | Bayliss+12 | |
| 2.2 | 168.769810 | 16.757478 | |||
| SDSS J1138+2754 | |||||
| A.1 | 174.539460 | 27.912498 | 1.3340 | Bayliss+11 | |
| A.2 | 174.536280 | 27.912373 | |||
| A.3 | 174.533020 | 27.910710 | |||
| B.1 | 174.538084 | 27.910779 | 0.9090 | ||
| B.2 | 174.537286 | 27.910748 | |||
| B.3 | 174.534447 | 27.909638 | |||
| C.1 | 174.536764 | 27.914191 | 1.4550 | Bayliss+11 | Single image |
| D.1 | 174.542160 | 27.903572 | ⋯ | This work |

|
| D.2 | 174.540960 | 27.903079 | |||
| D.3 | 174.532440 | 27.902590 | |||
| E.1 | 174.540057 | 27.912498 | ⋯ | ||
| E.2 | 174.538768 | 27.912722 | |||
| E.3 | 174.529624 | 27.909298 | Candidate | ||
| SDSS J1152+0930 | |||||
| 1.1 | 178.197480 | 9.508144 | 2.2400 | This work, IMACS | D1,D2 in Bayliss+11 |
| 1.2 | 178.196754 | 9.508056 | |||
| 1.3 | 178.196378 | 9.507894 | |||
| 1.4 | 178.194424 | 9.506574 | |||
| 2.1 | 178.200403 | 9.502987 | ⋯ | C1 in Bayliss+11 | |
| 2.2 | 178.199381 | 9.501804 | |||
| 2.3 | 178.198991 | 9.501391 | |||
| 2.4 | 178.197409 | 9.500721 | |||
| 3 | 178.195447 | 9.504058 | 0.8945 | This work, IMACS; Bayliss+11 | Single image; A2 in Bayliss+11 |
| 4 | 178.200080 | 9.502489 | 0.893 | This work, IMACS; Bayliss+11 | Single image; A3 in Bayliss+11 |
| 5 | 178.195037 | 9.501626 | 0.893 | Bayliss+11 | Single image; A1 in Bayliss+11 |
| 6 | 178.195959 | 9.498743 | 0.1520 | This work, IMACS | Foreground |
| 7 | 178.196645 | 9.498887 | 0.2790 | This work, IMACS | Foreground |
Note. Lensing constraints and other background or foreground galaxies with spectroscopic redshifts in the fields of SGAS-HST clusters SDSS J1050+0017, SDSS J1055+0017, SDSS J1110+6459, SDSS J1115+1645, SDSS J1138+2754, and SDSS J1152+0930. The IDs of images of lensed galaxies are labeled as  where A is a number or a letter indicating the source ID (or system name); B is a number or a letter indicating the ID of the emission knot within the system; and X is a number indicating the ID of the lensed image within the multiple-image family.
References. Rigby et al. (2018b), Stark et al. (2013), Bayliss (2012), Bayliss et al. (2010, 2011b, 2014b), Kubo et al. (2010), Johnson et al. (2017b), Ofek et al. (2008), Diehl et al. (2009).
A machine-readable version of the table is available.
Table 7. List of Lensing Constraints for Clusters Shown in Figure 4
| ID | R.A. | Decl. | zspec | zspec | Notes |
|---|---|---|---|---|---|
| J2000 | J2000 | Reference | |||
| SDSS J1152+3313 | |||||
| A.1 | 177.998849 | 33.227292 | 2.4910 | Bayliss+11 | |
| A.2 | 178.000309 | 33.226344 | |||
| A.3 | 177.999189 | 33.230220 | |||
| A.4 | 178.002384 | 33.228415 | |||
| A.5 | 178.003857 | 33.228260 | |||
| A.6 | 178.000963 | 33.228431 | |||
| A1.1 | 177.998621 | 33.227558 | |||
| A1.2 | 178.000112 | 33.226334 | |||
| A1.3 | 177.998987 | 33.230023 | |||
| A1.4 | 178.002341 | 33.228479 | |||
| A1.5 | 178.003788 | 33.228307 | |||
| A2.1 | 177.998551 | 33.227699 | |||
| A2.2 | 178.000171 | 33.226303 | |||
| A2.3 | 177.998930 | 33.229947 | |||
| A3.2 | 178.000151 | 33.226193 | |||
| A3.3 | 177.998534 | 33.229282 | |||
| A3.4 | 178.002320 | 33.228598 | |||
| A3.6 | 178.001038 | 33.228632 | |||
| A4.2 | 177.999190 | 33.226691 | |||
| A4.3 | 177.998617 | 33.229571 | |||
| A4.4 | 178.002181 | 33.228533 | |||
| A4.5 | 178.003671 | 33.228277 | |||
| A4.6 | 178.001066 | 33.228574 | |||
| B.1 | 178.004190 | 33.230054 | 4.1422 | Bayliss+11 | |
| B.2 | 178.004590 | 33.229554 | |||
| B.3 | 178.003560 | 33.225932 | |||
| B.4 | 177.998780 | 33.228408 | |||
| C.1 | 178.000480 | 33.229159 | ⋯ | ||
| C.2 | 178.003140 | 33.225349 | |||
| SDSS J1156+1911 | |||||
| 1 | 179.022440 | 19.185323 | 1.5430 | Stark+13 | |
| SDSS J1207+5254 | |||||
| 1.1 | 181.903370 | 52.918765 | 1.9260 | Kubo+10 | |
| 1.2 | 181.904630 | 52.918406 | |||
| 1.3 | 181.900360 | 52.919571 | |||
| 1a.1 | 181.904920 | 52.918342 | |||
| 1a.2 | 181.902730 | 52.918963 | |||
| 1a.3 | 181.900840 | 52.919494 | |||
| 1b.1 | 181.903940 | 52.918579 | |||
| 1b.2 | 181.904210 | 52.918498 | |||
| 1 c.1 | 181.902350 | 52.918905 | |||
| 1 c.2 | 181.901000 | 52.919288 | |||
| 2.1 | 181.896690 | 52.914499 | ⋯ | ||
| 2.2 | 181.898240 | 52.914044 | |||
| 2.3 | 181.897894 | 52.914102 | Candidate | ||
| SN cand | 181.8982 | 52.918553 | Location of SN candidate, | ||
| discovered in archival GMOS imaging | |||||
| SDSS J1209+2640 | |||||
| A.1 | 182.350930 | 26.681689 | 1.0180 | Ofek+08 | |
| A.2 | 182.351500 | 26.681164 | |||
| A.3 | 182.352090 | 26.679416 | |||
| B | 182.35032 | 26.680163 | 0.879 | Bayliss+11 | |
| C.1 | 182.342960 | 26.684707 | 3.9480 | Bayliss+11 | |
| C.2 | 182.341400 | 26.682441 | |||
| C.3 | 182.355790 | 26.683225 | |||
| C.4 | 182.347856 | 26.670245 | |||
| 4.1 | 182.341782 | 26.678621 | ⋯ | ||
| 4.2 | 182.345070 | 26.673153 | Candidate | ||
| 5.1 | 182.347890 | 26.677651 | ⋯ | ||
| 5.2 | 182.347220 | 26.676739 | |||
| 5.3 | 182.349667 | 26.687590 | |||
| 6.1 | 182.342125 | 26.678861 | ⋯ | IR (dusty) | |
| 6.2 | 182.352617 | 26.685458 | |||
| 6.3 | 182.352073 | 26.672528 | |||
| 6.4 | 182.346474 | 26.685323 | |||
| 6.5 | 182.345869 | 26.685350 | |||
| 6.6 | 182.346284 | 26.685887 | |||
| 7a.1 | 182.354066 | 26.683616 | ⋯ | ||
| 7a.2 | 182.347138 | 26.670215 | Candidate | ||
| 7b.1 | 182.353591 | 26.684219 | |||
| 7b.2 | 182.347467 | 26.670170 | Candidate | ||
| J | 182.351763 | 26.682600 | 0.542 | Ofek+08 | “Jellyfish” galaxy |
| SDSS J1329+2243 | |||||
| 1.1 | 202.392260 | 22.723947 | 2.0400 | Bayliss+14 | Knots in source 1 |
| 1.2 | 202.391340 | 22.723539 | |||
| 1.3 | 202.397396 | 22.722757 | |||
| 1b.1 | 202.391650 | 22.723738 | |||
| 1b.2 | 202.391889 | 22.723873 | |||
| 1b.3 | 202.397483 | 22.722747 | |||
| 1 c.1 | 202.391092 | 22.723370 | |||
| 1 c.2 | 202.392442 | 22.723829 | |||
| 1 c.3 | 202.397387 | 22.722657 | |||
| 1d.1 | 202.390930 | 22.723279 | |||
| 1d.2 | 202.392627 | 22.723718 | |||
| 1d.3 | 202.397329 | 22.722648 | |||
| 1e.2 | 202.392077 | 22.723914 | |||
| 1e.1 | 202.391450 | 22.723595 | |||
| 1e.3 | 202.397453 | 22.722719 | |||
| 2.1 | 202.395249 | 22.724825 | ⋯ | Tangential arc, candidate | |
| 2.2 | 202.396536 | 22.724304 | |||
| 3.1 | 202.394619 | 22.721897 | ⋯ | Candidate system near radial critical curve | |
| 3.2 | 202.394611 | 22.721712 | |||
| 3.3 | 202.394645 | 22.721121 | |||
| 3.4 | 202.394589 | 22.720651 | |||
| 3.5 | 202.395540 | 22.721882 | |||
| 4.1 | 202.395765 | 22.721646 | ⋯ | Candidate | |
| 4.2 | 202.395232 | 22.721315 | |||
| 5.1 | 202.394698 | 22.718009 | ⋯ | Tangential arc, candidate | |
| 5.2 | 202.393956 | 22.717865 | |||
| A | 202.395142 | 22.715818 | 0.7096 | This work, GMOS | Single image |
| B | 202.396303 | 22.715868 | 0.9644 | This work, GMOS | Single image |
| C | 202.396603 | 22.710030 | 1.1472 | This work, GMOS | Single image |
| D | 202.388014 | 22.720156 | 0.2811 | This work, GMOS | Single image |
| SDSS J1336−0331 | |||||
| 1.1 | 204.002570 | −3.525374 | 0.9556 | This work, LDSS3 | |
| 1.2 | 204.002340 | −3.525918 | |||
| 1.3 | 204.000510 | −3.527313 | |||
| 1.4 | 203.999560 | −3.523771 | |||
| 1.5 | 204.002510 | −3.524433 | |||
| 1.6 | 204.002520 | −3.524291 | |||
| 2.1 | 203.999500 | −3.521916 | 1.4737 | This work, IMACS | |
| 2.2 | 204.000790 | −3.525640 | This work, IMACS | Spectroscopically confirmed radial arc | |
| 4.1 | 204.000320 | −3.527927 | ⋯ | ||
| 4.2 | 204.002540 | −3.526535 | |||
| 4.3 | 203.998900 | −3.527469 | |||
| 4.4 | 204.003330 | −3.523445 | |||
| 4.5 | 203.999790 | −3.527670 | |||
| 4.6 | 203.999120 | −3.523427 | |||
| a | 204.004370 | −3.527186 | 0.6139 | This work, IMACS | Possible redshift |
| b | 203.988837 | −3.528258 | 0.6685 | This work, IMACS | Single image |
| c | 203.995852 | −3.526103 | 0.9865 | This work, IMACS | Single image |
| d | 203.999791 | −3.520988 | 0.9613 | This work, IMACS | Single image |
| e | 204.005241 | −3.529637 | 1.1783 | This work, IMACS | Single image |
| f | 203.991477 | −3.528430 | 1.6015 | This work, IMACS | Single image |
| g | 203.995908 | −3.527730 | 0.1206 | This work, IMACS | Foreground |
| s | 203.998599 | −3.526622 | 0.00 | This work, IMACS | Star |
Note. Lensing constraints and other background or foreground galaxies with spectroscopic redshifts in the fields of SGAS-HST clusters SDSS J1152+3313, SDSS J1156+1911, SDSS J1207+5254, SDSS J1209+2640, SDSS J1329+2243, and SDSS J1336−0331. The IDs of images of lensed galaxies are labeled as  where A is a number or a letter indicating the source ID (or system name); B is a number or a letter indicating the ID of the emission knot within the system; and X is a number indicating the ID of the lensed image within the multiple-image family.
References. Rigby et al. (2018b), Stark et al. (2013), Bayliss (2012), Bayliss et al. (2010, 2011b, 2014b), Kubo et al. (2010), Johnson et al. (2017b), Ofek et al. (2008), Diehl et al. (2009).
A machine-readable version of the table is available.
Table 8. List of Lensing Constraints for Clusters Shown in Figure 5
| ID | R.A. | Decl. | zspec | zspec | Notes |
|---|---|---|---|---|---|
| J2000 | J2000 | Reference | |||
| SDSS J1343+4155 | |||||
| A.1 | 205.891790 | 41.917796 | 2.0910 | Bayliss+11, Diehl+09 | |
| A.2 | 205.891220 | 41.919003 | |||
| A.3 | 205.889630 | 41.920730 | |||
| Aa.1 | 205.889900 | 41.920332 | |||
| Aa.2 | 205.890240 | 41.920017 | |||
| Aa.3 | 205.891980 | 41.916926 | |||
| B | 205.877930 | 41.915293 | 4.994 | Bayliss+11 | |
| 2.1 | 205.887850 | 41.920262 | ⋯ | ||
| 2.2 | 205.889010 | 41.919262 | |||
| 2.3 | 205.890780 | 41.914773 | |||
| SDSS J1420+3955 | |||||
| A.1 | 215.161652 | 39.914131 | 2.1610 | Bayliss+11 | |
| A.2 | 215.160340 | 39.915191 | |||
| A.3 | 215.159600 | 39.915621 | |||
| A.4 | 215.158280 | 39.921504 | |||
| A.5 | 215.160952 | 39.914990 | |||
| A.6 | 215.160582 | 39.914590 | |||
| B.1 | 215.156830 | 39.912824 | 3.0665 | Bayliss+11 | |
| B.2 | 215.155840 | 39.913817 | |||
| B.3 | 215.159930 | 39.909231 | |||
| Bb.1 | 215.155430 | 39.914457 | |||
| Bb.2 | 215.157200 | 39.912639 | |||
| Bb.3 | 215.159780 | 39.909520 | |||
| 3.1 | 215.161360 | 39.916025 | ⋯ | ||
| 3.2 | 215.161250 | 39.916211 | |||
| 3.3 | 215.159150 | 39.922727 | |||
| 4.1 | 215.169607 | 39.920562 | ⋯ | ||
| 4.2 | 215.169066 | 39.920456 | |||
| 4b.1 | 215.169749 | 39.920578 | |||
| 4b.2 | 215.168985 | 39.920438 | |||
| 5.1 | 215.162934 | 39.917972 | ⋯ | ||
| 5.2 | 215.171229 | 39.920415 | |||
| 5.3 | 215.162289 | 39.924584 | |||
| 5.4 | 215.166954 | 39.912265 | Candidate | ||
| 6.1 | 215.162750 | 39.918301 | ⋯ | ||
| 6.2 | 215.171055 | 39.920716 | |||
| 6.3 | 215.162135 | 39.924116 | |||
| 6.4 | 215.167052 | 39.911817 | Candidate | ||
| 7.1 | 215.161918 | 39.918919 | ⋯ | ||
| 7.3 | 215.161482 | 39.923071 | |||
| 7.2 | 215.170257 | 39.920849 | Candidate | ||
| 7.4 | 215.166625 | 39.911040 | Candidate | ||
| 8.1 | 215.170597 | 39.918805 | ⋯ | ||
| 8.2 | 215.169685 | 39.919134 | |||
| 8.3 | 215.169165 | 39.919150 | |||
| 8.4 | 215.161679 | 39.926218 | |||
| 20.1 | 215.148556 | 39.922919 | ⋯ | Near NW halo1 | |
| 20.2 | 215.149334 | 39.923745 | |||
| 20.3 | 215.148650 | 39.925028 | |||
| 20.4 | 215.148153 | 39.923660 | |||
| 30.1 | 215.142593 | 39.921047 | ⋯ | Near NW halo2 | |
| 30.2 | 215.143058 | 39.921337 | |||
| 30.3 | 215.142942 | 39.923436 | |||
| 30.4 | 215.141806 | 39.921806 | |||
| SDSS J1439+1208 | |||||
| 1.1 | 219.792668 | 12.138371 | 1.4940 | This work, FIRE | 2013 Mar 01 |
| 1.2 | 219.791888 | 12.137640 | |||
| 1.3 | 219.793188 | 12.143946 | |||
| 1.4 | 219.789968 | 12.140544 | |||
| 1a.1 | 219.792718 | 12.138600 | |||
| 1a.2 | 219.791448 | 12.137471 | |||
| 1a.3 | 219.793018 | 12.144041 | |||
| 1a.4 | 219.789758 | 12.140576 | |||
| 1b.1 | 219.792568 | 12.138661 | |||
| 1b.2 | 219.791118 | 12.137460 | |||
| 1b.3 | 219.792838 | 12.144199 | |||
| 1b.4 | 219.789508 | 12.140580 | |||
| 1 c.1 | 219.791888 | 12.137807 | |||
| 1 c.2 | 219.792268 | 12.138138 | |||
| 2.1 | 219.787058 | 12.137849 | 1.5800 | This work, IMACS | |
| 2.2 | 219.789678 | 12.144543 | |||
| 2.3 | 219.788568 | 12.142683 | |||
| 2.4 | 219.791131 | 12.140390 | Radial arc candidate | ||
| B1 | 219.7929577 | 12.13667192 | 3.48 | This work, IMACS | |
| B2 | 219.7936562 | 12.13763932 | 1.53 | This work, IMACS | Possible redshift, single image |
| SDSS J1456+5702 | |||||
| B.1 | 224.004820 | 57.034582 | 2.3660 | This work, MMT | Knots in giant arc |
| B.2 | 224.002780 | 57.041188 | |||
| B.3 | 224.006960 | 57.034895 | |||
| Ba.1 | 224.008300 | 57.034957 | |||
| Ba.2 | 224.002640 | 57.040816 | |||
| Bb.1 | 224.009840 | 57.036207 | |||
| Bb.2 | 224.002320 | 57.041565 | |||
| Bc.1 | 224.000690 | 57.034937 | |||
| Bc.2 | 224.002700 | 57.041638 | |||
| Bd.1 | 223.999750 | 57.035006 | |||
| Bd.2 | 224.003040 | 57.041559 | |||
| Be.1 | 223.999940 | 57.034689 | |||
| Be.2 | 224.003390 | 57.041169 | |||
| Bf.1 | 224.010680 | 57.036451 | |||
| Bf.2 | 224.001640 | 57.041280 | |||
| A1 | 224.003905 | 57.042969 | 0.8331 | Bayliss+11 | Single image |
| A2 | 224.003257 | 57.036603 | 0.8324 | Bayliss+11 | Single image |
| C | 224.022021 | 57.034751 | 1.1400 | Bayliss+11 | Single image |
| SDSS J1522+2535 | |||||
| 1.1 | 230.721557 | 25.593341 | 1.7096 | This work, GMOS | Substructure in source 1 |
| 1.2 | 230.718683 | 25.592248 | |||
| 1.3 | 230.717426 | 25.589195 | |||
| 1.4 | 230.720750 | 25.590884 | |||
| 1.5 | 230.721538 | 25.590773 | |||
| 1a.1 | 230.721580 | 25.593523 | |||
| 1a.2 | 230.718270 | 25.591888 | |||
| 1a.3 | 230.717480 | 25.589447 | |||
| 1a.4 | 230.720770 | 25.590667 | |||
| 1b.1 | 230.721730 | 25.593499 | |||
| 1b.2 | 230.718350 | 25.591777 | |||
| 1b.3 | 230.717670 | 25.589403 | |||
| 1b.4 | 230.720970 | 25.590605 | |||
| 1 c.1 | 230.721800 | 25.592924 | |||
| 1 c.2 | 230.719150 | 25.592023 | |||
| 1 c.3 | 230.717670 | 25.588817 | |||
| 1d.1 | 230.721910 | 25.593010 | |||
| 1d.2 | 230.718990 | 25.591908 | |||
| 1d.3 | 230.717830 | 25.588910 | |||
| B | 230.725525 | 25.5879675 | 1.221 | This work, GMOS | Possible redshift, single image |
| C | 230.727051 | 25.58725537 | 0.973161 | This work, GMOS | Single image |
| D | 230.7270299 | 25.57886337 | 0.487957 | This work, GMOS | Foreground galaxy |
| E | 230.715947 | 25.57524935 | 0.379631 | This work, GMOS | Foreground galaxy |
| SDSS J1527+0652 | |||||
| 1.1 | 231.938559 | 6.872048 | 2.7600 | Koester+10 | |
| 1.2 | 231.937925 | 6.872142 | |||
| 1.3 | 231.937803 | 6.872197 | |||
| 1b.1 | 231.938366 | 6.872013 | |||
| 1b.2 | 231.938053 | 6.872052 | |||
| 1 c.1 | 231.938274 | 6.872022 | |||
| 1 c.2 | 231.938162 | 6.872030 | |||
| 1 c.3 | 231.937547 | 6.872303 | |||
| 1d.1 | 231.938452 | 6.871979 | |||
| 1d.2 | 231.937931 | 6.872059 | |||
| 2.1 | 231.934215 | 6.877017 | ⋯ | Candidate | |
| 2.2 | 231.934355 | 6.876537 | |||
| 2.3 | 231.934124 | 6.875461 | |||
| 3.1 | 231.939062 | 6.876848 | ⋯ | Candidate | |
| 3.2 | 231.939158 | 6.875564 | |||
| 3.3 | 231.939727 | 6.874700 | |||
| 4.1 | 231.944022 | 6.883274 | ⋯ | Candidate | |
| 4.2 | 231.945432 | 6.879834 | |||
| 4.3 | 231.947061 | 6.877657 | |||
| 5.1 | 231.951761 | 6.879191 | ⋯ | Candidate | |
| 5.2 | 231.951803 | 6.882945 | |||
| 5.3 | 231.947973 | 6.886712 | |||
| 6.1 | 231.942672 | 6.881764 | ⋯ | Candidate | |
| 6.2 | 231.943085 | 6.880734 | |||
Note. Lensing constraints and other background or foreground galaxies with spectroscopic redshifts in the fields of SGAS-HST clusters SDSS J1343+4155, SDSS J1420+3955, SDSS J1439+1208, SDSS J1456+5702, SDSS J1522+2535, and SDSS J1527+0652. The IDs of images of lensed galaxies are labeled as  where A is a number or a letter indicating the source ID (or system name); B is a number or a letter indicating the ID of the emission knot within the system; and X is a number indicating the ID of the lensed image within the multiple-image family.
References. Rigby et al. (2018b), Stark et al. (2013), Bayliss (2012), Bayliss et al. (2010, 2011b, 2014b), Kubo et al. (2010), Johnson et al. (2017b), Ofek et al. (2008), Diehl et al. (2009).
A machine-readable version of the table is available.
Table 9. List of Lensing Constraints for Clusters Shown in Figure 6
| ID | R.A. | Decl. | zspec | zspec | Notes |
|---|---|---|---|---|---|
| J2000 | J2000 | Reference | |||
| SDSS J1531+3414 | |||||
| 1.1 | 232.79846 | 34.242414 | 1.096 | Bayliss+11 | |
| 1.2 | 232.79147 | 34.241359 | |||
| 1.3 | 232.79290 | 34.237469 | |||
| 1.4 | 232.79312 | 34.237454 | |||
| 12.1 | 232.79883 | 34.241860 | |||
| 12.2 | 232.79204 | 34.241349 | |||
| 13.1 | 232.79863 | 34.241870 | |||
| 13.2 | 232.79214 | 34.241676 | |||
| 14.1 | 232.79861 | 34.242029 | |||
| 14.2 | 232.79197 | 34.241605 | |||
| 15.1 | 232.79850 | 34.242660 | |||
| 15.2 | 232.79106 | 34.240519 | |||
| 16.1 | 232.79821 | 34.242889 | |||
| 16.2 | 232.79379 | 34.237723 | |||
| 17.1 | 232.79725 | 34.242966 | |||
| 17.2 | 232.79311 | 34.242933 | |||
| 17.3 | 232.79574 | 34.238452 | |||
| 17.4 | 232.79018 | 34.239033 | |||
| 2.1 | 232.78877 | 34.237850 | Bayliss+11 | limit: 
|
|
| 2.2 | 232.79710 | 34.238497 | |||
| 2.3 | 232.79809 | 34.243633 | |||
| 2.4 | 232.79337 | 34.244258 | |||
| 2a.1 | 232.78812 | 34.238060 | |||
| 2a.2 | 232.79726 | 34.239392 | |||
| 2b.1 | 232.78891 | 34.237212 | |||
| 2b.2 | 232.79780 | 34.239135 | |||
| 2b.3 | 232.79825 | 34.243064 | |||
| 3.1 | 232.79355 | 34.241752 | Bayliss+11 | limit: >1.49 | |
| 3.2 | 232.79224 | 34.235538 | |||
| D | 232.7891558 | 34.2359015 | 1.026 | Bayliss+11 | Single image |
| E | 232.7845467 | 34.2413218 | 1.3 | Bayliss+11 | Single image |
| SDSS J1604+2244 | |||||
| 1.1 | 241.040867 | 22.739529 | ⋯ | ||
| 1.2 | 241.043363 | 22.739298 | |||
| 1.3 | 241.044362 | 22.736277 | |||
| 1.4 | 241.041803 | 22.737227 | |||
| 1.5 | 241.042247 | 22.737956 | |||
| A | 241.047645 | 22.739371 | 1.1841 | This work, GMOS | Single image |
| B | 241.037062 | 22.741253 | 1.0333 | This work, GMOS | Single image |
| c | 241.035457 | 22.731761 | 1.6370 | This work, GMOS | |
| d | 241.047417 | 22.747950 | 0.4141 | This work, GMOS | |
| e | 241.038404 | 22.731987 | 2.0540 | This work, GMOS | Low-confidence redshift |
| f | 241.041255 | 22.731276 | 1.1843 | This work, GMOS | Low-confidence redshift |
| g | 241.041780 | 22.729624 | 1.7232 | This work, GMOS | Low-confidence redshift |
| h | 241.035411 | 22.732763 | 1.4830 | This work, GMOS | Low-confidence redshift |
| Q | 241.050890 | 22.734746 | 2.1670 | SDSS DR12 | QSO |
| SDSS J1621+0607 | |||||
| A.1 | 245.389450 | 6.120616 | 4.1300 | Bayliss+11 | Lyα emitter; A1 in Bayliss+11 |
| A.2 | 245.386300 | 6.118230 | Lyα emitter; A2 in Bayliss+11 | ||
| 2a.1 | 245.385990 | 6.121664 | 1.1780 | Bayliss+11 | B1 in Bayliss+11 |
| 2a.2 | 245.386190 | 6.122059 | |||
| 2a.3 | 245.385460 | 6.122681 | |||
| 2a.4 | 245.382610 | 6.121549 | |||
| 2b.3 | 245.385240 | 6.122616 | 1.1780 | This work, LDSS3 | Falls outside of the caustic of 2a.1, 2a.2 |
| 2b.4 | 245.382740 | 6.121098 | |||
| 2 c.1 | 245.386100 | 6.121659 | |||
| 2 c.2 | 245.386260 | 6.121953 | |||
| 2 c.3 | 245.385360 | 6.122681 | |||
| 2d.1 | 245.386200 | 6.121664 | |||
| 2d.2 | 245.386310 | 6.121843 | |||
| 2d.3 | 245.385288 | 6.122697 | |||
| 2d.4 | 245.382710 | 6.121224 | |||
| C.1 | 245.3867270 | 6.125210 | ⋯ | Bayliss+11 | |
| C.2 | 245.3811204 | 6.123205 | Predicted location of possible counter image | ||
| D | 245.377640 | 6.124750 | 0.5066 | This work, IMACS | Single image |
| E | 245.380753 | 6.118075 | 1.31 | This work, IMACS | Single image; low-confidence redshift |
| F | 245.386307 | 6.123700 | 0.3386 | This work, IMACS | Single image |
| SDSS J1632+3500 | |||||
| 1 | 248.047637 | 35.007370 | 1.2350 | This work, GMOS | |
| 2 | 248.038365 | 35.006802 | 2.2650 | This work, GMOS | |
| 3.1 | 248.042579 | 35.010737 | ⋯ | Candidate | |
| 3.2 | 248.043008 | 35.011403 | |||
| 4.1 | 248.050018 | 35.009041 | ⋯ | Candidate | |
| 4.2 | 248.049811 | 35.007939 | |||
| 5 | 248.041096 | 35.011300 | 0.4538 | This work, GMOS | Cluster member, star-forming |
| 6 | 248.043778 | 35.013704 | 0.1271 | This work, GMOS | Foreground |
| 7 | 248.048366 | 35.011598 | 1.2318 | This work, GMOS | Background, single image |
| SDSS J1723+3411 | |||||
| 1.1 | 260.901550 | 34.198336 | 1.3294 | Kubo+10 | |
| 1.2 | 260.902050 | 34.199054 | |||
| 1.3 | 260.901040 | 34.201255 | |||
| 1.4 | 260.899850 | 34.199329 | |||
| 1.5 | 260.900572 | 34.199449 | |||
| 1a.1 | 260.901820 | 34.198623 | |||
| 1a.2 | 260.901890 | 34.198710 | |||
| 2.1 | 260.901400 | 34.197421 | 2.1650 | This work, HST-GO-14230 | PI: Rigby |
| 2.2 | 260.902560 | 34.199755 | |||
| 2.3 | 260.901040 | 34.201732 | |||
| 2.4 | 260.899370 | 34.199521 | |||
| 3.1 | 260.901180 | 34.197414 | ⋯ | Assumed to be at same z as source 2 | |
| 3.2 | 260.902500 | 34.199631 | |||
| 3.3 | 260.900860 | 34.201795 | |||
| 3.4 | 260.899230 | 34.199477 | |||
| SDSS J2111−0114 | |||||
| 1.1 | 317.827850 | −1.241202 | 2.8580 | Bayliss+11 | A in Bayliss+11 |
| 1.2 | 317.828960 | −1.242054 | |||
| 1.3 | 317.834400 | −1.242342 | |||
| 1a.1 | 317.828530 | −1.241737 | |||
| 1a.2 | 317.828260 | −1.241515 | |||
| 1b.1 | 317.828340 | −1.241774 | |||
| 1b.2 | 317.828450 | −1.241857 | |||
| 1 c.1 | 317.828910 | −1.242246 | |||
| 1 c.2 | 317.827940 | −1.241592 | |||
| 1d.1 | 317.828700 | −1.242008 | |||
| 1d.2 | 317.828120 | −1.241579 | |||
| 2.1 | 317.833862 | −1.241214 | ⋯ | ||
| 2.2 | 317.832739 | −1.241775 | |||
| 3.1 | 317.827023 | −1.241099 | ⋯ | ||
| 3.2 | 317.830653 | −1.242959 | |||
| 3.3 | 317.833819 | −1.242636 | |||
Note. Lensing constraints and other background or foreground galaxies with spectroscopic redshifts in the fields of SGAS-HST clusters SDSS J1531+3414, SDSS J1604+2244, SDSS J1621+0607, SDSS J1632+3500, SDSS J1723+3411, and SDSS J2111−0114. SDSS J2243−0935. The IDs of images of lensed galaxies are labeled as  where A is a number or a letter indicating the source ID (or system name); B is a number or a letter indicating the ID of the emission knot within the system; and X is a number indicating the ID of the lensed image within the multiple-image family.
References. Rigby et al. (2018b), Stark et al. (2013), Bayliss (2012), Bayliss et al. (2010, 2011b, 2014b), Kubo et al. (2010), Johnson et al. (2017b), Ofek et al. (2008), Diehl et al. (2009).
A machine-readable version of the table is available.
Table 10. List of Lensing Constraints for Clusters Shown in Figure 7
| ID | R.A. | Decl. | zspec | zspec | Notes |
|---|---|---|---|---|---|
| J2000 | J2000 | Reference | |||
| SDSS J2243−0935 | |||||
| 1.1 | 340.850935 | −9.585705 | 2.09 | A2 in Bayliss+11; Rigby+18 | AGN core |
| 1.2 | 340.851211 | −9.586760 | |||
| 101.1 | 340.851430 | −9.587189 | clumps in the host galaxy | ||
| 101.2 | 340.851337 | −9.586573 | |||
| 101.3 | 340.851173 | −9.586377 | |||
| 102.1 | 340.851279 | −9.587084 | |||
| 102.2 | 340.851068 | −9.586766 | |||
| 102.3 | 340.851025 | −9.586260 | |||
| 2.1 | 340.858480 | −9.580426 | ⋯ |
 used as prior used as prior |
|
| 2.2 | 340.858820 | −9.581002 | |||
| 2.3 | 340.859550 | −9.583349 |

|
||
| 3.1 | 340.854230 | −9.580533 | ⋯ | ||
| 3.2 | 340.854490 | −9.580891 | |||
| 3.3 | 340.856975 | −9.583722 | |||
| 4.1 | 340.851790 | −9.581950 | ⋯ | ||
| 4.2 | 340.852140 | −9.583397 | |||
| 4.3 | 340.854020 | −9.587714 | |||
| 5.1 | 340.846880 | −9.584385 | ⋯ | ||
| 5.2 | 340.847240 | −9.586046 | |||
| 6.1 | 340.839270 | −9.583212 | ⋯ | ||
| 6.2 | 340.840110 | −9.584314 | |||
| 7.1 | 340.835850 | −9.590120 | ⋯ | ||
| 7.2 | 340.836190 | −9.589966 | |||
| 7.3 | 340.838472 | −9.590060 | |||
| 8.1 | 340.834010 | −9.590052 | ⋯ |
 used as prior used as prior |
|
| 8.2 | 340.836370 | −9.588974 | |||
| 8.3 | 340.839336 | −9.589144 |

|
||
| 8.4 | 340.835870 | −9.580444 | |||
| 8a.1 | 340.833738 | −9.590145 | |||
| 8a.3 | 340.839226 | −9.589118 | |||
| 8a.4 | 340.835763 | −9.580485 | |||
| 10.1 | 340.824680 | −9.594526 | ⋯ | ||
| 10.2 | 340.825210 | −9.596464 | |||
| 11.1 | 340.833981 | −9.590439 | ⋯ | ||
| 11.2 | 340.836653 | −9.589322 | |||
| 11.3 | 340.838693 | −9.589496 | |||
| A1 | 340.854971 | −9.581328 | 2.092 | Bayliss+11 | |
| B1 | 340.847112 | −9.592340 | 1.3202 | Bayliss+11 | Single image |
| C1 | 340.851833 | −9.596300 | 0.7403 | Bayliss+11 | Single image |
| D | 340.852299 | −9.604503912 | 0.79 | This work, IMACS | Galaxy–Galaxy lensing |
| E | 340.8573348 | −9.57659422 | 3.378 | This work, IMACS | Galaxy–Galaxy lensing |
Note. Lensing constraints and other background or foreground galaxies with spectroscopic redshifts in the fields of SGAS-HST cluster SDSS J2243−0935. The IDs of images of lensed galaxies are labeled as  where A is a number or a letter indicating the source ID (or system name); B is a number or a letter indicating the ID of the emission knot within the system; and X is a number indicating the ID of the lensed image within the multiple-image family.
References. Rigby et al. (2018b), Stark et al. (2013), Bayliss (2012), Bayliss et al. (2010, 2011b, 2014b), Kubo et al. (2010), Johnson et al. (2017b), Ofek et al. (2008), Diehl et al. (2009).
A machine-readable version of the table is available.
Download table as: DataTypeset image
Appendix B: Spectroscopy Catalog
Table 11 provides the spectroscopic redshifts of cluster-member galaxies that were measured in this work, from the literature, and from the SDSS. The spectroscopic redshifts of non-cluster members are given in Appendix A.
Table 11. List of Spectroscopic Redshifts
| Cluster | R.A. | Decl. | z | Reference |
|---|---|---|---|---|
| J2000 | J2000 | |||
| SDSS J0928+2031 | ||||
| 09:28:06.668 | +20:32:06.46 | 0.1932 | Gemini/GMOS-GN15AQ38 | |
| 09:28:04.818 | +20:31:46.84 | 0.1872 | Gemini/GMOS-GN15AQ38 | |
| 09:28:03.098 | +20:31:25.64 | 0.1988 | Gemini/GMOS-GN15AQ38 | |
| 09:28:04.928 | +20:31:29.24 | 0.1851 | Gemini/GMOS-GN15AQ38 | |
| 09:28:10.617 | +20:31:52.38 | 0.1893 | Gemini/GMOS-GN15AQ38 | |
| 09:28:10.325 | +20:31:42.66 | 0.1935 | Gemini/GMOS-GN15AQ38 | |
| 09:28:07.084 | +20:31:20.02 | 0.1920 | Gemini/GMOS-GN15AQ38 | |
| 09:28:14.500 | +20:31:44.04 | 0.1885 | Gemini/GMOS-GN15AQ38 | |
| 09:28:06.301 | +20:30:57.09 | 0.1915 | Gemini/GMOS-GN15AQ38 | |
| 09:28:02.236 | +20:30:34.59 | 0.1893 | Gemini/GMOS-GN15AQ38 | |
| 09:28:04.629 | +20:30:44.78 | 0.1906 | Gemini/GMOS-GN15AQ38 | |
| 09:28:13.988 | +20:31:24.52 | 0.1949 | Gemini/GMOS-GN15AQ38 | |
| 09:28:08.272 | +20:30:51.62 | 0.1954 | Gemini/GMOS-GN15AQ38 | |
| 09:28:07.468 | +20:30:22.92 | 0.1904 | Gemini/GMOS-GN15AQ38 | |
| 09:28:04.962 | +20:30:06.18 | 0.1978 | SDSS DR12 | |
| 09:28:04.534 | +20:31:45.15 | 0.1920 | SDSS DR12 | |
| 09:28:13.826 | +20:30:43.65 | 0.1897 | SDSS DR12 | |
| 09:28:22.205 | +20:29:10.13 | 0.1972 | SDSS DR12 | |
| 09:27:47.657 | +20:33:34.87 | 0.1935 | SDSS DR12 | |
| SDSS J0952+3434 | ||||
| 09:52:40.222 | +34:34:46.07 | 0.3597 | SDSS DR12 | |
| 09:52:41.616 | +34:34:14.08 | 0.3570 | SDSS DR12 | |
| 09:52:41.693 | +34:36:03.10 | 0.3529 | Gemini/GMOS-GN15BQ26 | |
| 09:52:38.978 | +34:35:54.77 | 0.3594 | Gemini/GMOS-GN15BQ26 | |
| 09:52:35.313 | +34:35:39.75 | 0.3580 | Gemini/GMOS-GN15BQ26 | |
| 09:52:37.398 | +34:34:57.64 | 0.3553 | Gemini/GMOS-GN15BQ26 | |
| 09:52:40.756 | +34:34:14.84 | 0.3616 | Gemini/GMOS-GN15BQ26 | |
| 09:52:43.880 | +34:34:17.73 | 0.3542 | Gemini/GMOS-GN15BQ26 | |
| 09:52:40.352 | +34:34:06.46 | 0.3532 | Gemini/GMOS-GN15BQ26 | |
| 09:52:46.453 | +34:33:52.97 | 0.3594 | Gemini/GMOS-GN15BQ26 | |
| SDSS J1002+2031 | ||||
| 10:02:26.832 | +20:31:01.92 | 0.3205 | SDSS DR12 | |
| 10:02:14.136 | +20:32:16.44 | 0.3196 | SDSS DR12 | |
| 10:02:28.776 | +20:29:05.64 | 0.3168 | SDSS DR12 | |
| 10:02:44.880 | +20:29:29.40 | 0.3085 | SDSS DR12 | |
| 10:02:45.072 | +20:31:02.28 | 0.3136 | SDSS DR12 | |
| 10:02:11.136 | +20:32:15.00 | 0.3187 | SDSS DR12 | |
| 10:02:38.496 | +20:28:01.20 | 0.3215 | SDSS DR12 | |
| 10:02:44.568 | +20:31:33.24 | 0.3305 | SDSS DR12 | |
| 10:02:42.696 | +20:30:36.72 | 0.3194 | SDSS DR12 | |
| 10:02:28.392 | +20:31:01.01 | 0.3194 | Gemini/GMOS-GN15BQ26 | |
| 10:02:28.422 | +20:30:06.54 | 0.3152 | Gemini/GMOS-GN15BQ26 | |
| 10:02:28.289 | +20:31:07.35 | 0.3245 | Gemini/GMOS-GN15BQ26 | |
| 10:02:25.264 | +20:30:56.94 | 0.3175 | Gemini/GMOS-GN15BQ26 | |
| 10:02:28.000 | +20:30:34.04 | 0.3217 | Gemini/GMOS-GN15BQ26 | |
| 10:02:26.400 | +20:30:30.59 | 0.3191 | Gemini/GMOS-GN15BQ26 | |
| 10:02:30.695 | +20:30:50.14 | 0.3188 | Gemini/GMOS-GN15BQ26 | |
| 10:02:28.309 | +20:31:43.74 | 0.3206 | Gemini/GMOS-GN15BQ26 | |
| 10:02:25.981 | +20:31:48.60 | 0.3230 | Gemini/GMOS-GN15BQ26 | |
| 10:02:28.419 | +20:31:11.49 | 0.3157 | Gemini/GMOS-GN15BQ26 | |
| 10:02:26.737 | +20:31:30.17 | 0.3093 | Gemini/GMOS-GN15BQ26 | |
| 10:02:23.262 | +20:30:39.73 | 0.3235 | Gemini/GMOS-GN11AQ19 | |
| 10:02:25.964 | +20:30:44.26 | 0.3153 | Gemini/GMOS-GN11AQ19 | |
| 10:02:16.879 | +20:30:54.20 | 0.3275 | Gemini/GMOS-GN11AQ19 | |
| 10:02:30.479 | +20:30:16.83 | 0.3126 | Gemini/GMOS-GN11AQ19 | |
| 10:02:25.463 | +20:30:20.32 | 0.3223 | Gemini/GMOS-GN11AQ19 | |
| 10:02:24.617 | +20:31:28.95 | 0.3226 | Gemini/GMOS-GN11AQ19 | |
| 10:02:23.503 | +20:30:34.47 | 0.3238 | Gemini/GMOS-GN11AQ19 | |
| 10:02:27.478 | +20:30:47.82 | 0.3197 | Gemini/GMOS-GN11AQ19 | |
| 10:02:26.909 | +20:30:51.14 | 0.3143 | Gemini/GMOS-GN11AQ19 | |
| 10:02:23.774 | +20:30:55.46 | 0.3195 | Gemini/GMOS-GN11AQ19 | |
| 10:02:25.971 | +20:31:01.83 | 0.3114 | Gemini/GMOS-GN11AQ19 | |
| 10:02:28.756 | +20:31:10.58 | 0.3139 | Gemini/GMOS-GN11AQ19 | |
| 10:02:25.012 | +20:32:09.34 | 0.3157 | Gemini/GMOS-GN11AQ19 | |
| 10:02:25.394 | +20:31:15.98 | 0.3189 | Gemini/GMOS-GN11AQ19 | |
| 10:02:30.050 | +20:31:23.90 | 0.3151 | Gemini/GMOS-GN11AQ19 | |
| 10:02:32.663 | +20:31:26.31 | 0.3228 | Gemini/GMOS-GN11AQ19 | |
| 10:02:22.687 | +20:32:24.04 | 0.3120 | Gemini/GMOS-GN11AQ19 | |
| SDSS J1522+2535 | ||||
| 15:22:53.524 | +25:36:40.27 | 0.6042 | SDSS DR12 | |
| 15:22:50.681 | +25:33:34.58 | 0.5917 | SDSS DR12 | |
| 15:22:45.102 | +25:36:56.98 | 0.6013 | Gemini/GMOS MOS | |
| 15:22:51.614 | +25:35:24.96 | 0.6046 | Gemini/GMOS MOS | |
| 15:22:51.900 | +25:35:04.95 | 0.5885 | Gemini/GMOS MOS | |
| 15:22:52.528 | +25:34:36.23 | 0.6071 | Gemini/GMOS MOS | |
| 15:22:52.686 | +25:34:46.52 | 0.5995 | Gemini/GMOS MOS | |
| 15:22:52.802 | +25:36:01.37 | 0.6023 | Gemini/GMOS MOS | |
| 15:22:53.304 | +25:35:54.81 | 0.5928 | Gemini/GMOS MOS | |
| 15:22:53.536 | +25:36:40.13 | 0.6043 | Gemini/GMOS MOS | |
| 15:22:54.162 | +25:34:25.91 | 0.6031 | Gemini/GMOS MOS | |
| 15:22:54.285 | +25:34:24.15 | 0.6060 | Gemini/GMOS MOS | |
| 15:22:54.313 | +25:35:24.39 | 0.6090 | Gemini/GMOS MOS | |
| 15:22:54.880 | +25:35:17.59 | 0.6088 | Gemini/GMOS MOS | |
| SDSS J1621+0607 | ||||
| 16:21:32.746 | +06:07:10.97 | 0.3382 | Bayliss et al. (2011b) | |
| 16:21:32.731 | +06:07:13.82 | 0.3390 | Bayliss et al. (2011b) | |
| 16:21:28.469 | +06:06:52.97 | 0.3437 | Bayliss et al. (2011b) | |
| 16:21:33.158 | +06:07:26.67 | 0.3408 | Bayliss et al. (2011b) | |
| 16:21:33.965 | +06:07:23.35 | 0.3420 | Bayliss et al. (2011b) | |
| 16:21:31.694 | +06:07:44.14 | 0.3406 | Bayliss et al. (2011b) | |
| 16:21:31.966 | +06:07:48.24 | 0.3436 | Bayliss et al. (2011b) | |
| 16:21:35.638 | +06:06:28.89 | 0.3367 | Bayliss et al. (2011b) | |
| 16:21:33.394 | +06:07:13.93 | 0.3505 | Bayliss et al. (2011b) | |
| 16:21:32.830 | +06:07:24.31 | 0.3391 | Bayliss et al. (2011b) | |
| 16:21:32.698 | +06:07:28.43 | 0.3522 | Bayliss et al. (2011b) | |
| 16:21:16.227 | +06:10:59.42 | 0.3446 | Magallan/IMACS MOS | |
| 16:21:16.797 | +06:18:32.11 | 0.3037 | Magallan/IMACS MOS | |
| 16:21:18.122 | +06:13:58.32 | 0.3185 | Magallan/IMACS MOS | |
| 16:21:19.303 | +06:14:39.07 | 0.3008 | Magallan/IMACS MOS | |
| 16:21:22.008 | +06:08:20.09 | 0.3000 | Magallan/IMACS MOS | |
| 16:21:22.420 | +06:01:29.46 | 0.3397 | Magallan/IMACS MOS | |
| 16:21:25.778 | +06:02:09.85 | 0.3412 | Magallan/IMACS MOS | |
| 16:21:26.176 | +06:08:35.22 | 0.3421 | Magallan/IMACS MOS | |
| 16:21:36.517 | +06:04:07.66 | 0.3214 | Magallan/IMACS MOS | |
| 16:21:36.970 | +06:06:58.79 | 0.3433 | Magallan/IMACS MOS | |
| 16:21:39.339 | +06:02:01.51 | 0.3415 | Magallan/IMACS MOS | |
| 16:21:39.669 | +05:59:52.43 | 0.3161 | Magallan/IMACS MOS | |
| 16:21:41.159 | +06:02:16.98 | 0.3446 | Magallan/IMACS MOS | |
| 16:21:43.658 | +06:07:30.44 | 0.3412 | Magallan/IMACS MOS | |
| 16:21:43.672 | +06:03:43.78 | 0.3001 | Magallan/IMACS MOS | |
| 16:21:43.947 | +06:00:40.68 | 0.3402 | Magallan/IMACS MOS | |
| 16:21:46.199 | +06:02:55.47 | 0.3460 | Magallan/IMACS MOS | |
| 16:21:46.831 | +06:03:13.22 | 0.3436 | Magallan/IMACS MOS | |
| 16:21:49.248 | +06:02:57.76 | 0.3439 | Magallan/IMACS MOS | |
| 16:21:53.388 | +06:04:56.83 | 0.3385 | Magallan/IMACS MOS | |
| 16:21:55.331 | +06:06:01.89 | 0.3418 | Magallan/IMACS MOS | |
| 16:21:56.464 | +06:14:45.48 | 0.3318 | Magallan/IMACS MOS | |
| 16:21:56.533 | +06:07:44.87 | 0.3963 | Magallan/IMACS MOS | |
| 16:21:59.376 | +06:16:36.90 | 0.3461 | Magallan/IMACS MOS | |
| 16:22:02.466 | +05:59:54.13 | 0.3446 | Magallan/IMACS MOS | |
| 16:22:11.728 | +05:59:43.15 | 0.3490 | Magallan/IMACS MOS | |
| 16:22:19.007 | +06:14:34.83 | 0.3412 | Magallan/IMACS MOS | |
| 16:21:32.746 | +06:07:10.97 | 0.3412 | Magallan/IMACS MOS | |
| 16:21:32.731 | +06:07:13.82 | 0.3436 | Magallan/IMACS MOS | |
| 16:21:28.469 | +06:06:52.97 | 0.3412 | Magallan/IMACS MOS | |
| 16:21:33.158 | +06:07:26.67 | 0.3392 | Magallan/IMACS MOS | |
| 16:21:33.965 | +06:07:23.35 | 0.3434 | Magallan/IMACS MOS | |
| 16:21:31.694 | +06:07:44.14 | 0.3392 | Magallan/IMACS MOS | |
| 16:21:31.966 | +06:07:48.24 | 0.3441 | Magallan/IMACS MOS | |
| 16:21:35.638 | +06:06:28.89 | 0.3435 | Magallan/IMACS MOS | |
| 16:21:33.394 | +06:07:13.93 | 0.3320 | Magallan/IMACS MOS | |
| 16:21:32.830 | +06:07:24.31 | 0.3326 | Magallan/IMACS MOS | |
| 16:21:32.698 | +06:07:28.43 | 0.3443 | Magallan/IMACS MOS | |
| SDSS J1632+3500 | ||||
| 16:32:07.962 | +35:00:46.950 | 0.467806 | Gemini/GMOS-GN11AQ19 | |
| 16:32:08.188 | +35:00:12.340 | 0.459047 | Gemini/GMOS-GN11AQ19 | |
| 16:32:12.515 | +34:59:54.832 | 0.464104 | Gemini/GMOS-GN11AQ19 | |
| 16:32:07.433 | +35:00:25.044 | 0.471901 | Gemini/GMOS-GN11AQ19 | |
| 16:32:04.769 | +35:01:01.796 | 0.465734 | Gemini/GMOS-GN11AQ19 | |
| 16:32:09.859 | +35:00:40.741 | 0.453848 | Gemini/GMOS-GN11AQ19; star-forming | |
| 16:32:14.773 | +35:00:24.579 | 0.471658 | Gemini/GMOS-GN11AQ19 | |
| 16:32:02.585 | +35:01:43.225 | 0.469637 | Gemini/GMOS-GN11AQ19 | |
| 16:32:16.188 | +35:00:41.964 | 0.463060 | Gemini/GMOS-GN11AQ19 | |
| 16:31:55.872 | +35:00:10.084 | 0.471787 | SDSS DR12 | |
| 16:32:08.117 | +35:00:32.674 | 0.470646 | SDSS DR12 |
Note. Spectroscopic redshifts of cluster-member galaxies.
Footnotes
- *
Based on observations made with the NASA/ESA Hubble Space Telescope, obtained at the Space Telescope Science Institute, which is operated by the Association of Universities for Research in Astronomy, Inc., under NASA contract NAS 5-26555. These observations are associated with programs GO-13003, GO-14622, GO-14230, GO-14896, GO-11974, GO-11100.
- 16
- 17
- 18