ABSTRACT
Recent precise measurements of cosmic ray spectra revealed an anomalous hardening at ∼200 GV, observed by the ATIC, CREAM, PAMELA, and AMS02 experiments. Particularly, the latest observation of the  ratio by AMS02 demonstrated a flat distribution, which further validated the spectral anomalies of secondary particles. All those new phenomena indicated that the conventional propagation model of cosmic rays meets a challenge. In this work, the spatial-dependent diffusion coefficient
  is employed by tracing the source distribution under the physical picture of the two-halo model in the DRAGON package. Under such a scenario, the model calculation will result in two-component spectra for primary nuclei. Due to the smaller rigidity dependence of
  in the galactic disk, the ratios secondary-to-primary will inevitably be flatter and the expected anisotropy of cosmic rays will be much more attenuated than in the conventional model. As a result, we can reproduce the spectral hardening of protons, the flat ratios of
  and B/C, and consistent anisotropy from ∼100 GeV to ∼100 TeV by only adopting one set of spatial-dependent diffusion coefficients
  in a galactic disk.
1. INTRODUCTION
Great progress in cosmic ray (CR) spectrum measurement has been made in recent years with new a generation of space-borne and ground-based experiments in operation. The fine structure of spectral hardening for primary nuclei at 200 GV was observed by ATIC-2 (Panov et al. 2006), CREAM (Ahn et al. 2010), and PAMELA (Adriani et al. 2011). Just recently, AMS02 also confirmed the hardening, though the spectral line shape has a bit of a discrepancy (Giesen et al. 2015). Several kinds of explanations have been proposed to understand the origin of the spectral hardening, including: the contribution from nearby SNRs (Thoudam & Hörandel 2012), the reacceleration mechanism of old SNRs’ sources (Biermann et al. 2010; Thoudam & Hörandel 2014), the combination effects from different group sources (Zatsepin & Sokolskaya 2006; Yuan et al. 2011), and the spatial-dependent propagation (SDP) of CRs (Tomassetti 2012; Gaggero et al. 2015a; Jin et al. 2016).
Similar phenomena also happened in the secondary particles. The ratios of  and B/C are tagged to be the characteristic quantity to collimate the propagation of CRs. The predicted
  for secondary-to-primary leads to a sharp softening with the increase of energy in the conventional propagation model (CPM). Considering the uncertainty, the previous result of
  from the PAMELA experiment seemed to be compatible with the CPM at the energy range of GeV to tens of GeV (Adriani et al. 2010, 2014a). Thanks to AMS02 experiment, the ratios of
  and B/C are measured from GeV energy to hundreds of GeV with high precision (Giesen et al. 2015). It is very exciting that the ratio of
  is almost flat from ∼10 GeV to hundreds of GeV, which obviously challenges the CPM. This new result has stimulated several theoretical studies with a point of view from either exotic physics (Chen et al. 2015a, 2015b; Cheung & Sanford 2015; Geng et al. 2015; Hamaguchi et al. 2015; Huo et al. 2015; Ibe et al. 2015; Jin et al. 2015; Lin et al. 2015a) or improved diffusion effects (Cowsik & Madziwa-Nussinov 2015; Giesen et al. 2015; Kappl et al. 2015).
Besides the ratios of  and B/C, the anisotropy is another important symbol for examining the acceleration and propagation of CRs. The most serious challenge has always existed that the prediction in CPM is almost one order higher than observations (Hillas 2005; Blasi & Amato 2012). Some authors have proposed that the smaller rigidity dependence in high energy can attenuate the anisotropy problem (Tomassetti 2012; Vladimirov et al. 2012; Tomassetti 2015) or SDP can consistently reproduce the CR anisotropy in the energy range
  (Evoli et al. 2012).
With all of these high-precision measurements and anomalous phenomena in hand, one should ask whether a unified physical mechanism could produce them. A phenomenological model has been proposed to explain the anomalies of secondary particles by adopting the hard galactic plane component (HGPC) and predicted the flat distribution of  , which was consistent with the later observations of AMS02 (Guo et al. 2014). One possible origin of the HGPC is the smaller rigidity dependence of diffusion in the galactic plane, such as the Two-Halo-Model (THM). Inspired by this work, the optimal goal is to understand CPM and compensate the missing parts in the CPM. The diffusive properties were assumed to be the same and this hypothesis leads to a uniform spectrum index for primary particles and their production of secondary particles throughout the whole galaxy. A natural solution is to consider the SDP. One example is the THM proposed by Tomassetti (Tomassetti 2012), where the propagation volume was divided into two regions, the inner halo (IH) and outer halo (OH). The key point of THM is that the diffusion coefficient has a smaller rigidity dependence in the thin IH than in the wide OH, which can result in a two-component spectrum. Simultaneously, the expected anisotropy of CRs will be improved to reproduce the observations under such a scenario. In a one-dimensional (1D) analytical calculation, spectral hardening of nuclei spectra at a rigidity of ∼200 GV, observed by ATIC-2 (Panov et al. 2006), CREAM (Ahn et al. 2010), and PAMELA (Adriani et al. 2011), were successfully reproduced (Tomassetti 2012). The THM can work well for explaining the spectral hardening of the primary CRs.
The IH, actually called the galactic disk, contains almost all the galactic astrophysical objects, which can generate large irregularities of the turbulence and have important impacts on the diffusion properties. This implies that the diffusion coefficients are possibly related to the source distribution. On the contrary, the OH has scarce active sources and the dominant contributions of turbulence come from the CRs themselves (Tomassetti 2012). This means that the diffusion coefficients can be fixed to constant. Such a physical schema is consistent with the diffuse γ-ray observation by Fermi-LAT (Ackermann et al. 2012), which shows that the excess over the prediction of CPM only existed in the galactic plane. Furthermore, the observed power-law index ranging from  to
to  , results in a harder spectrum in the region, which is closer to the GC (Gaggero et al. 2015b). The spatial diffusion coefficients should also depend on the radial coordinate. This paper tends to reproduce the spectrum hardening of primary particles, the ratios of
  , B/C, and the anisotropy of CRs by introducing the SDP parameter, which is derived by tracing the source distribution and considering two diffusive regions, as in the so-called THM scenario.
The paper is organized as follows. Section 2 describes the SDP of CRs, Section 3 presents the results of the calculations, and finally, Section 4 gives the conclusions and discusses implications for future works.
2. SPATIAL-DEPENDENT PROPAGATION OF CRs
During the active phases of astrophysical objects such as SNRs (Bell 1978a, 1978b; Blandford & Ostriker 1978), the Galactic Center (GC) (Ptuskin & Khazan 1981; Said et al. 1981; Giler 1983; Guo et al. 2013a, 2013b) and other objects, the expanding diffusive shocks are generated and can accelerate the CRs to very high energy. Before arriving at Earth, those CRs have traveled in the galaxy for  years since diffusing away from their acceleration sites (Garcia-Munoz et al. 1977). During the journey, the impacts due to the fragmentation and radioactive decay in the interstellar medium (ISM) result in the production of secondary particles. Meanwhile, the electron suffers energy loss in the interstellar radiation field (ISRF) and magnetic field. The describing the long journey can be described by the propagation equation as
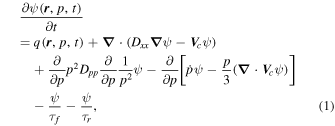
where  is the density of CR particles per unit momentum p at position
 is the convection velocity;
  is the momentum loss rate,
  and
and  are the characteristic timescales for fragmentation and radioactive decay, respectively; and Dxx and Dpp are the diffusion coefficients in coordinate and momentum space, respectively. Dpp is also used to describe the reacceleration process, which is coupled with the spatial diffusion coefficient Dxx as (Seo & Ptuskin 1994)

where vA is the Alfvén speed, and w is the ratio of magnetohydrodynamic wave energy density to the magnetic field energy density, which can be fixed to 1. The CRs propagate in an extended halo with a characteristic height zh, beyond which free escape of CRs is assumed.
In this formula, four stages of the evolution for observed CRs are also sketched out as injection, propagation, interaction with the ISM, and solar modulation.
2.1. Injection Spectra
Though many kinds of astrophysical objects can accelerate the CRs to very high energy, SNRs have long been considered as the dominant candidates of GCRs. The accelerated spectrum of primary CRs at the source region is assumbed to be a broken power-law function:
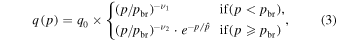
where p is the rigidity, q0 is the normalization factor for all nuclei, and the relative abundance of each nuclei follows the default value in the DRAGON package; pbr is the broken energy and  is are spectral index before and after the broken energy pbr.
  is used to describe the knee structure of the CR spectrum with the cutoff energy
  based on the Hörandel model (Hörandel 2004). Detailed information of the parameters are listed in Table 1 for both models of SDP and CPM.
Table 1. The Injection Spectra of Primary CRs
| Parameters | SDP | CPM |
| log(qi0)a | −1.365 | −1.356 |

|
2.0 | 1.9 |

|
2.4 | 2.43 |
| pbr(GV) | 9.0 | 9.8 |

|
4.0 | 4.0 |
Note.
aNormalization at 100 GeV in units of cm−2 s−1 sr−1 GeV−1.Download table as: ASCIITypeset image
2.2. Diffusion Coefficients
According to Formula (1), the density  is mainly dependent on the diffusion coefficients Dxx, Dpp, and Vc. In this work, the diffusion reacceleration (DR) is adopted to be the benchmark model and the convection can be ignored (Lin et al. 2015b). Moreover, Dpp can be derived from Dxx. That is to say that
  is only ascribed to Dxx. Based on the previous discussion about the THM scenario, Dxx can be described in a cylindrical coordinate system as
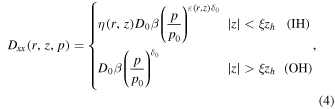
where  denotse the half thickness of IH and (1-ξ)zh is the half thickness of OH;
  (or D0) represents the normalization factor at the reference rigidity p0 in IH (or OH), and
  (or
(or  ) reflects the property of irregular turbulence int IH (or OH).The spatial-dependent
  and
and  factors in IH can be built according to the source distribution.
Figure 1 shows the radial distribution of astrophysical objects: pulsars, SNRs, and neutron stars (NSs) (Yusifov & Küçük 2004). Though the radial distribution slows down toward GC, the irregularity of turbulence and the magnetic field are larger near the GC region. Evidence that there is an increase in turbulence as one approaches the GC is provided by observations of the magnetic field (Beck 2009) and thermal bremsstrahlung (Planck Collaboration et al. 2011). Considering that SNRs are the dominant acceleration sources of CRs and the magnetic field information toward GC, the irregularity turbulence along the radius can be built as the red solid line; here we call it the “scale-line.” It is true that the shape of the scale-line is a bit subjective. However, the scale-line is only served to describe the radial dependent diffusion property, which can be determined by spectral observations as detailed in the following discussion. Furthermore, the galactic source is very sparse and can be neglected in OH. The dominant contribution of turbulence comes from the CRs themselves (Tomassetti 2012) and the diffusion coefficients can be dealt reasonably with a constant. So, the diffusion coefficients of  and
and  can be described in a unified formula with the symbol of F(r, z) as
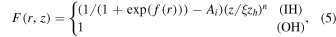
where f(r) is the scale-line; the factor  is used to describe the smooth connection between two halos and can be fixed as doen in Jin et al. (2016) and Tomassetti (2015); Ai is the normalization factor, and i denotes the symbols of
  and
and  , which are tuned to fit the observation spectra.
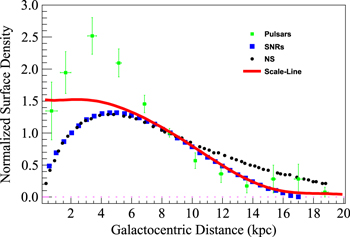
Figure 1. Radial distribution of astrophysical objects: pulsars, SNRs, and NSs (Yusifov & Küçük 2004). The red line is the “scale-line,” derived from the SNR distribution and extended to the GC region.
Download figure:
Standard image High-resolution imageIn sum, if we fix the  and
and  factors to 1, the propagation will become spatially independent. To apply the THM scenario to the spatial-dependent propagation, the only tactic is to tune the η and ε factor under the CPM frame work. The propagation parameter values for both models of SDP and CPM are listed in Table 2:
Table 2. The Detailed Propagation Parameters Using Both Models of SDP and CPM
| Parameters | SDP | CPM |
|---|---|---|
 a
a
|

|

|

|
0.52 | 0.4 |
| Vc | 0 | 0 |

|
16 | 25 |

|
5 | 5 |
| ξ | 0.13 | ∼ |
| Aη | 0.1 | ∼ |
| Aε | −0.18 | ∼ |
Note.
aAt p = 4 GV.Download table as: ASCIITypeset image
2.3. Interaction in ISM
The ISM accounts for about 10%–15% of the total mass in the galactic disk and its chemical composition is dominated by hydrogen and helium. The helium fraction is 11% by number density. The hydrogen gas nH includes three main components in molecular (H2), atomic (HI), and ionized (HII) states. The default gas distribution in DRAGON is adopted in our calculation, which is based on the survey results and related modeling (Gordon & Burton 1976; Bronfman et al. 1988; Cordes et al. 1991).
When the primary CRs propagate in the ISM, they will suffer energy loss or fragmentation to produce secondary particles. The unstable secondary isotopes will decay to stable ones. The characteristic scales for those processes are denoted as  ,
,  , and
, and  , as shown in Formula (1). The dominant processes of energy loss for nuclei include ionization and coulomb scattering, following from the work of Strong & Moskalenko (1998). The fragmentation of heavy nuclei is employed by the total cross-section calculation on the H and He targets with phenomenological scaling between them. The parameterization of the cross-section is adopted from Letaw et al. (1983). The fragmentation of light nuclei can be interpeted as the inelastic scattering proton, which can produce the secondary particles, such as γ-rays, neutrinos, positrons/electrons, and anti-protons. The total pp inelastic cross-section has been calculated using a fit from Tan & Ng (1983) and parameterization is from Groom et al. (2000). The anti-proton production has been adopted using the parameterization of the invariant
  -production cross-section from Tan & Ng (1983).
2.4. Solar Modulation
When the low energy CRs arrive at the solar environment, the direction of motion will be affected by the solar wind, which is called solar modulation. The force-field approximation is used to describe the solar modulation by the modulation potential Φ (Gleeson & Axford 1968). In this work, the modulation potential Φ is fixed as Φ = 600 MV for proton  and Φ = 300 MV for B/C.
3. CALCULATION RESULTS
In this work, we employ the publicly available numerical code DRAGON, which was designed to solve the SDP of CRs (Evoli et al. 2008). The iterative technology is applied to make the time dependent process reach steady state. In the iterative processes, the propagation of primary CRs is performed first, which can give the density distribution of CRs at every space point. Then the production of secondary particles can be calculated according to the spacial distribution of primary CRs. In the second running, the secondary particles can take part in the propagation. By adopting one set of diffusion coefficients, as discussed above, we make the calculation of primary spectrum for proton, the ratios of secondary-to-primary for  , B/C, and the anisotropy of CRs.
3.1. The Spectrum of Proton
Figure 2 shows the spectrum comparison between model calculations and the experimental results for protons. The solid black and dashed blue lines represent the model calculations in SDP and CPM, respectively. The spectrum break is clearly reproduced starting from hundreds of GeV, which are consistent with the observation from the AMS02 experiment below the TeV energy region and the observation from the CREAM experiment above the TeV energy region. The break position and amplitude are dependent on the propagation parameters ξ and  in the local region.
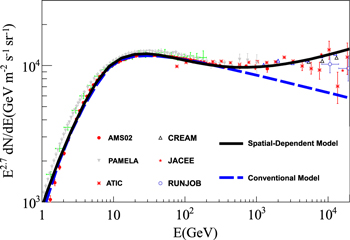
Figure 2. Comparison between model calculations and observations for the primary spectrum of protons. The experiment data come from: AMS02 (Giesen et al. 2015), ATIC (Panov et al. 2006), PAMELA (Adriani et al. 2011), CREAM (Ahn et al. 2010), JACEE (Asakimori et al. 1998), and RUNJOB (Apanasenko et al. 2001).
Download figure:
Standard image High-resolution image3.2. The Ratios of  and B/C

The production mechanism of  is different from B. pp-collision is the dominant process for
  production, which takes roughly 10% energy in the interaction. However, heavy nuclei, such as C, N, and O, lose one or more nucleons to become B, which keep the energy of a single nucleon in B the same as its mother. That is to say that the spectrum break for
  and B is at tens of GV and ∼200 GV, respectively. The left panel of Figure 3 shows the calculated
  and the right panel shows the B/C. The solid black and dashed blue lines present the calculated results from the SDP and CPM.
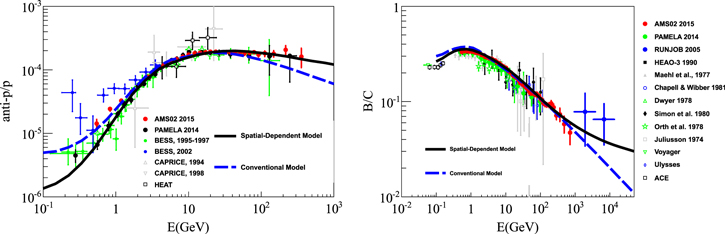
Figure 3. Calculated  (left panel) and B/C (right panel). The
  data from: AMS02 2015 (Giesen et al. 2015), PAMELA 2014 (Adriani et al. 2014a), PAMELA 2010 (Adriani et al. 2010), BESS 1995–1997 (Orito et al. 2000), BESS 1999 (Asaoka et al. 2002), CAPRICE 1994 (Boezio et al. 1997), CAPRICE 1998 (Boezio et al. 2001), and HEAT (Beach et al. 2001). The B/C data are from: AMS02 (Oliva 2015), PAMELA (Adriani et al. 2014b), RUNJOB (Derbina et al. 2005), Juliusson (1974), Dwyer (1978), Orth et al. (1978), Simon et al. (1980), HEAO-3 (Engelmann et al. 1990), Maehl et al. (1977), Voyager (Lukasiak 1999), Ulysses (Duvernois et al. 1996), and ACE (Davis et al. 2000), and for other references see Stephens & Streitmatter 1998.
Download figure:
Standard image High-resolution imageIt is very obvious that the calculation of  in SDP is flat at high energies and consistent with the measurement of AMS02 within errors, which is comparable to the results found when treating for secondary particle production in the source region (Guo et al. 2014; Tomassetti 2015). However, the calculation of
  in CPM shows a slow-down curve above tens of GeV and is lower than the AMS02 observation by hundreds of GeV. Certainly, the tension significance of
  in CPM with AMS02 data is dependent on the propagation parameters (Lin et al. 2015a). Owing to the higher break energy of B, the results from both SDP and CPM are consistent with current measurements below several hundreds of GeV. The significant deviation appears at energies above several TeV. In addition, it is noticeable that two model calculations are different below ∼GeV energy and the value in SDP is lower than CPM for both
  and B/C. The calculation of
  in SDP is consistent with the observation by PAMELA (Tomassetti 2015) and the calculation of
  in CPM is comparable to the AMS02 observation (Lin et al. 2015a). The reason is that
  in IH is lower than in OH, as given in formula (5), which makes low energy particles confined in the production region. In fact, we pay more attention to the result in high energy, while the difference in low energy does not affect our motivation.
Anyway, owing to its smaller rigidity dependece of  in IH, the secondary
  and Boron, induced by the primary CRs, inherit similar hard spectra, which make the ratio of
  considerably flatter than that from CPM. Such a tendency is favored by recent
  observations by AMS02 below the TeV energy region. In the future, high-statistic and above-TeV energy observations of
  and B/C by AMS02 can offer a crucial and definitive identification of this model.
3.3. Anisotropy Calculation
The dipole anisotropy can be estimated by the factor  (Evoli et al. 2012). Here the value of D is the diffusion coefficient, which is determined by
  and
and  . Based on formula (5) and Table 2, η = 0.25 ,and
  = 0.1 at the point of solar position. This will make the amplitude of anisotropy greatly attenuated. Figure 4 shows the comparison between the model calculation and the observation. The solid black line shows the expected result from SDP, which is roughly consistent with the experimental data from 100 GeV to 100 TeV energy. However, the calculation in CPM, shown as the dashed blue line, is higher by about one order than the observation. The SDP also works well for understanding the anisotropy problem.
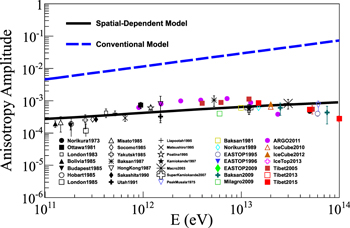
Figure 4. Calculated anisotropy of CRs. The data come from underground muon observations from: Norikura (1973; Sakakibara et al. 1973), Ottawa (1983; Bercovitch & Agrawal 1981), London (1983; Thambyahpillai 1983), Bolivia (1985; Swinson & Nagashima 1985), Budapest (1985; Swinson & Nagashima 1985), Hobart (1985; Swinson & Nagashima 1985), London (1985; Swinson & Nagashima 1985), Misato (1985; Swinson & Nagashima 1985), Socorro (1985; Swinson & Nagashima 1985), Yakutsk (1985; Swinson & Nagashima 1985), Banksan (1987; Andreyev et al. 1987), HongKong (1987; Lee & Ng 1987), Sakashita (1990; Ueno et al. 1990), Utah (1991; Cutler & Groom 1991), Liapootah (1995; Munakata et al. 1995), Matsushiro (1995; Mori et al. 1995), Poatina (1995; Fenton et al. 1995), Kamiokande (1997; Munakata et al. 1997), Marco (2003; Ambrosio et al. 2003), SuperKamiokande (2007; Guillian et al. 2007); and air shower array experiments from PeakMusala (1975; Gombosi et al. 1975), Baksan (1981; Alexeyenko et al. 1981), EASTOP (1995, 1996, 2009; Aglietta et al. 1995, 1996, 2009), Baksan (2009; Alekseenko et al. 2009), Milagro(2009; Abdo et al. 2009), ARGO (2011; Iuppa 2011), IceCube (2010, 2012; Abbasi et al. 2010, 2012), IceTop (2013; Aartsen et al. 2013), Tibet (2005, 2013, 2015; Amenomori et al. 2005; Amenomori 2013, 2015).
Download figure:
Standard image High-resolution image4. CONCLUSIONS AND IMPLICATIONS FOR FUTURE WORK
In this work, the SDP parameters of the diffusion coefficients are derived from the source distribution under the THM scenario. By adopting one set of parameters, the primary spectral hardening of protons is reproduced following previous works (Tomassetti 2012; Jin et al. 2016). Simultaneously, the new observed  and B/C ratios can be reproduced successfully. High statistic and TeV energy observations can offer a crucial and definitive identification of this model in the future. Remarkablly, the expected anisotropy is consistent with observations under this model.
Currently, we only carry out the calculation of charged CRs and compare with observations in solar system. The γ-ray emission can be used as a direct probe of the CR intensities and spectra in distant locations, which can serve to determine the SDP coefficients. Actually, the parameter of  reflects this property, as discussed in the work Erlykin & Wolfendale (2013) and Gaggero et al. (2015b). Further studies of the γ-ray emission can be performed in our future work.
We thank HongBo Hu, XiaoJun Bi, and Qiang Yuan for helpful discussions. This work is supported by the Ministry of Science and Technology of China, Natural Sciences Foundation of China (11135010, 11375209, 11405180, 11505291).
While this paper was in preparation, a similar paper discussing interpreting the spectral hardening under the two-halo model scenario was published. (Tomassetti 2015).