ABSTRACT
We present optical and infrared photometry of the unusual Type Ia supernova 2000cx. With the data of Li et al. and Jha, this constitutes the largest data set ever assembled for a Type Ia SN, more than 600 points in UBVRIJHK. We confirm the finding of Li et al. regarding the unusually blue B−V colors as SN 2000cx entered the nebular phase. Its I‐band secondary hump was extremely weak given its B‐band decline rate. The V minus near‐infrared colors likewise do not match loci based on other slowly declining Type Ia SNe, although V−K is the least “abnormal.” In several ways, SN 2000cx resembles other slow decliners, given its B‐band decline rate [Δm15(B) = 0.93], the appearance of Fe iii lines and weakness of Si ii in its premaximum spectrum, the V−K colors, and postmaximum V−H colors. If the distance modulus derived from surface brightness fluctuations of the host galaxy is correct, we find that the rate of light increase prior to maximum, the characteristics of the bolometric light curve, and the implied absolute magnitude at maximum are all consistent with a subluminous object with Δm15(B) ≈ 1.6–1.7 having a higher than normal kinetic energy.
1. INTRODUCTION
Astronomers try to understand the universe by looking for patterns in observed phenomena. Often, the patterns themselves are reason to believe in underlying, understandable physical mechanisms, while at other times the exceptions to the rules provide the motivation to expand our conceptions of the physical makeup of cosmic objects. In this paper, we present optical and infrared photometry of the very unusual supernova 2000cx. Previous optical data have been presented by Li et al. (2001), who describe SN 2000cx as “unique.”
SN 2000cx was discovered by Yu, Modjaz, & Li (2000) from images taken on 2000 July 17.5 and 18.4 UT as part of the Lick Observatory Supernova Search, using the 0.76 m Katzman Automatic Imaging Telescope (KAIT). This object was located at α = 1h24m4615, δ = +9°30′30
9 (equinox J2000.0), which is 23
0 west and 109
3 south of the nucleus of the S0 galaxy NGC 524. A spectrum taken on July 23 UT with the Nickel 1 m reflector at Lick Observatory (Chornock et al. 2000) revealed that the object was a peculiar Type Ia supernova, resembling SN 1991T a few days before maximum brightness, with prominent Fe iii absorption lines near 430 and 490 nm but weak Si ii at 612 nm. Optical photometry (Li et al. 2001) revealed that SN 2000cx is different from all known Type Ia SNe and that the light curves cannot be fitted well using the techniques currently available. The premaximum rise was relatively fast, similar to SN 1994D, but the postmaximum decline was relatively slow, similar to SN 1991T.
We present optical and infrared photometry of SN 2000cx, initiated at CTIO with the Yale‐AURA‐Lisbon‐Ohio (YALO) 1 m telescope on 2000 July 19 (UT), some 8 days before the time of B‐band maximum. We include data taken with the 0.76 m Manastash Ridge Observatory (MRO) of the University of Washington (also begun on July 19 UT), the CTIO 0.9 m telescope, and the Apache Point Observatory (APO) 3.5 m telescope. The calibration of the infrared light curves was primarily made possible with observations made with the Swope 1 m telescope at Las Campanas Observatory.
2. OBSERVATIONS
The YALO optical images were obtained using a Loral 2048 × 2048 CCD with a scale of 030 pixel−1, giving roughly a 10′ × 10′ field of view. Because of amplifier problems, only half of the chip was working before 2000 September. On 2000 September 6, this problem was fixed, but it was necessary to change the gain from 6.6 to 3.6 e− ADU−1. The read noise improved from 14.2 to 11 e−. The broadband JHK imges from the YALO telescope were obtained using a 1024 × 1024 HgCdTe HAWAII Array from Rockwell. The filters have over an 80% transmittance from 1.171 to 1.322 μm for the J band, 1.498 to 1.766 μm for H, and 2.012 to 2.278 μm for K. The scale of the infrared CCD is 0
20 pixel−1, making a total field of view of 3
3 × 3
3.
The camera used at the CTIO 0.9 m telescope contains the No. 3 Tektronix 2048 CCD, which is a thinned, antireflection‐coated, backside‐illuminated chip with 2K × 2K pixels. The scale and field size are 040 pixel−1 and 13
5, respectively. The filters used were U (liquid CuSO4), λ0 = 3575 Å, FWHM = 600 Å; B, λ0 = 4202 Å, FWHM = 1050 Å; V, λ0 = 5475 Å, FWHM = 1000 Å; R, λ0 = 6425 Å, FWHM = 1500 Å; and IKC, λ0 = 8075 Å, FWHM = 1500 Å. The UBVRIKC filters were from the CTIO facility set Tek 1.
Traces of the filters used with the YALO and CTIO 0.9 m telescopes are shown in Stritzinger et al. (2002). However, for our SN 2000cx observations with YALO, we did not use the very broad, nonstandard R filter used by Stritzinger et al. Instead, we used a much narrower, more standard filter (see Appendix).
The APO 3.5 m optical images were obtained using the facility CCD imager SPIcam, which contains a backside‐illuminated SITe chip of 2048 × 2048 pixels; 2 × 2 readout was used, giving a scale of 028 pixel−1 and a 4
78 × 4
78 field of view. The APO infrared images were obtained with the 3.5 m telescope using GRIM II, which contains a Rockwell 256 × 256 NICMOS3 HgCdTe array. The chip is sensitive from 1 to 2.5 μm with a quantum efficiency of approximately 70%, a gain of 4.7 e− ADU−1, and a read noise of 110 e−. The J, H, and K′ filters transmit at 1.265 ± 0.267, 1.646 ± 0.339, and 2.114 ± 0.343 μm, respectively.
The CCD camera at the MRO 0.76 m telescope uses a Ford Aerospace chip of 1024 × 1024 pixels, with a read noise of 8 e−. The scale is 061 pixel−1, giving a 10
32 × 10
32 field of view. It contains UBVRI “Harris” filters.
Instrumental YALO and 0.9 m magnitudes were measured as point‐spread function (PSF) magnitudes using the DAOPHOT package (Stetson 1987, 1990). A transformation equation of the form m = f(M, I, X, T), as suggested by Harris, Fitzgerald, & Reed (1981), was used. Here m is the observed (i.e., instrumental) magnitude, M is the tabulated magnitude (e.g., from Landolt 1992), I is the tabulated color index, X is the air mass, and T is the time during the night.
Using the observations of the Landolt (1992) standards, we determined zero points, color terms, and atmospheric terms. This allowed us to calibrate the field stars near SN 2000cx. Photometry of the supernova itself is then tied to the Landolt standards via these field stars. This allows us to derive accurate values for the SN even if it is observed under nonphotometric conditions. Once the field‐star sequences were established, we dropped the air‐mass term because the differential air‐mass corrections within a CCD frame are negligible. The time‐variable term was dropped because of its demonstrated small contribution to the final photometry (Suntzeff et al. 1999).
Once the MRO and APO images were bias subtracted and flattened, we obtained aperture magnitudes in the IRAF2 environment, using PHOT within the APPHOT package, and calibrated the field stars using mknobsfile, fitparams, and evalfit within the PHOTCAL package. The transformation equations were configured to produce V magnitudes, B−V, V−R, and V−I colors. The APO infrared data were reduced using IRAF scripts written by Alan Diercks, and the IR mosaics were produced using Eugene Magnier’s image‐processing program MANA. We then carried out aperture photometry within IRAF.
The mean optical transformation coefficients for the four optical systems described above are found in Table 1.
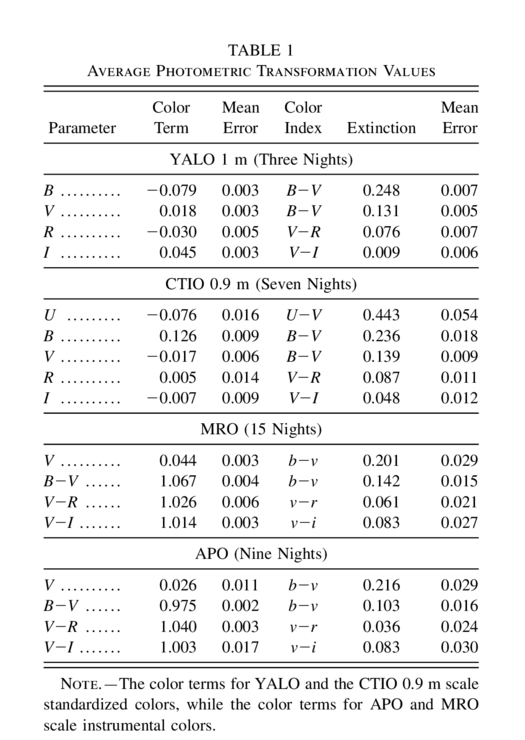 |
Figure 1 shows a combined BVR image taken with the CTIO 0.9 m telescope when SN 2000cx was on the rise. Some nearby field stars are marked. Optical photometry of these stars, obtained from imagery with YALO and MRO, is found in Table 2. A comparison of the independent YALO, MRO, and Li et al. (2001) values for the field stars marked as numbers 2, 4, and 8 in Figure 1 shows good agreement. The range of the mean values for these three stars is 16–29 mmag in B, 12–17 mmag in V, 14–30 mmag in R, and 6–36 mmag in I, respectively. Thus, photometry of stars can be carried out at the ∼0.02 mag level.
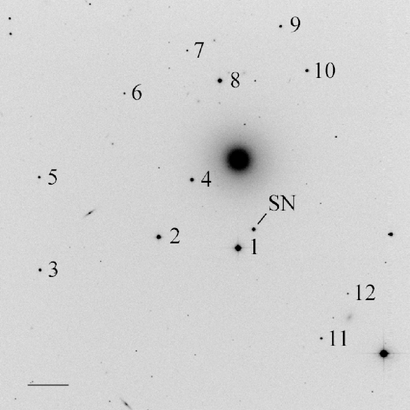
Fig. 1.— Finding chart for local standards near SN 2000cx in NGC 524. The image is a combined BVR image taken with the CTIO 0.9 m telescope. North is up, and east is to the left. The horizontal bar shows a scale of 1′.
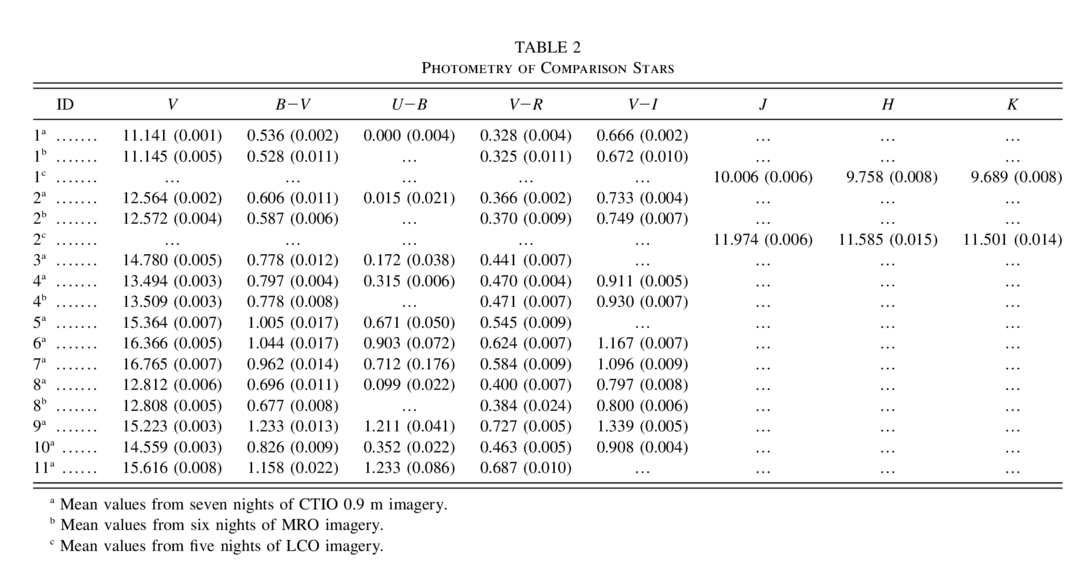 |
Absolute calibration in J, H, and K was done via observations of the SN 2000cx field along with infrared standards of Persson et al. (1998), using the LCO Swope 1 m telescope on five nights in 2001 October and November. The mean JHK values for field stars 1 and 2 are given in Table 2. Because of the size of the field of view of the IR camera on the APO 3.5 m telescope, only star 1 and SN 2000cx were always on the chip while dithering. To make the fullest use of all the nights when IR data were taken (i.e., photometric and nonphotometric nights), we chose to reduce all our IR photometry of SN 2000cx (i.e., from YALO and APO) with respect to field star 1.
Our infrared YALO images were reduced using a package of scripts written by one of us (N. B. S.),3 which runs in the IRAF environment. This package contains tasks that fill out the file headers with information necessary for subsequent reduction and take care of bias correction, field flattening, masking out bad pixels, and vignetting. Fortunately, field star 1 and the SN were located out of the zone of vignetting, so we did not have to worry about that at all. A section free of stars was chosen for each night so that we could calculate a clean sky level and subtract that from all individual frames.
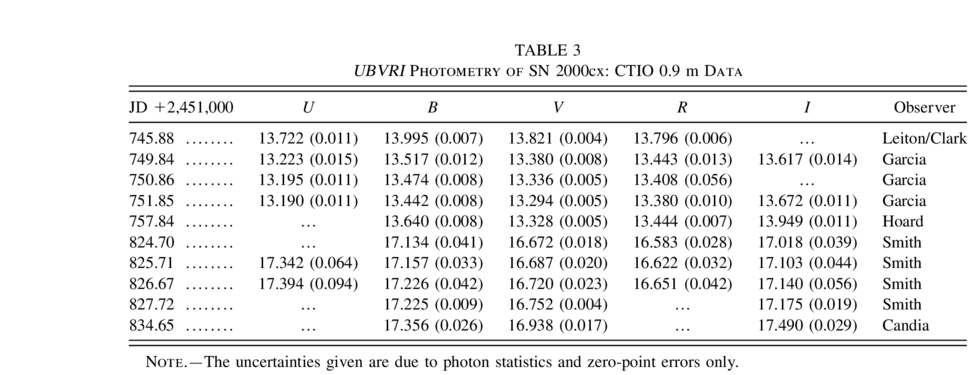
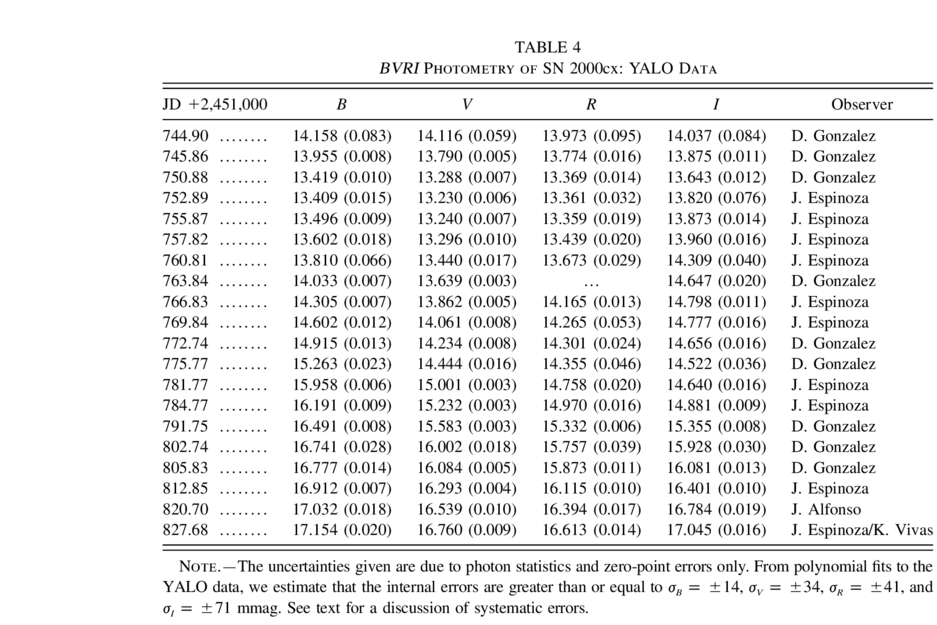
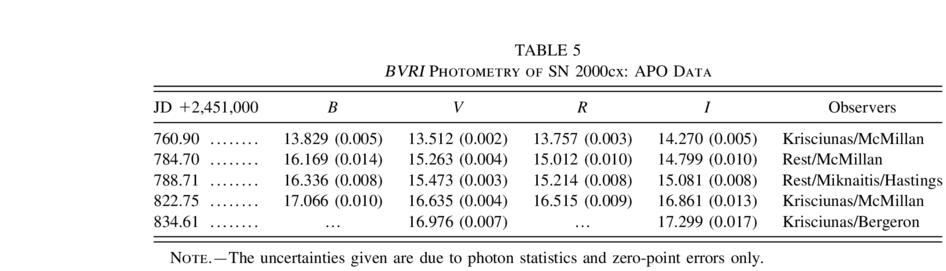
Tables 3–pasp_115_805_277tb4pasp_115_805_277tb56 contain our optical data from the CTIO 0.9 m, YALO, APO, and MRO telescopes, respectively. In effect, we have four independent optical data sets, with two independent calibrations. The uncertainties of the values in the tables derive from photon statistics and the uncertainties of color corrections and are to be considered minimum internal errors. A more accurate estimate of the accuracy of our photometry is obtained by fitting fourth‐order polynomials to the light curves, telescope by telescope and filter by filter, to measure the rms residuals of such fits, under the assumption that the variation of light of the SN is a smooth function for each filter. We have calculated these residuals for our two largest data sets, using data prior to 25 days after the time of B‐band maximum. For the YALO data, the internal errors are σB = ±14, σV = ±34, σR = ±41, and σI = ±71 mmag. For the MRO data, the internal errors are σB = ±6, σV = ±20, σR = ±43, and σI = ±51 mmag.
 |
 |
 |
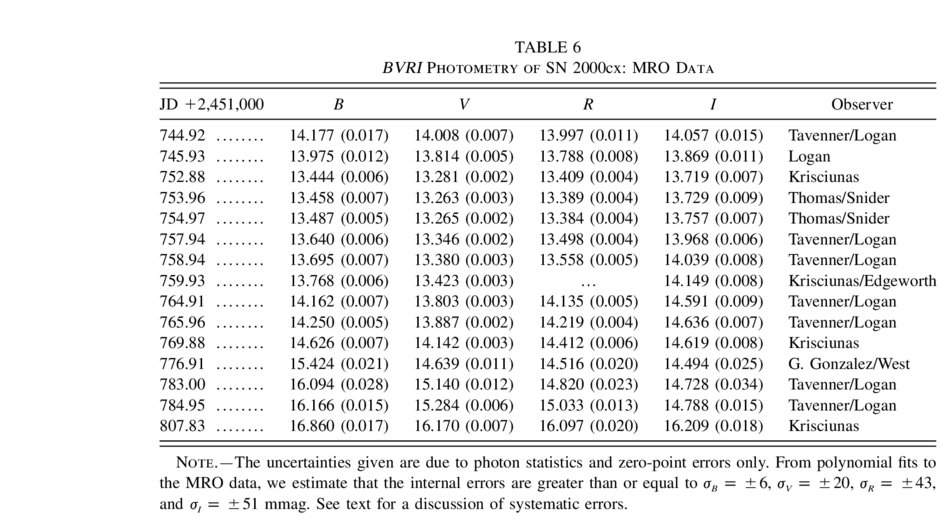 |
Figure 2 shows our optical data. Figure 3 is the same as Figure 2, but with the addition of the KAIT and Wise Observatory data given by Li et al. (2001), plus data obtained by Jha (2002) with the 1.2 m telescope at the Fred L. Whipple Observatory at Mount Hopkins, Arizona.
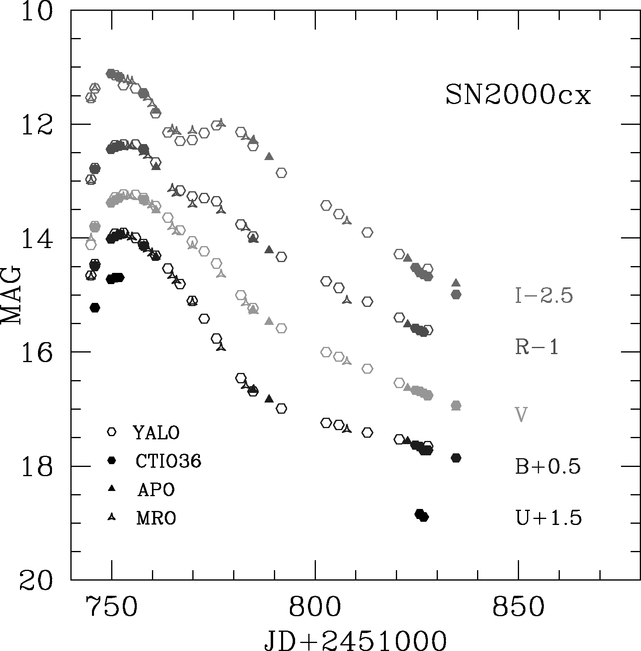
Fig. 2.— U‐, B‐, V‐, R‐, and I‐band light curves of SN 2000cx, showing the optical data presented in this paper. The data are coded by telescope.
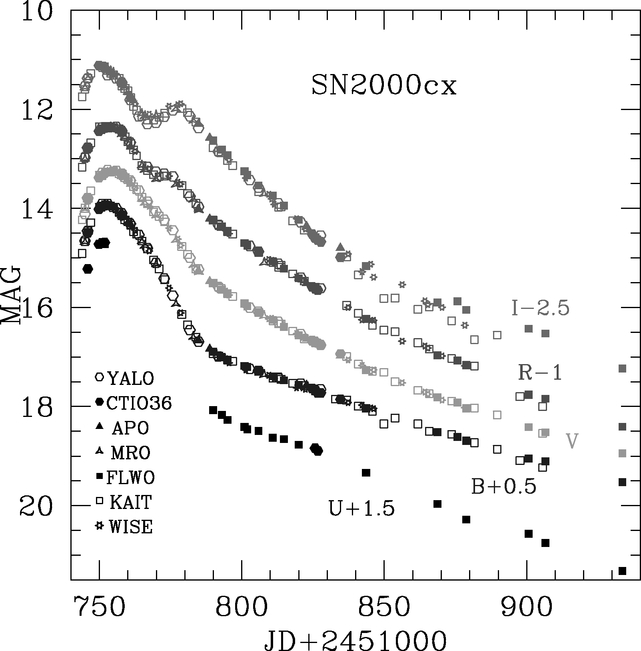
There are systematic differences between different subsets of the data. With the sense of Δ ≡ YALO minus MRO, at the time of B‐band maximum ΔB = -0.04, ΔV = -0.05, ΔR = -0.04, ΔI = +0.05 mag. At t = 17.4 days, from Tables 4 and 6 we find ΔB = -0.02, ΔV = -0.08, ΔR =−0.15, ΔI = +0.16 mag. The disagreement in V, R, and I is large.
Now, with the sense of Δ ≡ CTIO 0.9 m minus MRO, for the data within 7 days of maximum we find ΔB = -0.02, ΔV = -0.04, ΔR = -0.05, ΔI = 0.00 mag. This is not a significant improvement on the YALO versus MRO situation at maximum. However, YALO photometry versus CTIO 0.9 m data within a week of maximum is in agreement at the 0.02 mag level or better for B, V, and R. In spite of systematic differences between data sets obtained with different telescopes and different filters, at least we know the apparent magnitudes at maximum to ±0.03 mag.
The systematic differences in the photometry are undoubtedly due to differences in the actual filters used, coupled with the nonstellar spectral energy distribution of the SN. Very late time I‐band data are particularly discordant, more than 0.7 mag (KAIT vs. FLWO). Although some of the optical spectra discussed by Li et al. (2001) cover the full I‐band [at 2, 6, 7, 32, 42 days after T(Bmax) and later], to reconcile all data of SN 2000cx taken with different telescopes is beyond the scope of this paper.4
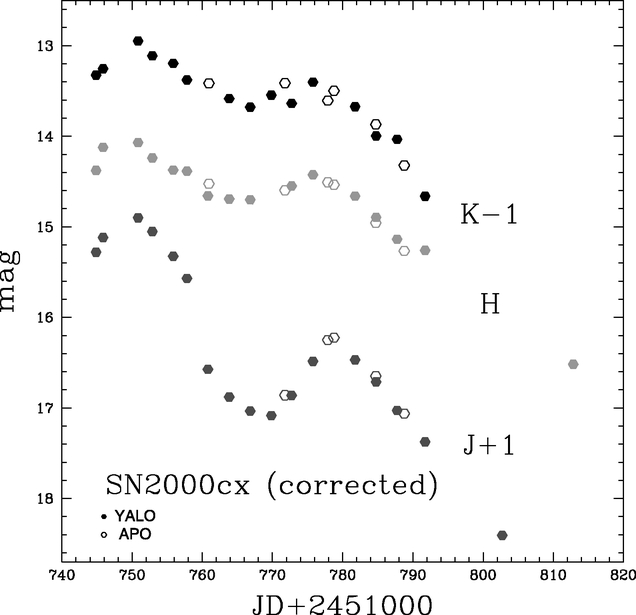
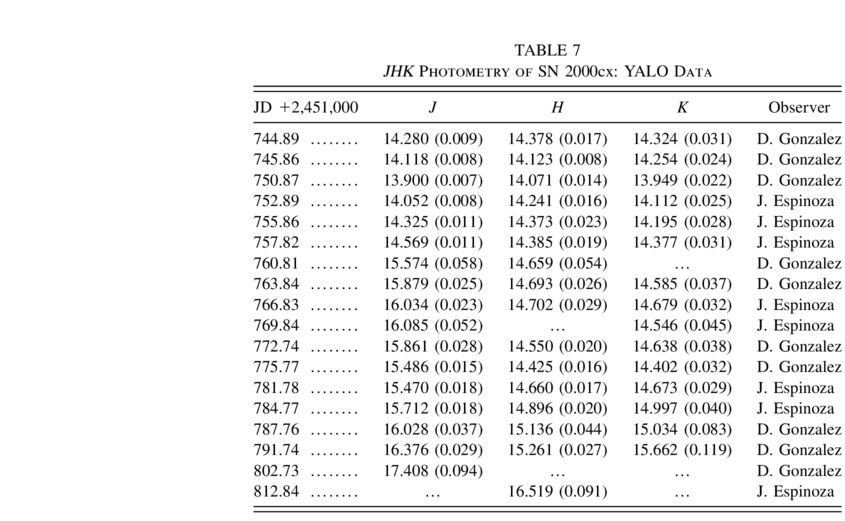
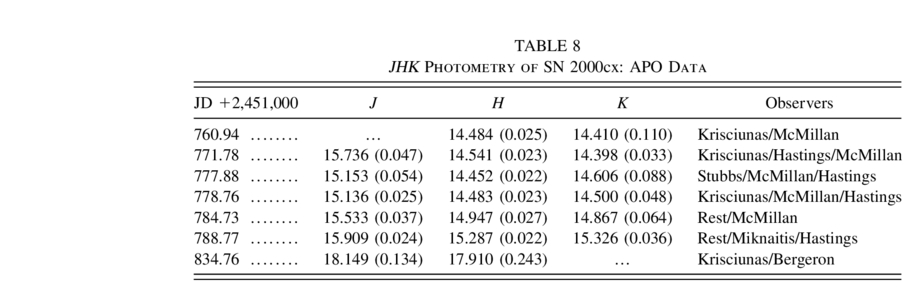
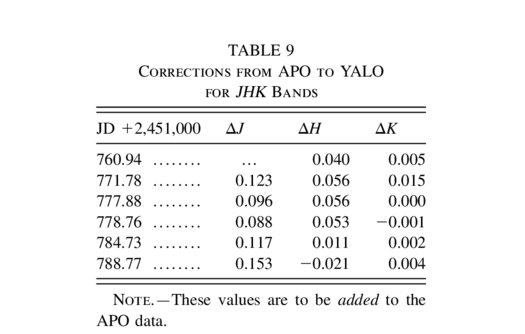
Tables 7 and 8 contain the infrared data from YALO and APO, respectively. Table 9 has corrections to place the APO data (which are fewer in number) on the YALO filter system, using the method of Stritzinger et al. (2002) and Krisciunas et al. (2003). To our knowledge, only two infrared spectra of SN 2000cx itself exist (Rudy et al. 2002), and these were taken 6 and 7 days, respectively, before the observed date of B‐band maximum. To calculate the filter corrections for the APO data of SN 2000cx, we used the infrared spectra of SN 1999ee (Hamuy et al. 2002). In Figures 4 and 5, we show our infrared photometry without, and with, the filter corrections. The agreement of the J‐band data sets is clearly better with the corrections.
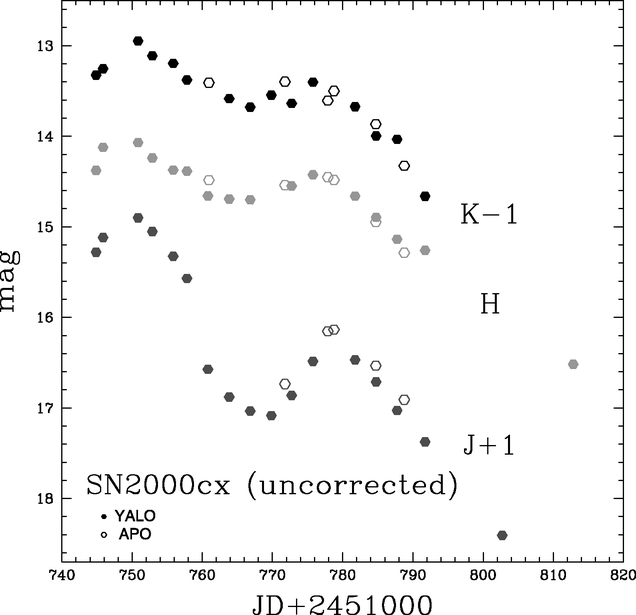
Fig. 4.— Infrared light curves for YALO and APO. The K‐ and J‐band data have been offset by −1 and +1 mag, respectively. APO data for JD 2,451,834 are off the right‐hand side of the plot.
 |
 |
 |
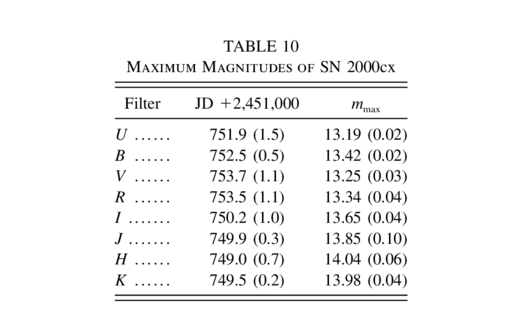
Finally, in Table 10 we give the times of maximum, as observed by us in the different bands. Our time of B‐band maximum is 0.3 day later than that found by Li et al. (2001), well within the uncertainty. While they found that the V‐band maximum occurred 2.1 days after B‐band maximum, we find a lag of only 1.2 days. However, this difference is not statistically significant.
 |
Jha (2002) also obtained UBVRI photometry of SN 2000cx, although with a large gap in time after maximum. Late‐time photometry (2001 July 10) with the Hubble Space Telescope (HST), using the F675W and F814W filters, is given by Li et al. (2002). Altogether, the photometric database of SN 2000cx amounts to 642 data points. To our knowledge, it is the largest data set ever obtained for a Type Ia SN.
3. GENERAL DISCUSSION
A vast majority of the light curves of Type Ia SNe can be fitted into a classification scheme in which the shape of the light curves is correlated with the intrinsic luminosity of the SN (Phillips 1993; Riess, Press, & Kirshner 1996; Perlmutter et al. 1997; Phillips et al. 1999). Li et al. (2001) remark that the multicolor light curve shape (MLCS) fit to their data for SN 2000cx is the worst fit they have ever seen. SN 2000cx was a reasonably fast riser, but a slow decliner. That would mean that the “stretch factor” used with the method of Perlmutter et al. (1997) would give a different value prior to maximum compared to after maximum. Since the stretch factor in B and V is related to the intrinsic luminosity, how does one determine the intrinsic luminosity of this SN?
NGC 524, the host galaxy of SN 2000cx, has had its distance modulus measured via the surface brightness fluctuation (SBF) method. Tonry et al. (2001) obtain m−M = 31.90 ± 0.20 for the distance modulus. Li et al. (2001) obtained m−M = 32.53 ± 0.35 using MLCS. Using the corrected recession velocity of NGC 524 in the Local Group frame of 2192 km s -1 and a Hubble constant of 74 km s -1 Mpc -1, in agreement with the HST Key Project value (Freedman et al. 2001), we obtain a distance modulus of 32.36 mag.
SN 2000cx was located in the outer regions of an early‐type galaxy. Since early‐type galaxies contain minimal amounts of dust, and the B−V colors of SN 2000cx were particularly blue, we explicitly assume that this SN was unreddened in its host. We shall correct for reddening due to dust in our Galaxy (see below).
Krisciunas et al. (2003) showed that the H‐band absolute magnitudes of Type Ia SNe 10 days after the time of B‐band maximum appear to be a flat function of the decline rate Δm15(B). For a sample of nine objects with Δm15(B) < 1.3, they found a mean H‐band absolute magnitude of −17.91 ± 0.05. The observed H‐band magnitude of SN 2000cx 10 days after B‐band maximum is 14.64 ± 0.04. From the Galactic reddening maps of Schlegel, Finkbeiner, & Davis (1998), we estimate that the color excess E(B−V) = 0.082 mag in the direction of SN 2000cx. Using the interstellar extinction model of Rieke & Lebofsky (1985), we estimate that the H‐band extinction, due only to the effect of dust in our Galaxy, is 0.04 mag. Assuming that the absolute magnitude of SN 2000cx is also −17.91, given its corrected H‐band magnitude of 14.60, we obtain a distance modulus m−M = 32.51. Thus, the distance moduli from MLCS, Hubble’s law, and the H‐band analysis are in reasonable agreement, with an unweighted mean value of 32.47 ± 0.05, corresponding to a distance of 31 ± 1 Mpc.
Given the observed V‐band maximum of 13.25, AV ≈ 3.1 × 0.082 = 0.25, and a distance modulus of 32.47, the implied V‐band absolute magnitude of SN 2000cx is −19.47, which is comparable to the mean of MV of the slow decliners (Krisciunas et al. 2003, Fig. 13).
However, Ajhar et al. (2001) have shown that there is excellent agreement between distance determinations using SBF and other methods. The host of SN 2000cx is actually a bit close (cz<3000 km s -1) to derive its distance via Hubble’s law. The MLCS distance can also be doubted because the light curves cannot be fitted well using MLCS templates. Also, on the basis of a larger sample of objects, it may turn out that H‐band absolute magnitudes do show some kind of decline rate relation. In that case, should we use the decline rate of SN 2000cx or some modified value that takes into account its different rise and decline rates?
Let us assume that the Tonry et al. (2001) distance modulus of m−M = 31.90 ± 0.20 is correct. On an H0 = 74 scale, this would be m−M = 31.84 mag. Adopting AB = 0.34, AV = 0.25, and AI = 0.12 mag, and the maximum magnitude values given in Table 10, we obtain absolute magnitudes of MB = -18.76, MV = -18.84, MI = -18.31, with uncertainties of ±0.20 mag. These correspond to Δm15(B) in the range 1.4–1.7 (Krisciunas et al. 2003, Fig. 13); MH(t = 10 days) would be −17.24, comparable to that of SN 2000bk, which was a fast decliner with Δm15(B) = 1.63.
Krisciunas et al. (2001, Figs. 16 and 17) devised a quantitative measure of the strength of the I‐band secondary hump common to Type Ia SNe, namely, the mean flux with respect to maximum from 20 to 40 days after the time of B‐band maximum. They found that 90% of Type Ia SNe have values of 〈I〉20–40 that are well correlated with the B‐band decline rate Δm15(B). There were two exceptions to the rule, showing that there can be objects with identical decline rates in B and V but much stronger or weaker secondary humps in I. For SN 2000cx we find that 〈I〉20–40 = 0.35. This would imply Δm15(B) ≈ 1.7 like the fast decliners SNe 1992bo or 1993H. But SN 2000cx is a slow decliner, with Δm15(B) = 0.93. If we were to add a point in Figure 17 of Krisciunas et al. (2001) corresponding to SN 2000cx, it would be the most discrepant point in the graph.
Li et al. (2001) point out that the stretch factor for the premaximum data points (t = -8 to 1 day) corresponds to Δm15(B) = 1.64 ± 0.02. In various ways, SN 2000cx masquerades as a fast Type Ia SN and also as a slow one.
One of the patterns exhibited by many unreddened Type Ia SNe is that their B−V colors from 30 to 90 days after the time of V‐band maximum follow a particular linear trend, whether they are fast decliners or slow decliners (Lira 1995; Phillips et al. 1999). Li et al. (2001) and Cuadra et al. (2001) noted that SN 2000cx was roughly 0.2 mag bluer than the Lira line. In Figure 6, we show the B−V data from YALO, the CTIO 0.9 m, APO, and MRO telescopes. The data have been dereddened by 0.082 mag to account for dust in our Galaxy (Schlegel et al. 1998). The data after JD 2,451,784 are, on average, 0.217 mag below the Lira line. We assume, because SN 2000cx occurred in the outer regions of an early‐type galaxy, that it suffered no host reddening. But if its light was affected by dust in the host galaxy, then the points in Figure 6 should be displaced even further below the Lira line. Truly, the B−V colors of this SN are unusual.
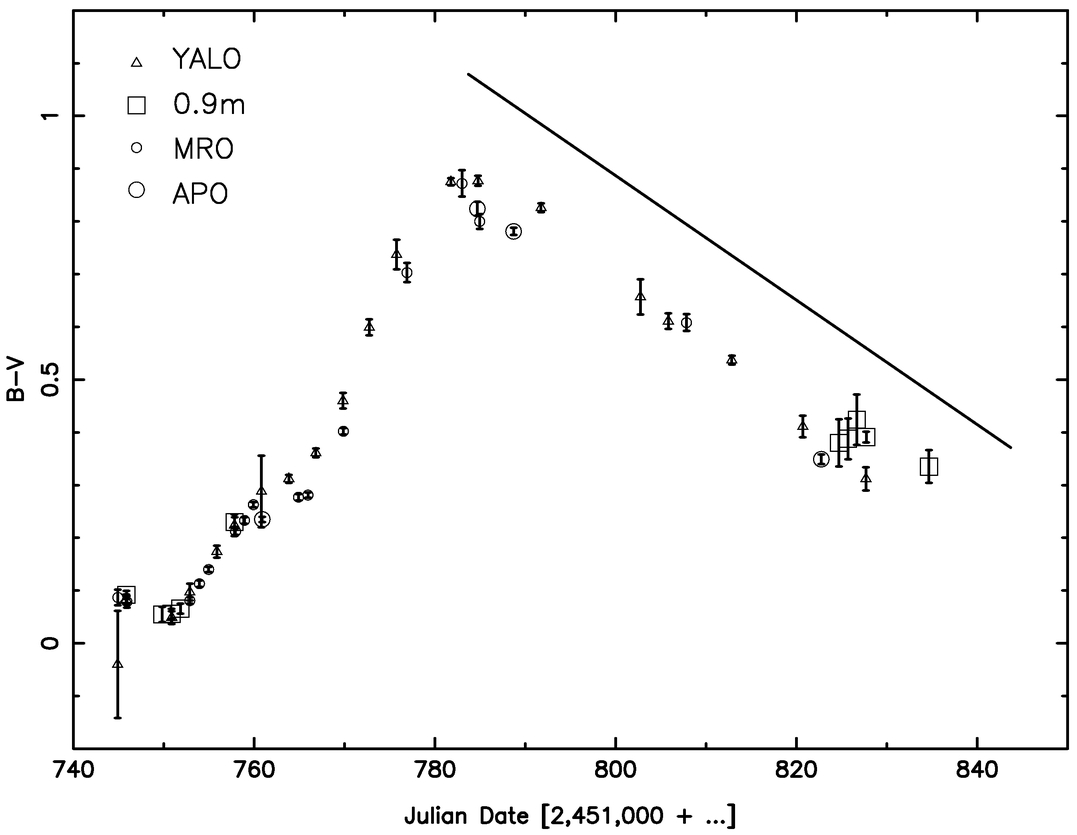
Fig. 6.— B−V color curve of SN 2000cx, showing the optical data presented in this paper. E(B−V) = 0.082 has been subtracted from the data to eliminate the effect of dust in our Galaxy (Schlegel et al. 1998). The “zero reddening line” of Lira (1995) is shown, adjusted to the time of V‐band maximum given in Table 10. If SN 2000cx has any host reddening, then the data points corresponding to unreddened photometry would be even farther below the Lira line.
In Figures 7, 8, and 9, we show the JHK light curves of SN 2000cx along with data of other objects: SNe 1999aw (Strolger et al. 2002), 2001el (Krisciunas et al. 2003), 1999ac (Phillips et al. 2002; M. M. Phillips et al. 2003, in preparation), 2000bk (Krisciunas et al. 2001), and 1986G (Frogel et al. 1987). The light curves are ordered from top to bottom by the decline rate Δm15(B).
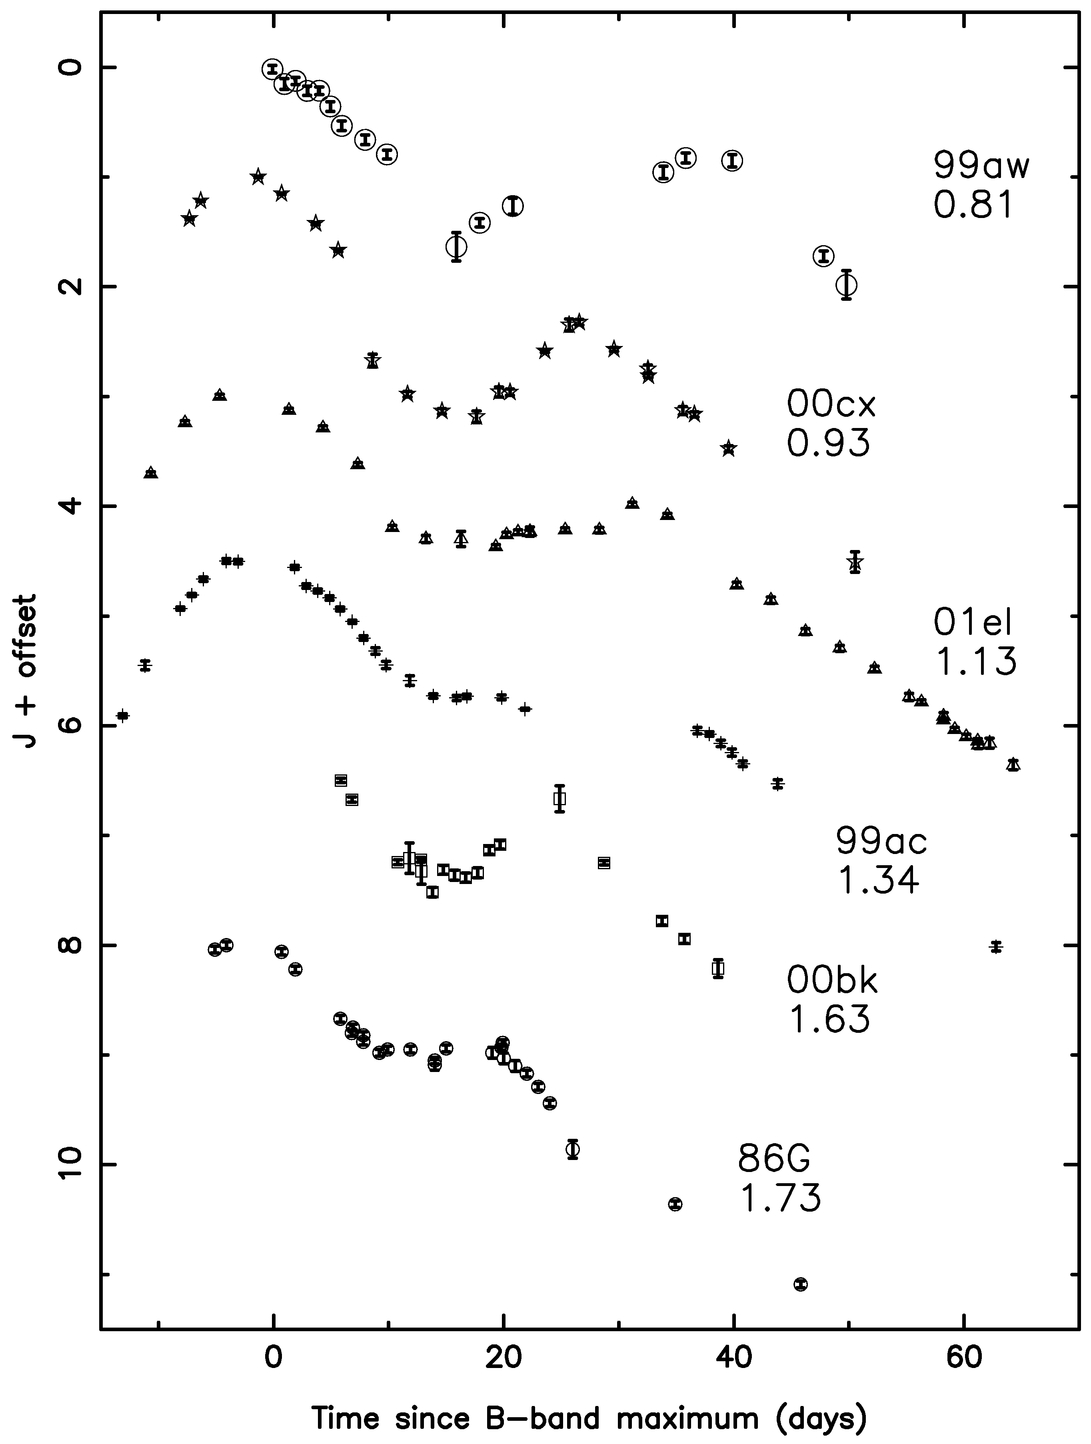
Fig. 7.— J‐band light curve of SN 2000cx along with data of SNe 1999aw (Strolger et al. 2002), 2001el (Krisciunas et al. 2003), 1999ac (Phillips et al. 2002, 2003, in preparation), 2000bk (Krisciunas et al. 2001), and 1986G (Frogel et al. 1987). The light curves are ordered from top to bottom by the decline rate parameter Δm15(B).
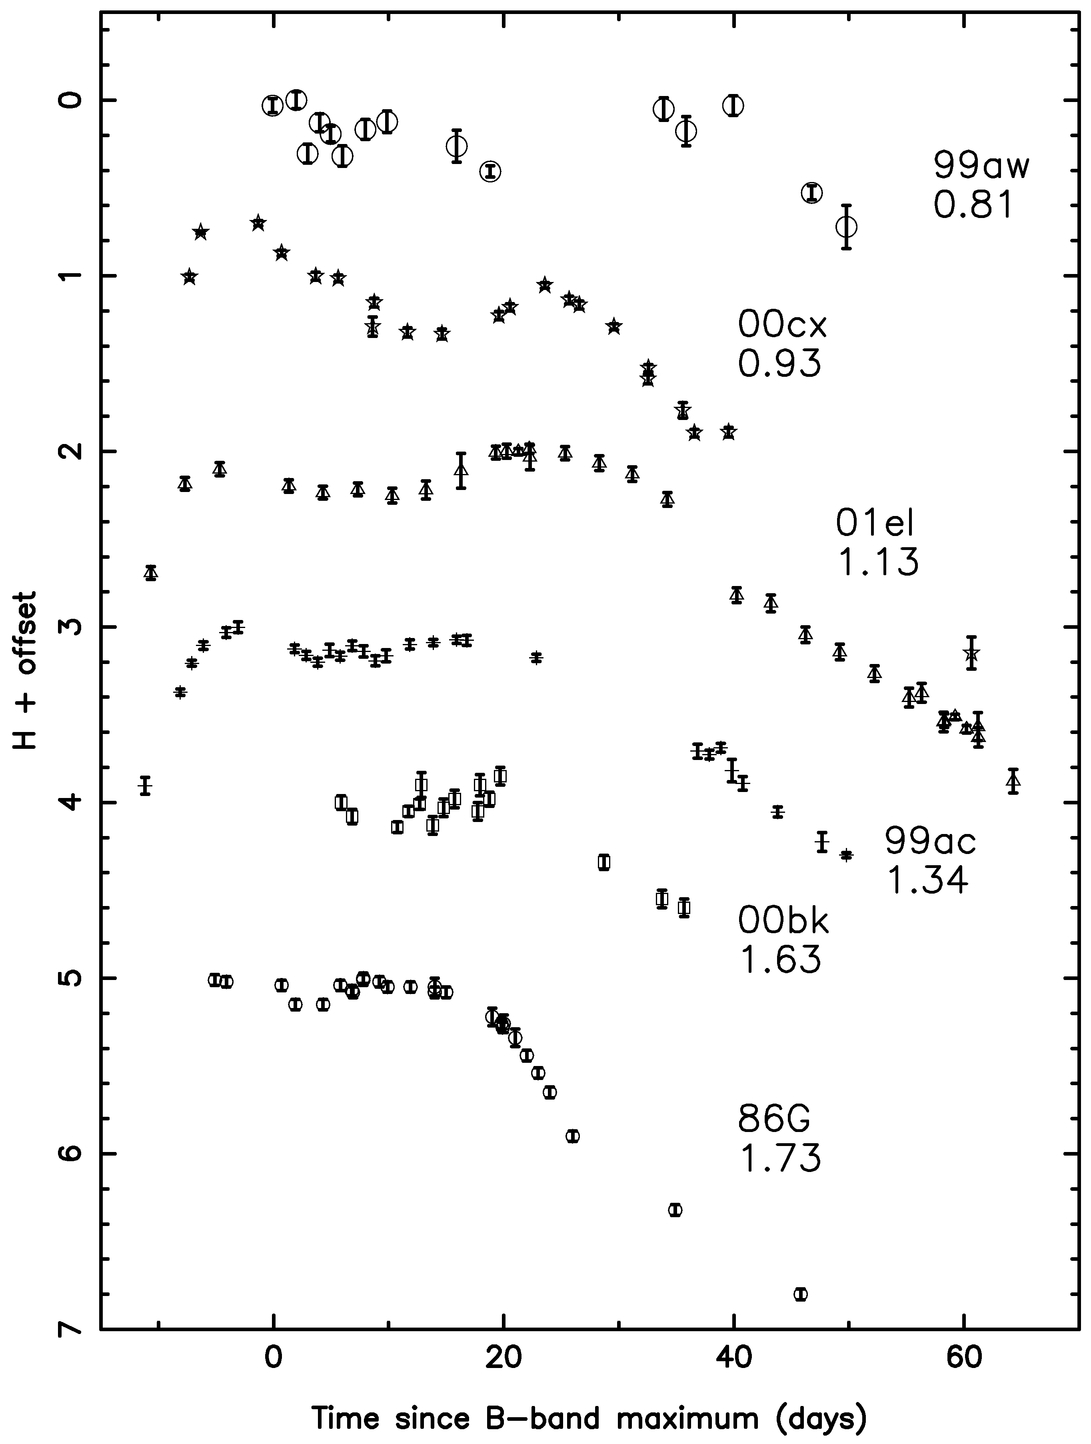
Fig. 8.— Same as for Fig. 7, but for the H band.
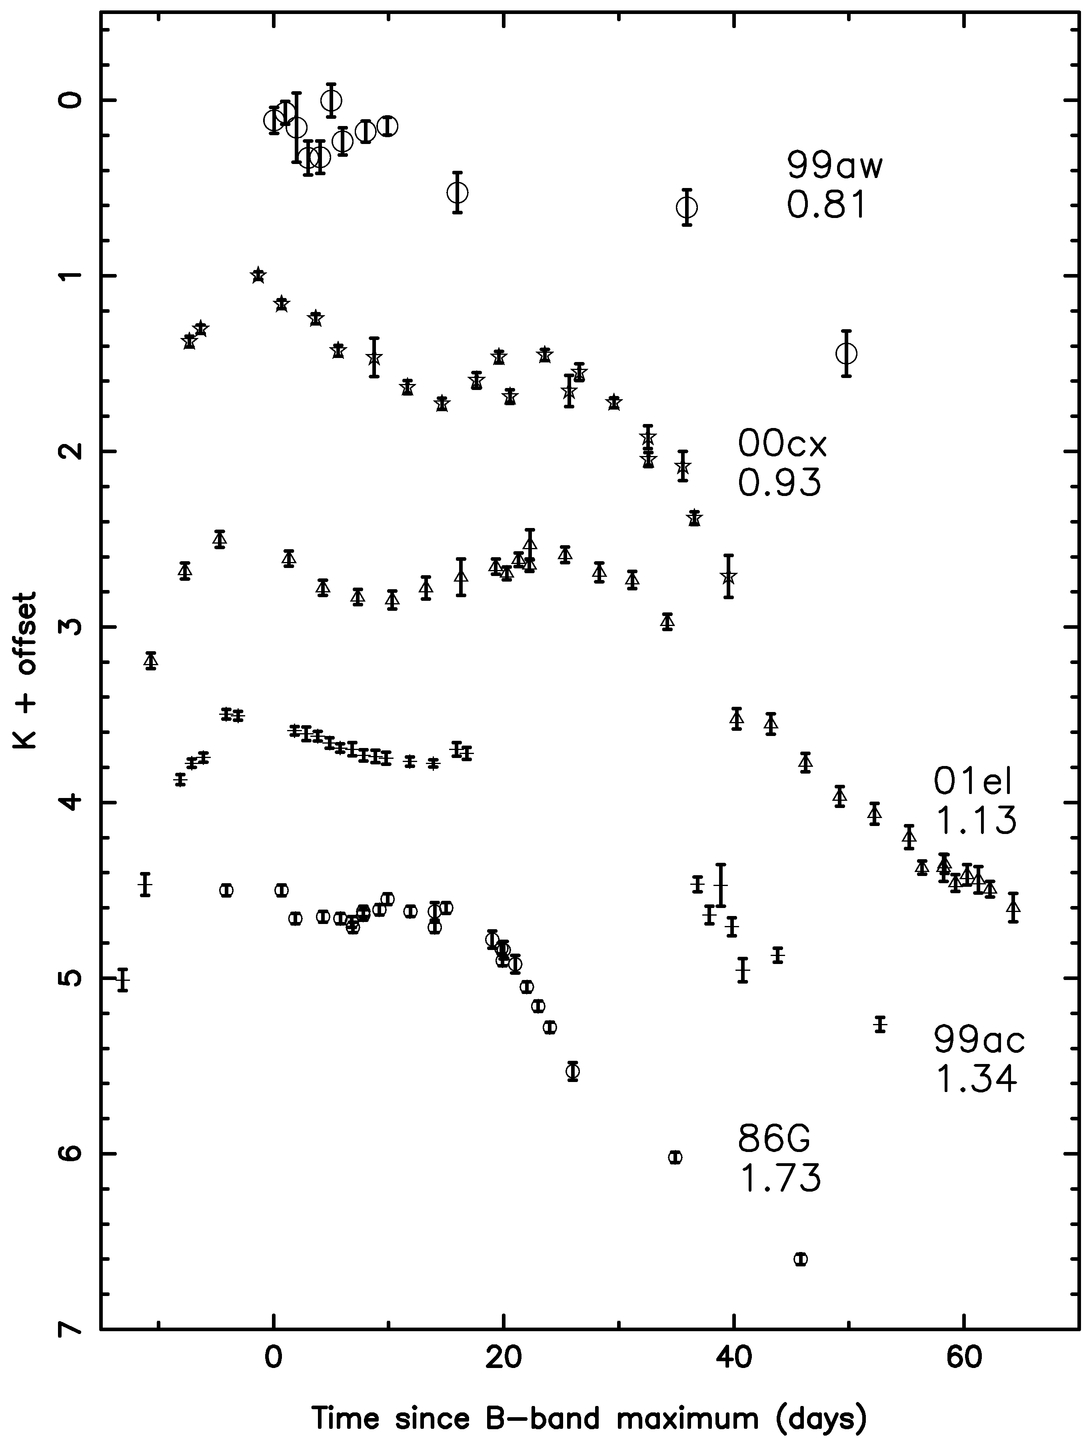
Fig. 9.— Same as for Fig. 7, but for the K band. No K‐band data were taken of SN 2000bk.
We the note the extremely deep dip in the J‐band in the 20 days after maximum. We also note the similarity of the SN 2000cx J‐band data with that of SN 2000bk, a fast decliner. The latter had an earlier secondary J‐band maximum, however. We also note, whereas most Type Ia SNe have relatively flat H‐ and K‐band light curves in the 20 days after maximum, SN 2000cx showed decreasing flux at this epoch.
Krisciunas et al. (2000, 2001, 2003) found that Type Ia SNe that are midrange decliners appear to exhibit uniform V minus infrared color curves from about 1 week before maximum until 3 or more weeks after maximum. They asserted that the unreddened loci can be used to derive the total extinction suffered by the light of a Type Ia SN on its way to our viewing location in the Galaxy. They found that V−H and V−K were particularly well behaved, and modeling by Höflich given in Krisciunas et al. (2003) confirms this observational result from a theoretical standpoint. Krisciunas et al. (2000, 2001) also noted that fast decliners and slow decliners have different unreddened loci. The slow decliners have bluer loci, and the fast decliners have redder loci.
Using data of the slow decliners SNe 1999aa (Krisciunas et al. 2000), 1999aw (Strolger et al. 2002), and 1999gp (Krisciunas et al. 2001), which appear to be unreddened in their hosts, we can correct the V−J, V−H, and V−K colors for the effect of dust in our Galaxy (Schlegel et al. 1998) and construct unreddened loci for slowly declining Type Ia SNe. We also used the optical data of SN 1999ee (Stritzinger et al. 2002) along with some unpublished IR data of SNe 1999ee and 2001ba taken at Las Campanas Observatory and CTIO to constrain the shape of the unreddened loci.
Following Krisciunas et al. (2000), let t equal the number of days since the time of B‐band maximum and Tc be some “crossover time” when the slope in the color curve has a sudden change. We consider only the data from −9<t<27 days and construct the simplest form of unreddened loci that can fit the data. For V−J, we have
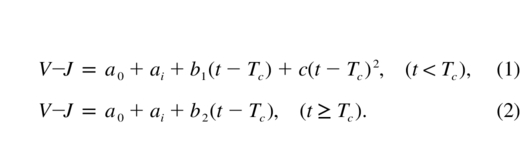
Each supernova has its own ai value, but the objects that are presumed to be unreddened and are used to establish the unreddened locus will have 〈ai〉 = 0. Reddened objects have ai>0. Under the assumption that the color curves of a group of unreddened supernovae are validly parameterized by a uniform locus, and that the reddened objects exhibit the same locus simply shifted to the red, the goal is to use all the data for a given color index to solve for the crossover time, the zero point, the slopes, the second‐order coefficient, and the color excesses of each reddened object.
In Figure 10, we show the unreddened V−J color locus for slowly declining Type Ia SNe. Using the B−V color excesses given by Schlegel et al. (1998) and E(V−J) = 2.223E(B−V) from a standard model of Galactic dust (Rieke & Lebofsky 1985), we have subtracted V−J color excesses of 0.089, 0.072, and 0.124 mag, respectively, from the observed V−J colors of SNe 1999aa, 1999aw, and 1999gp. We assume that these three objects were unreddened in their host galaxies. For SN 1999ee, we derive E(V−J) = 0.658 ± 0.022. This has been subtracted from the SN 1999ee data shown in Figure 10. The V−near‐IR color loci given by Krisciunas et al. (2000) were not extrapolated beyond t = 27 days, and we have truncated our V−J locus at that epoch, although on the basis of SN 1999aw we might have extended the right‐hand line farther.
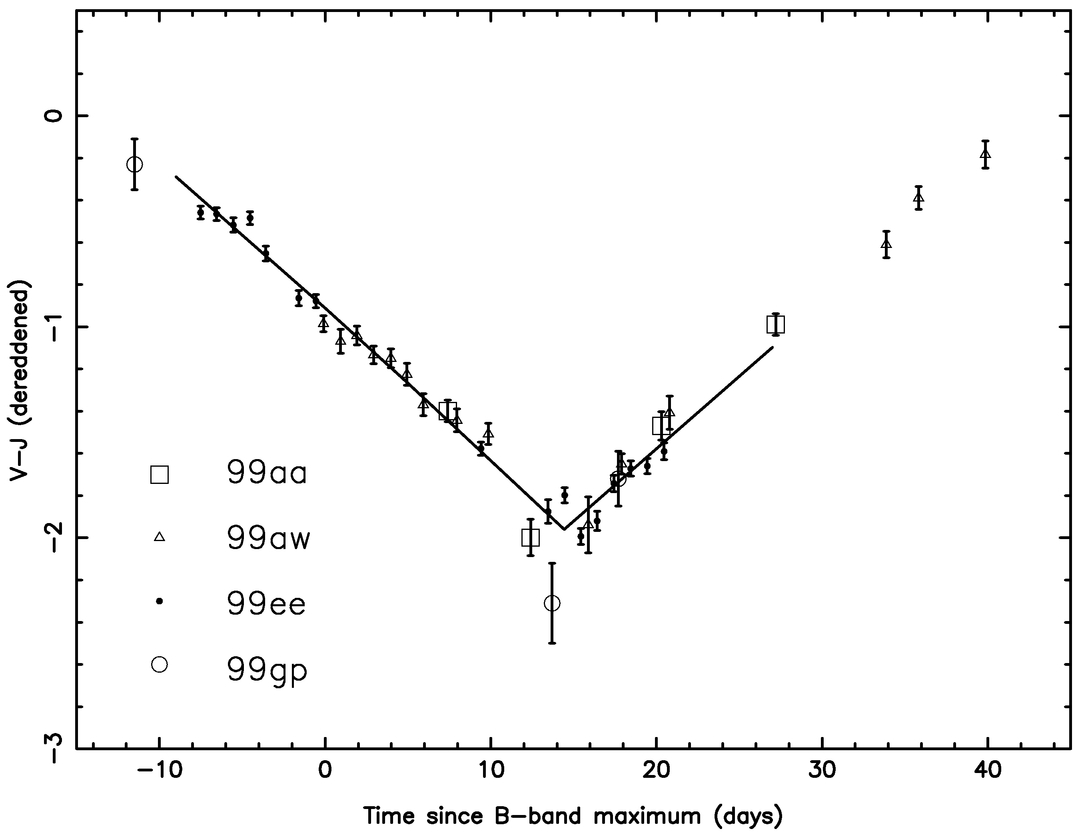
Fig. 10.— Dereddened V−J colors of slowly declining Type Ia SNe. SNe 1999aa, 1999aw, and 1999gp were assumed to be unreddened in their host galaxies. For these three objects, only the reddening due to dust in our Galaxy has been subtracted (Schlegel et al. 1998). SN 1999ee has nonzero host reddening, which, along with its Galactic reddening, has been subtracted for the purposes of this graph.
The V−J photometry of slowly declining Type Ia SNe gives a crossover time Tc = 14.43 ± 0.33 days. We find a0 =−1.96, b1 = -0.07480 ± 0.00747 mag day−1, c =−0.00015 ± 0.00030 mag day−2, and b2 = 0.06867 ± 0.00500 mag day−1. Whereas the c term was necessary for the midrange decliners studied by Krisciunas et al. (2000), we found that it was not statistically significantly different than zero for the slow decliners. We list it here only for reasons of completeness.
Given the optical color excess E(B−V) = 0.082 for SN 2000cx and the interstellar extinction law quantified by Rieke & Lebofsky (1985), we estimate the following color excesses: E(V−J) = 0.182, E(V−H) = 0.210, and E(V−K) = 0.226.
In Figure 11, we show the dereddened V−J colors of SN 2000cx, along with the unreddened color locus described above (solid line). We also show for reference (dashed line) the unreddened color locus for midrange decliners given by Krisciunas et al. (2000). The big dip observed in the J‐band leads to a very blue V−J color for SN 2000cx at t = 10 days. However, the V−J colors match the unreddened locus for slow decliners overlapping the time of maximum light. We note that conversion of the J‐band data to the filter system of Persson et al. (1998) would make our data up to 0.07 mag fainter at maximum light, assuming that the IR spectral evolution of SN 2000cx was similar to SN 1999ee (see Krisciunas et al. 2003, Fig. 6). This would make the V−J data shown on the left‐hand side of Figure 11 up to 0.07 mag bluer.
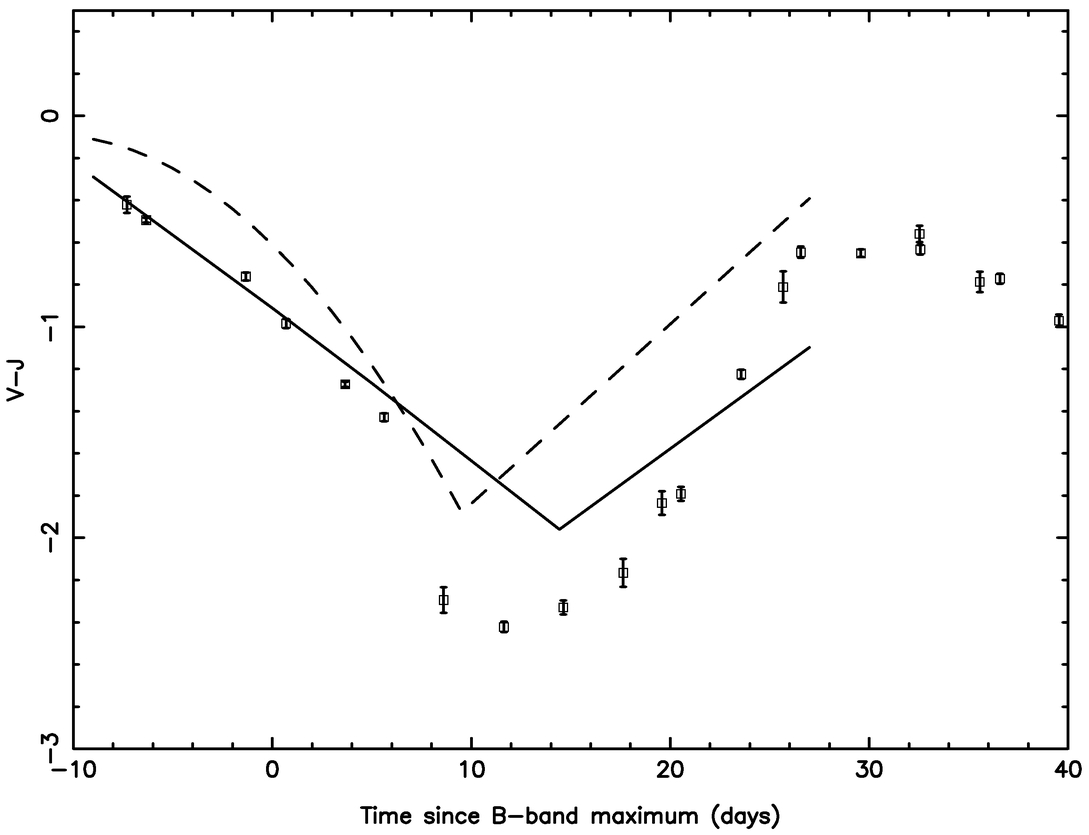
Fig. 11.— V−J colors of SN 2000cx, with E(V−J) = 0.182 subtracted to account for the effect of dust in our Galaxy. The dashed line is the unreddened locus given by Krisciunas et al. (2000) for Type Ia SNe with midrange B‐band decline rates. The solid line is the unreddened locus derived from photometry of four slow decliners (SNe 1999aa, 1999aw, 1999gp, and 1999ee) shown in Fig. 10.
A similar analysis of the V−H colors of SNe 1999aw, 1999gp, and 1999ee gives a crossover time Tc = 5.71 ± 0.27 days, a0 = -1.60, b1 = -0.06872 ± 0.00304 mag day−1, c≡0, and b2 = 0.07502 ± 0.00262 mag day−1. In this case, we have subtracted E(V−H) = 0.083 mag from the observed colors of SN 1999aw and 0.143 mag from the data of SN 1999gp, to account for the effect of dust in our Galaxy. We derived a total color excess of E(V−H) = 0.795 ± 0.023 for the reddening of SN 1999ee. The E(V−J) and E(V−H) color excesses of SN 1999ee are consistent with one unique value (rather than two disjoint values) of AV = 0.944 ± 0.061, which is a good consistency check relating to the assumption that there exist uniform color loci.
In Figure 12, we show a corresponding plot for dereddened V−H colors of SN 2000cx, with the unreddened loci for slow decliners (solid line) and midrange decliners (dashed line) shown. For V−H, there is good agreement between the SN 2000cx data and the unreddened locus for slow decliners from t = 10 to 27 days. Conversion of the H‐band data to the filter system of Persson et al. (1998) would change the data from 10<t<27 days by up to 0.06 mag, making them brighter and the V−H colors redder. Once again, this assumes that the IR spectral evolution of SN 2000cx was similar to that of SN 1999ee.
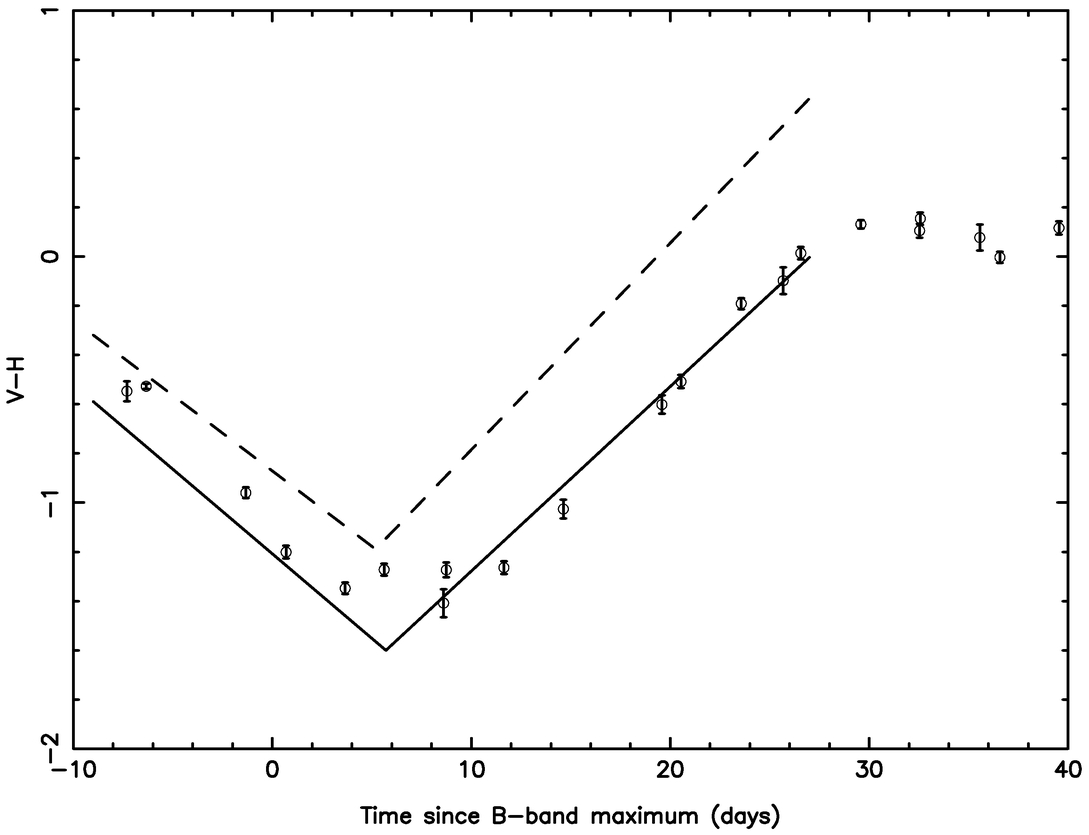
Fig. 12.— V−H colors of SN 2000cx. The solid line is based on data of the slowly declining SNe 1999aw, 1999gp, and 1999ee. The dashed line is based on Type Ia SNe with midrange B‐band decline rates (Krisciunas et al. 2000). To eliminate the effect of dust in our Galaxy on the colors, E(V−H) = 0.210 mag has been subtracted from the SN 2000cx data.
In Figure 13, we show the V−K data of SN 2000cx, corrected only for the reddening due to our Galaxy, along with dereddened data of SNe 1999aa, 1999ee, 1999gp, and 2001ba. The V−K colors of SN 2000cx are quite similar to these other slow decliners, both pre‐ and postmaximum. From 10<t<21 days, SN 2000cx is the bluest object in this color index.
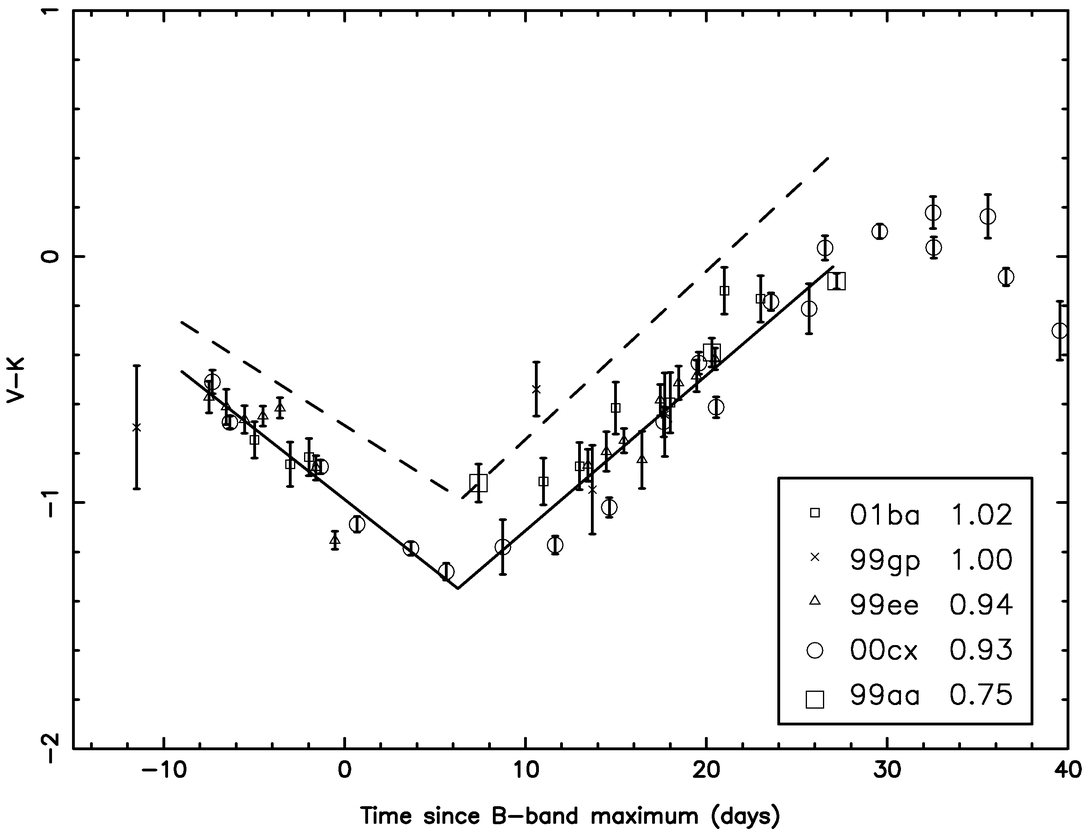
Fig. 13.— V−K colors of SN 2000cx and four other slowly declining Type Ia SNe. The values of Δm15(B) are given in the box. The data of SNe 2000cx, 1999gp, and 1999aa have been corrected only for Galactic reddening (Schlegel et al. 1998). Data of SNe 1999ee and 2001ba have been corrected for host reddening and Galactic reddening. The dashed line is based on dereddened Type Ia SNe with midrange B‐band decline rates (Krisciunas et al. 2000). Clearly, the dereddened V−K colors of the objects shown here are bluer than the locus based on midrange decliners. From 10<t<21 days, the SN 2000cx data are the bluest.
4. THE BOLOMETRIC BEHAVIOR OF SN 2000cx
The wide wavelength coverage of the UBVRIJHK broadband magnitudes allows us to construct ultraviolet/optical/near‐IR “uvoir” bolometric light curves. Only a few papers have been published trying to estimate the bolometric light curves of Type Ia supernovae. (See Leibundgut & Suntzeff 2003 for a summary.) The calculated luminosities are not the true bolometric luminosities, but represent the fraction of the gamma rays produced in the radioactive decays of the synthesized nuclides that are thermalized in the expanding debris nebula. As shown by Leibundgut & Pinto (1992) and Leibundgut (2000), a significant fraction of the gamma rays leak out of the supernova debris ranging from 10% at the time of Bmax to over 50% 40 days after maximum.
Suntzeff (1996) used ultraviolet spectra, optical UBVRI, and near‐infrared JHK data to estimate accurate bolometric fluxes. Because of the limited infrared data at the time, only a few points on the bolometric light curves could be accurately calculated. Vacca & Leibundgut (1996) and Contardo, Leibundgut, & Vacca (2000) obtained more complete uvoir bolometric light curves by integrating optical broadband magnitudes. Applying Arnett’s law (Arnett 1982) to the peak bolometric luminosities, Vacca & Leibundgut (1996) and Contardo et al. (2000) found a range of more than a factor of 10 in the56Ni masses for a group of nearby Type Ia SNe. Cappellaro et al. (1997) used a V magnitude with a bolometric correction to study the gamma‐ray trapping in the late‐time light curves, which also showed a significant range in56Ni masses.
We have integrated the broadband magnitudes for SN 2000cx using a simple trapezoidal rule and a conversion of broadband to monochromatic fluxes from Suntzeff & Bouchet (1990). We have added extrapolations to the ultraviolet from the U filter and to the mid‐infrared from the K or H filter using an extrapolation scheme discussed by Suntzeff (2003). These extrapolations add only ∼2% for the missing infrared flux and less than 10% for the ultraviolet after maximum light. In Figure 14, we plot the uvoir bolometric luminosity for SN 2000cx. For comparison, we also plot similar data for SN 2001el and SN 1999ee taken from Suntzeff (2003). (Note that the data have been offset slightly for plotting purposes.) The SN 1999ee and SN 2001el data were taken from Stritzinger et al. (2002) and Krisciunas et al. (2003) and are meant to represent “normal” Type Ia supernovae with Δm15(B) of 0.94 and 1.13, which are similar to the Δm15 value of SN 2000cx. We have assumed the following distance moduli and B−V reddening, which are based on a distance scale of H0 = 74 km s−1 Mpc−1: SN 2000cx, (32.47, 0.082); SN 1999ee, (33.21, 0.30); SN 2001el, (31.26, 0.21).5 The bolometric light curves have been plotted relative to the time of peak bolometric luminosity (not Bmax), which we estimated from the curves.
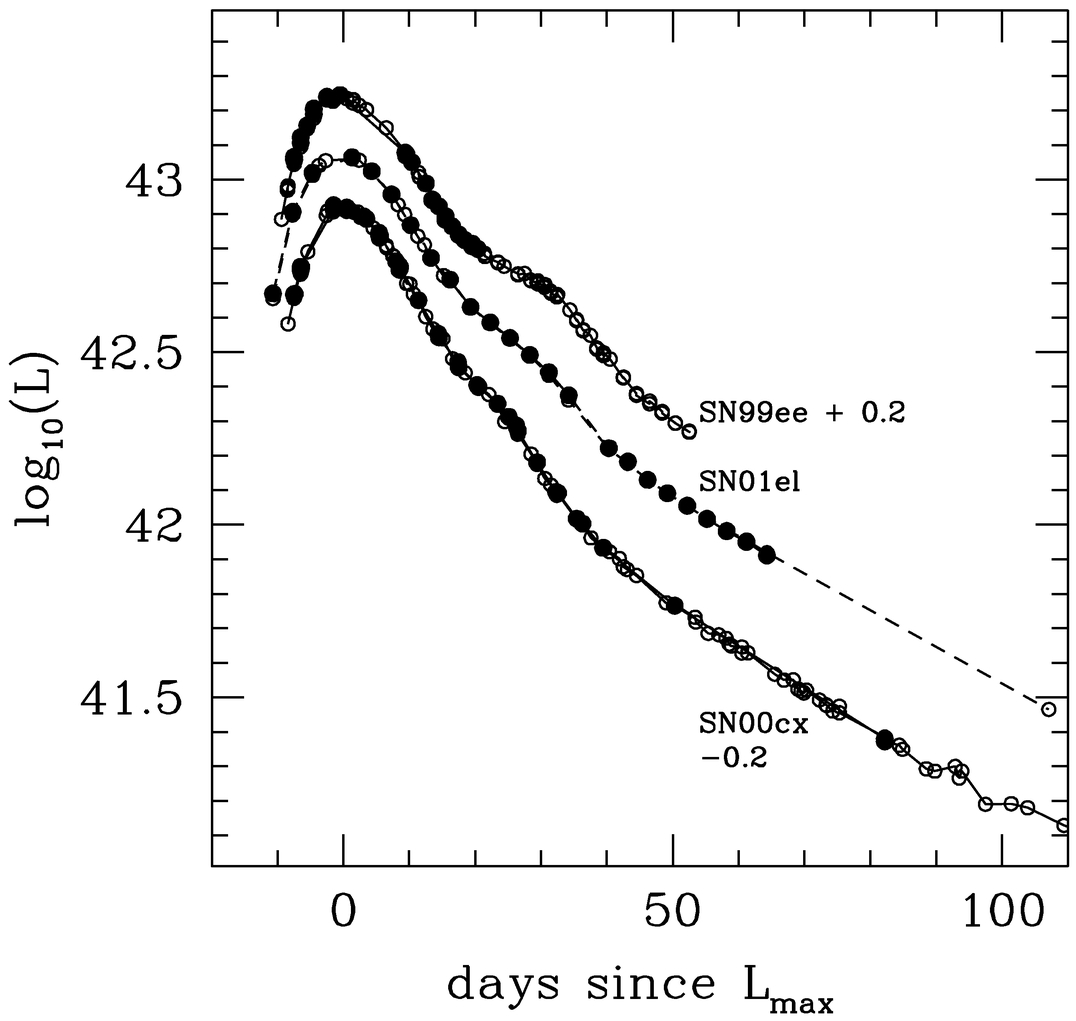
Fig. 14.— “uvoir” bolometric light curves for SNe 1999ee, 2001el, and 2000cx plotted against the time from maximum bolometric luminosity. The light curves for SN 1999ee and SN 2000cx have been shifted by +0.2 dex (1999ee) and −0.2 dex (2000cx) for clarity. We have assumed a distance modulus of 32.47 for SN 2000cx. The filled circles are the UBVRIJHK integrations, and the open circles are the UBVRI integration. Both integrations include extrapolations to account for the missing flux outside of the integration limits. SN 1999ee and SN 2001el are normal Type Ia SNe with Δm15(B) values of 0.94 and 1.13. Note the greatly reduced luminosity in the inflection point around day 30.
The only remarkable difference between SN 2000cx and the normal Type Ia SNe as seen in Figure 14 is the lack of the flux excess around day 30. This flux excess, which is associated with the secondary maxima in IJHK and a “shoulder” in R, was noted by Suntzeff (1996) and Contardo et al. (2000). Since the energy source for the bolometric luminosity and the optical depth to gamma rays are monotonically declining at that date, such an inflection in the bolometric luminosity must be associated with cooling mechanism and not the energy input to the nebula.
In Figure 15, we can see the differences in the bolometric light curves more clearly. Here we plot smoothed representations of the bolometric light curves, and at the bottom of the panel, the bolometric light curve of SN 2000cx with respect to SN 1999ee and SN 2001el. It can be seen that SN 2000cx rises to maximum more quickly and falls more quickly (within 10 days of maximum), but the effect is rather small. However, starting around day 25, SN 2000cx suddenly declines rapidly compared to these two SNe, reaches a maximum flux deficit around day 35, and then increases in brightness slightly to day 50. Figure 15 gives the impression that the postmaximum flux enhancement of SN 2000cx was weaker and earlier than the comparison Type Ia events.
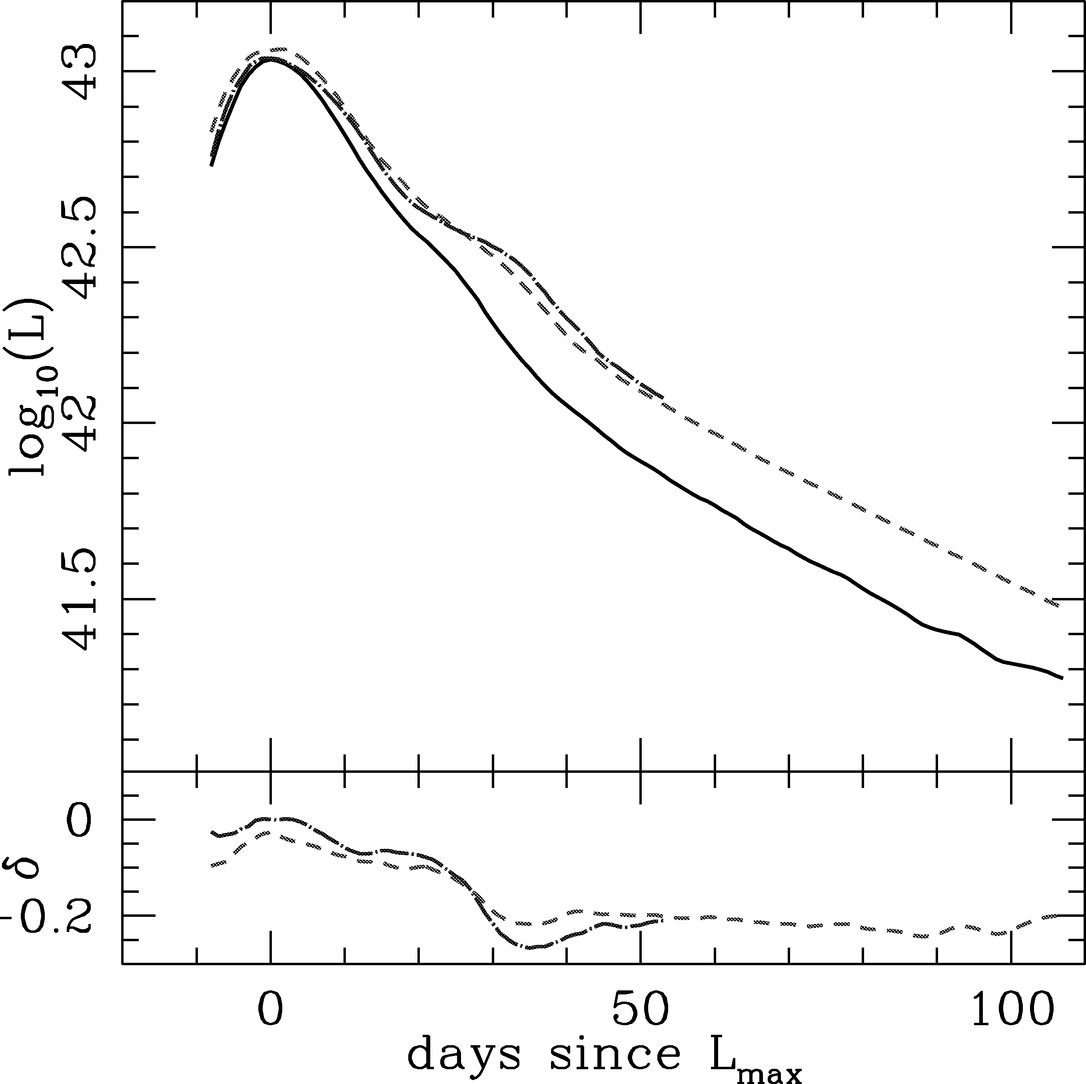
Fig. 15.— Smoothed‐curve representations of the uvoir bolometric luminosity for SN 2000cx (solid curve), SN 1999ee (dot‐dashed curve), and SN 2001el (dashed curve). Note that the curves have not been shifted as they were in Fig. 14. The bottom panel shows the difference between the SN 2000cx bolometric light curve and the light curves for SN 1999ee (dot‐dashed curve) and SN 2001el (dashed curve). This plot shows that there are two major differences between SN 2000cx and these other “normal” Type Ia SNe: the lack of bolometric flux around the time of the secondary I maximum at 30 days and the low bolometric flux on the exponential tail after day 50 compared to the peak luminosity.
Two explanations for the secondary maximum have been published. One explanation for the secondary IJHK maxima has been given by Pinto & Eastman (2000a, 2000b), who note that this flux enhancement is due to a rapid change in the flux mean opacity. After maximum light, the thermalized energy input to the light curve from the radioactive nuclides is less than the observed luminosity, implying qualitatively that the postmaximum luminosity is powered by a reservoir of previously trapped radiation. If the postmaximum opacity decreases as a result of a drop in the effective temperature, the diffusion times drop and the trapped energy escapes more rapidly, leading to a pause in the rapid luminosity decline. This bolometric flux excess appears in the redder colors because the opacities are very low and there are ample emission sources such as Fe ii and Ca ii.
A similar explanation has been given by Höflich (1995) and Höflich, Khokhlov, & Wheeler (1995). They note that the infrared luminosity can be roughly approximated by the Rayleigh‐Jeans limit, namely,

Here Rph, Teff, and DIR are the photospheric radius, the effective temperature, and a dilution factor appropriate for a scattering dominated atmosphere. They argue that DIR is a slowly varying function during this epoch. They show that after maximum, Teff drops as the energy source switches from56Ni to56Co, which starts the steep postmaximum decline. In many of their models, however, the photospheric radius Rph increases as it is dragged out by the expansion of the debris. Depending on the rate of expansion of the photosphere, this can cause the product in the equation for LIR−color to increase. The appearance of an expanding photosphere can be maintained only if the opacities stay high. In these conditions, as the photosphere is pulled outward with the debris, the luminosity will increase if Teff does not drop dramatically. This high rate of cooling, which greatly exceeds the energy input from the radioactive nuclides, cannot be maintained indefinitely, and at some point the opacities will begin to drop so rapidly that apparent photospheric radius will also being to recede quickly causing a sudden decrease in luminosity.
According to the models discussed above, this would support the hypothesis that SN 2000cx is a subluminous event. The subluminous SNe 1992A, 1992bo, and 1991bg (Contardo et al. 2000; see their Fig. 5) also have weak or no secondary flux enhancements, and SN 2000cx clearly belongs to this class.
Unfortunately, given the large number of unknown parameters in the models for the explosions of Type Ia SNe, this is not a strong conclusion. Pinto & Eastman (2000b) note that the secondary maximum is a sensitive function of how many of the radioactive nuclides are mixed in the expanding debris from the core. An unusual mixing event bringing relatively more56Ni out from the core qualitatively could account for the lack of the secondary flux enhancement independent of the intrinsic luminosity.
Returning to the empirical bolometric light curve, we find two other aspects of the morphology of the bolometric light curve that point to this event being subluminous. Contardo et al. (2000) showed that the decline rate between days 50 and 80 for their sample of Type Ia supernovae was 2.6 ± 0.1 mag per 100 days, except for the most subluminous event in their sample, SN 1991bg, which had a decline rate of 3.0 mag per 100 days. SN 2000cx declined at 2.9 mag per 100 days during this time period. If one looks at their Fig. 5, one can also see that SN 1991bg also stands out in the peak‐to‐tail luminosity difference. In Figure 16, we plot the difference in luminosity between the peak luminosity and 90 days after peak for the sample studied by Contardo et al. (2000). Evidently, this luminosity difference is correlated with Δm15(B), with the fainter SNe having larger luminosity differences. The observed value of this luminosity difference in SN 2000cx of 1.63 associates it with the subluminous group. This is also seen in Figure 15, where this SN is compared to SNe 2001el and 1999ee. In that figure, the luminosity on the exponential tail for days beyond 50 are underluminous by about 0.2 dex with respect to SN 2001el, which has a value of Δm15(B) of 1.13.
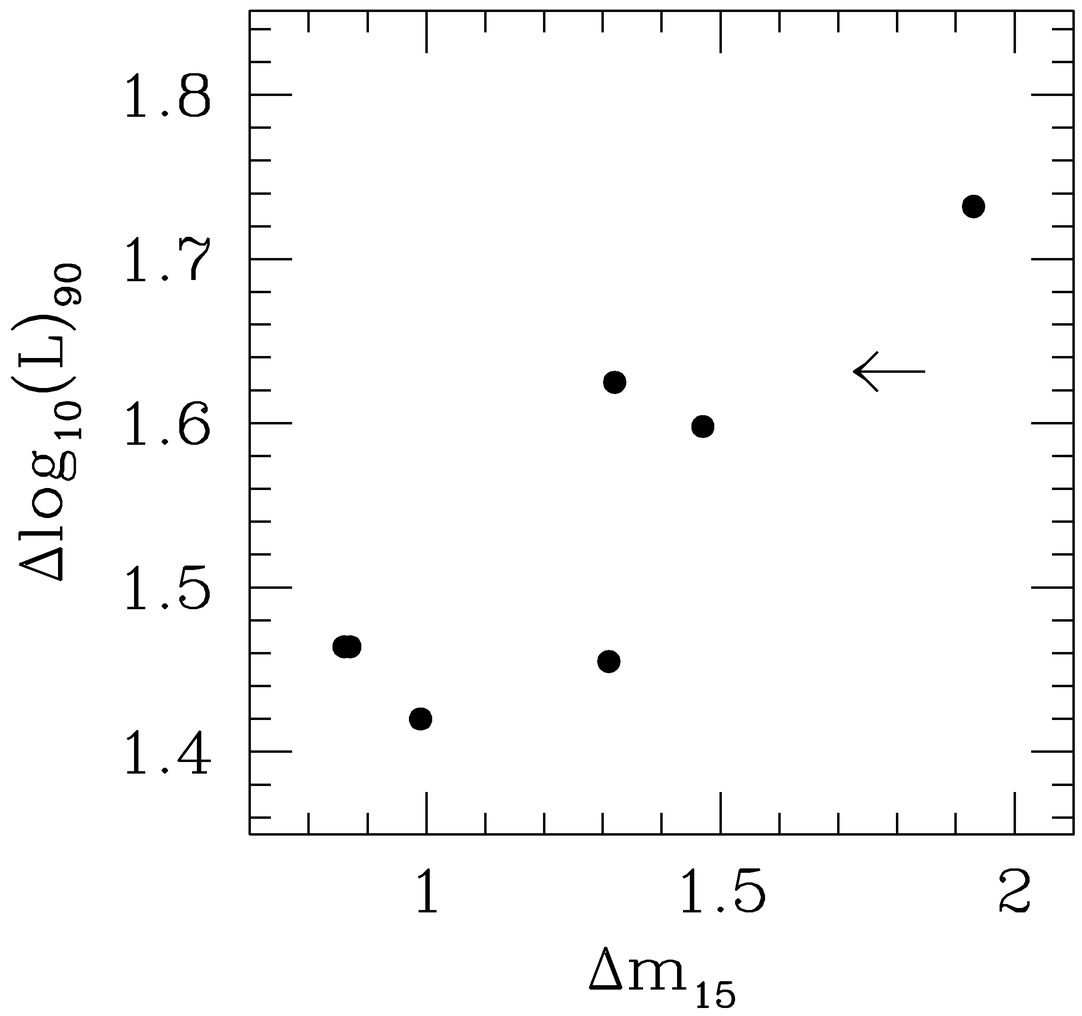
Fig. 16.— Difference in the peak bolometric luminosity compared to the luminosity 90 days after maximum light (in units of dex) for the sample of supernovae in Fig. 5 of Contardo et al. (2000) as a function of Δm15(B). We mark the luminosity difference observed for SN 2000cx with an arrow. Evidently, intrinsically fainter supernovae (those with larger Δm15) have larger peak‐to‐tail luminosities. The position of SN 2000cx would associate it with the subluminous class of SNe.
By day 50 or so, the energy deposition in a typical Type Ia supernova due to the thermalization of gamma rays occurs in regions that are optically thin in the optical and near‐infrared (Pinto & Eastman 2000a). Thus, the luminosity at this epoch responds rapidly to the input energy source, which at this time is56Co. At maximum light, according to Arnett’s law, the bolometric luminosity equals the instantaneous energy input from the radioactive nuclides. The ratio of these two luminosities should then be independent, to first order, of the mass of56Ni synthesized.
The larger luminosity difference between the peak and 90 days after peak is thus caused by a smaller optical depth to gamma rays at late times. This could be caused, for instance, by positron escape as discussed by Milne, The, & Leising (2001), but the modeling shows minimal effects of positron trapping at this epoch due to the short positron lifetimes that approximate in situ deposition of positron energy. A lower optical depth to gamma rays could also be caused by an asymmetric mass distribution of the ejecta. Perhaps the simplest way to lower the optical depth is to increase the kinetic energy due to the explosion.
It is not unreasonable that the initial kinetic energy may be only vaguely related to the mass of56Ni synthesized. Pinto & Eastman (2000a; see their Fig. 4) showed that a larger kinetic energy will lead to a more rapid decline in the mass column depth and produce a narrower bolometric light curve and increased the peak‐to‐tail luminosity difference. In a subsequent article, Pinto & Eastman (2001) note that the explosion kinetic energy is not necessarily a function of the56Ni mass, since the total energy of the burning of a C/O mixture is nearly the same if it burns to the Si group or to56Ni. The thermal energy liberated at the explosion does go entirely to the kinetic energy, but that kinetic energy may not be strongly coupled to the56Ni, which powers the subsequent light curve. Li et al. (2001) found that SN 2000cx did have very high sulfur and silicon velocities compared to SN 1994D, and they also concluded that SN 2000cx may have had a larger than typical kinetic energy.
Thus, if the SBF distance is correct, a working hypothesis to explain the bolometric behavior of SN 2000cx is that this supernova is an underluminous event with higher than normal kinetic energy. We should not be too forceful in stressing this conclusion, however. This event was clearly unusual in its color evolution, and simple morphological arguments may fail if model parameters, such as the extent of mixing of the radioactive nuclides or the symmetry of the explosion, are uncoupled from the other fundamental parameters such as the amount of56Ni synthesized. None of the evidence here clearly points to a shorter or longer distance to this supernova. Obviously, we need a better distance to NGC 524 to resolve this question.
5. CONCLUSIONS
SN 2000cx, the brightest supernova discovered in the year 2000, occurred in the unobscured outer regions of an early‐type galaxy and was well observed with multiple telescopes, allowing us to compile a data set of unprecedented size. While many Type Ia SNe have light curves that follow patterns that are now well established, SN 2000cx did not conform to these patterns.
SN 2000cx was a reasonably fast riser in B and V. From the premaximum photometry, Li et al. (2001) obtain a stretch factor that corresponds to Δm15(B) = 1.64 ± 0.02. Based solely on its weak I‐band secondary hump, we would have predicted Δm15(B) ≈ 1.7. If the distance modulus based on surface brightness fluctuations of the host galaxy is correct (Tonry et al. 2001), the corresponding absolute magnitudes in BVIH are comparable to fast decliners, with Δm15(B) in the range 1.4–1.7.
However, SN 2000cx was a slow decliner, with Δm15(B) = 0.93. Its premaximum spectrum showed strong Fe iii and weak Si ii, like other slow decliners such as SN 1991T. Its V−K color evolution, both pre‐ and postmaximum, was very similar to that of other slow decliners.
The bolometric behavior of SN 2000cx, when compared to the normal SNe 1999ee and 2001el, showed that this SN rose and fell from maximum light more rapidly and that the magnitude difference between peak brightness and 90 days past peak was larger than normal. This behavior is consistent with the higher kinetic energies seen at maximum light and reported by Li et al. (2002), but it can also be explained by this event being subluminous.
The distance modulus of SN 2000cx is somewhat problematic. We note, however, that MLCS (Riess et al. 1996, 1998), Hubble Law’s (with H0 = 74 km s−1 Mpc−1), and the method that uses the H‐band absolute magnitude at t = 10 days (Krisciunas et al. 2003) give just about the same value. The SBF method gives a distance modulus roughly 0.6 mag smaller.
Given (1) the accuracy of the photometry of SN 2000cx at maximum (±0.03 mag), (2) the host extinction of SN 2000cx is minimal (or zero), (3) the uncertainty of the Galactic extinction correction is also small, and (4) the light curves cannot be fitted by templates based on other objects, confidently placing this SN in a Hubble diagram depends significantly on a direct measure of the host galaxy’s distance (such as with the SBF method) or on an absolute magnitude derived from an explosion model that can match the many unusual observed facts.
Support for proposals GO‐07505.02A, GO‐08177.6, and GO‐08641.07A was provided by NASA through a grant from the Space Telescope Science Institute, which is operated by the Association of Universities for Research in Astronomy, Inc., under NASA contract NAS 5‐26555. This paper is based, in part, on observations obtained with the Apache Point Observatory 3.5 m telescope, which is owned and operated by the Astrophysical Research Consortium.
We thank W. D. Li for sharing the KAIT data considerably ahead of publication. We thank M. R. Garcia, L. Clark, D. Hoard, J. Alfonso, and K. Vivas for obtaining some of the data at CTIO. C. Stubbs, G. Miknaitis, and E. Bergeron helped with data acquisition for some APO observations. D. Edgeworth helped with some of the MRO observations. The APO infrared data were reduced using software written in part by A. Diercks and E. Magnier.
APPENDIX: THE R‐BAND FILTER USED AT YALO
In Figure 17, we show the filter transmission function of the R‐band filter used with the YALO 1 m telescope for the observations presented here. This is a much more standard filter than that used by Stritzinger et al. (2002) for their observations of SN 1999ee using the same telescope and camera. Also shown in the diagram is the effective throughput in R, made up of the filter transmission function multiplied by an atmospheric transmission function, the quantum efficiency of the chip, and two aluminum reflections. Both functions shown in Figure 17 include a 280 Å shift to the blue, which comprises the 310 Å shift suggested by the manufacturer, taking into account the use of the filter when cooled, and a 30 Å shift back to red. This smaller shift was necessary to match the color term obtained for R‐band photometry based on synthetic photometry with the actual color term derived from the observations of Landolt (1992) standards.
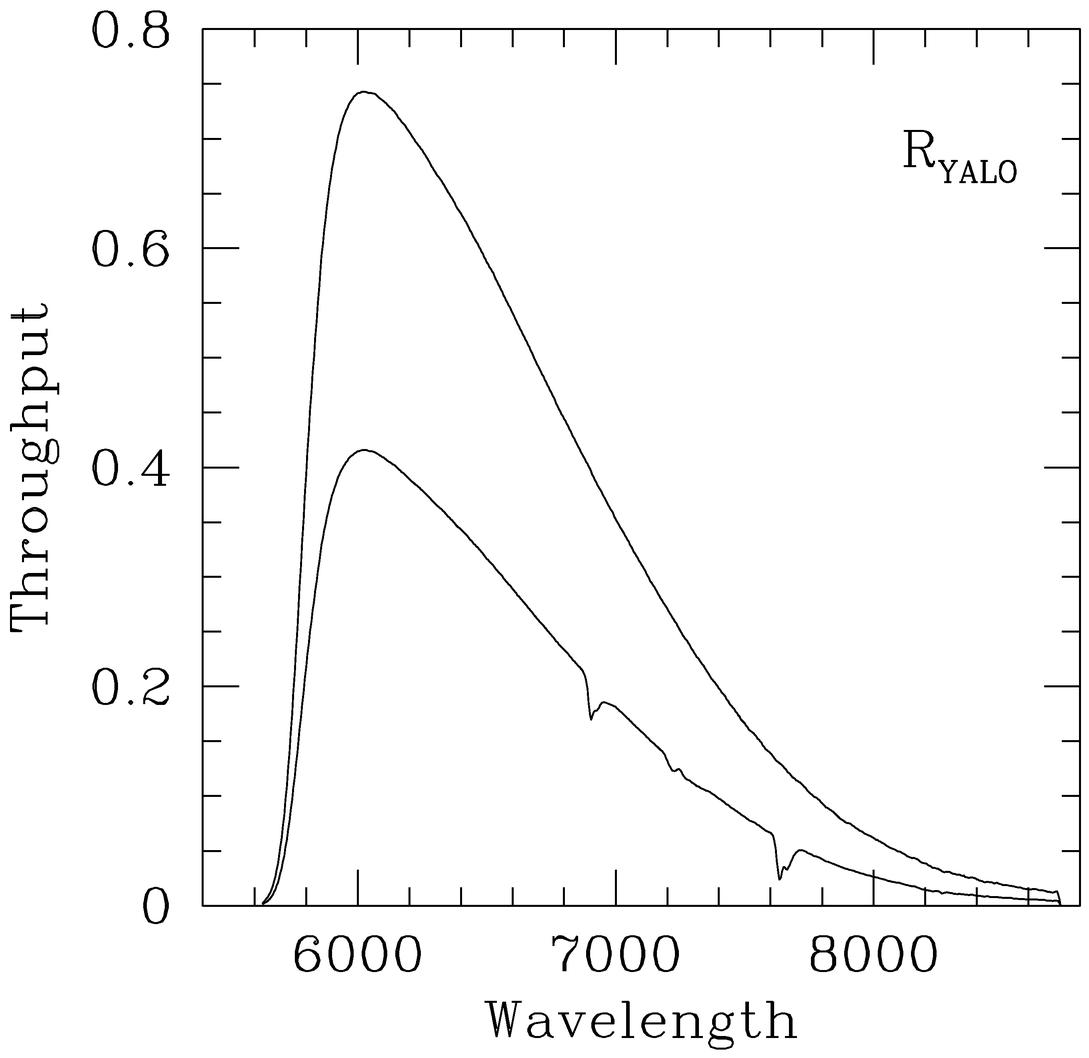
Fig. 17.— Upper curve: Transmission function of the R filter used for the YALO observations reported here. Lower curve: Filter transmission function multiplied by an atmospheric transmission function, quantum efficiency vs. wavelength, and two aluminum reflections, giving the effective transmission with the system for R. Both curves have been shifted 280 Å to shorter wavelengths to account for the cooling of the filter in the dewar and so that the color term obtained from synthetic photometry matches that determined from observations of Landolt (1992) standards.
Footnotes
- 2
IRAF is distributed by the National Optical Astronomy Observatory, which is operated by the Association of Universities for Research in Astronomy, Inc., under cooperative agreement with the National Science Foundation.
- 3
- 4
Stritzinger et al. (2002) attempted to correct data of SN 1999ee obtained with multiple telescopes by calculating “S‐corrections” using the spectra of this object plus knowledge of the filter transmission curves, quantum efficiencies of the chips, and appropriate atmospheric transmission functions. In the end, they decided to leave their data uncorrected. More recently, however, Krisciunas et al. (2003) derived corrections to their photometry of SN 2001el and applied the filter corrections to the BVJHK data. This in particular solved problems with the B‐, V‐, J‐, and H‐band data. However, they found that R‐band corrections were not really necessary and that applying I‐band corrections actually made data sets obtained with different telescopes much more discordant.
- 5