Abstract
We present new 0.3–21 μm photometry of SN 2021aefx in the spiral galaxy NGC 1566 at +357 days after B-band maximum, including the first detection of any Type Ia supernova (SN Ia) at >15 μm. These observations follow earlier JWST observations of SN 2021aefx at +255 days after the time of maximum brightness, allowing us to probe the temporal evolution of the emission properties. We measure the fraction of flux emerging at different wavelengths and its temporal evolution. Additionally, the integrated 0.3–14 μm decay rate of Δm0.3–14 = 1.35 ± 0.05 mag/100 days is higher than the decline rate from the radioactive decay of 56Co of ∼1.2 mag/100 days. The most plausible explanation for this discrepancy is that flux is shifting to >14 μm, and future JWST observations of SNe Ia will be able to directly test this hypothesis. However, models predicting nonradiative energy loss cannot be excluded with the present data.
Original content from this work may be used under the terms of the Creative Commons Attribution 4.0 licence. Any further distribution of this work must maintain attribution to the author(s) and the title of the work, journal citation and DOI.
1. Introduction
Type Ia supernovae (SNe Ia) are the thermonuclear explosions of carbon–oxygen white dwarf stars (Hoyle & Fowler 1960). Their importance is twofold: their use as standard candles is essential to the field of cosmology (e.g., Schmidt et al. 1998), and they produce the majority of iron-group elements in the universe (e.g., Iwamoto et al. 1999). Despite their overarching importance, many open questions remain regarding their progenitor systems and explosion mechanisms (see Maoz et al. 2014; Jha et al. 2019 for recent reviews).
SNe Ia are powered by the radioactive decay of unstable isotopes synthesized during the explosion (Pankey 1962). The decay of

dominates the energy deposition into the ejecta for the first ∼3 yr after explosion (e.g., Seitenzahl et al. 2009). Gamma rays emitted during the first half of this decay chain, 56Ni → 56Co, provide the majority of the heating at ≲200 days after explosion (e.g., Arnett 1982; Childress et al. 2015). The second decay, 56Co → 56Fe, produces X-ray and γ-ray photons in addition to high-energy (∼1 MeV) positrons (e+) that dominate the energy deposition ≈200–1200 days after explosion (e.g., Kushnir & Waxman 2020; Tucker et al. 2022b).
For many years it was unclear whether some of the 56Co →56Fe decay energy escaped from the ejecta into the surrounding environment. Early studies of late-time SN Ia light curves found that the nebular-phase (≳150 days after maximum light; e.g., Bowers et al. 1997; Branch et al. 2008) optical (0.3–1 μm) brightness declined faster than expected for the radioactive decay of 56Co, suggesting that a fraction (∼1%–10%) of the decay energy was not confined to the ejecta (e.g., Milne et al. 2001). This changed with the inclusion of JHK (1–2.5 μm) observations, which reconciled the (pseudo)bolometric decline rate with expectations for pure 56Co decay (e.g., Stanishev et al. 2007; Stritzinger & Sollerman 2007; Leloudas et al. 2009).
A persistent uncertainty in these studies is the unknown fraction of flux emerging at ≳2.5 μm. Gerardy et al. (2007) published single-epoch nebular-phase Spitzer spectra of SNe Ia SN 2003hv and SN 2005df extending to 15 μm. Johansson et al. 2017 analyzed multiepoch Spitzer light curves of SNe Ia extending into the nebular phase but were limited to the CH1 (3.6 μm) and CH2 (4.5 μm) bandpasses. Kwok et al. (2022) and DerKacy et al. (2023) recently published spectra of SN 2021aefx extending to 14 μm with JWST at +255 and +323 days after maximum light, respectively. SN 2014J has multiple mid-IR spectra (Telesco et al. 2015), with the caveat that the spectra were obtained from the ground with the Gran Telescopio Canarias, where the high sky brightness and low atmospheric transmission in the mid-IR complicate precise flux calibration. To date, no SN Ia has been detected at >15 μm. Three SNe Ia (SN 2011by, SN 2011fe, and SN 2012cg) were observed within 45 days of maximum light with Herschel at 70 and 160 μm, but only upper limits were obtained (Johansson et al. 2013).
In this Letter, we report new optical and IR broadband imaging of SN 2021aefx at +357 days after B-band maximum light. The new JWST data were obtained as part of the Physics at High Angular Resolution of Nearby GalaxieS (PHANGS)–JWST Cycle 1 Treasury Program (Lee et al. 2022), which observed the host of SN 2021aefx, NGC 1566, in eight filters spanning 2–21 μm (F200W to F2100W). While the core science goals of PHANGS-JWST center on understanding stellar formation and feedback in nearby, star-forming galaxies, the serendipitous 2–21 μm observations of SN 2021aefx provide new insight into the cooling properties of SN Ia ejecta at nebular phases, including the first detection of an SN Ia at >15 μm.
SN 2021aefx was discovered on 2021 November 11 (MJD 59,529; Bostroem et al. 2021; Valenti et al. 2021) by the Distance Less Than 40 Mpc (DLT40) transient survey (Tartaglia et al. 2018). Its host galaxy, NGC 1566, is a massive (![${\mathrm{log}}_{10}{M}_{\star }\left[{M}_{\odot }\right]\approx 10.8$](https://content.cld.iop.org/journals/2041-8205/944/2/L28/revision1/apjlacb6d8ieqn1.gif) ), relatively face-on star-forming (star formation rate ≈4.5 M⊙ yr−1) spiral galaxy (Leroy et al. 2021) at a distance d = 17.69 ± 2.02 Mpc (distance modulus μ = 31.24 ± 0.27 mag; Kourkchi & Tully 2018; Anand et al. 2021) and redshift z = 0.00502 ± 0.00001 (Allison et al. 2014). Despite excess u-band emission in the early light curve (Ashall et al. 2022), SN 2021aefx evolved into a normal SN Ia with Δm15(B) = 0.90 ± 0.02 mag and reached MB
= −19.63 ± 0.02 mag on
), relatively face-on star-forming (star formation rate ≈4.5 M⊙ yr−1) spiral galaxy (Leroy et al. 2021) at a distance d = 17.69 ± 2.02 Mpc (distance modulus μ = 31.24 ± 0.27 mag; Kourkchi & Tully 2018; Anand et al. 2021) and redshift z = 0.00502 ± 0.00001 (Allison et al. 2014). Despite excess u-band emission in the early light curve (Ashall et al. 2022), SN 2021aefx evolved into a normal SN Ia with Δm15(B) = 0.90 ± 0.02 mag and reached MB
= −19.63 ± 0.02 mag on  = MJD 59,546.5 (Hosseinzadeh et al. 2022).
The brightness and close proximity of SN 2021aefx make it an excellent target for nebular-phase JWST observations. Kwok et al. (2022) and DerKacy et al. (2023) provided the first demonstration of the impressive spectroscopic capabilities of JWST for studying nebular-phase SNe Ia. Their spectra of SN 2021aefx, obtained +255 and +323 days after  , respectively, represent the highest-quality look at the emission properties >2.5 μm of SNe Ia to date. Their spectra show prominent emission features from the iron-group elements (Ni, Co, Fe), as well as a wide, flat-topped [Ar iii] profile that indicates a spherical shell of emission.
Our new 2–21 μm JWST photometry at +357 days is used in conjunction with the +255-day 0.3–14 μm spectrum from Kwok et al. (2022) to (1) provide the time-dependent fraction of flux emerging at optical, near-IR, and mid-IR wavelengths and (2) determine whether the decline rate of the 0.3–14 μm flux is consistent with expectations for the radioactive decay of 56Co → 56Fe. The imaging data and reduction are described in Section 2. Section 3 outlines our analysis procedure, including constructing the 2–21 μm spectral energy distribution (SED; Figure 2) and calculating filter-specific and bolometric decay rates (Figure 3 and Table 2). Finally, in Section 4 we discuss and summarize our results.
2. Observations
2.1. Near- and Mid-IR Photometry
JWST (Rigby et al. 2022) observed NGC 1566 on 2022 November 22 (MJD 59,905.4) using both the near-infrared camera instrument (NIRCam; Rieke et al. 2022) and mid-infrared instrument (MIRI; Rieke et al. 2015; Wright et al. 2015) as part of the PHANGS-JWST Treasury survey (GO program 2107, PI: J. Lee; Lee et al. 2022). The observations include NIRCam imaging using the F200W, F300M, F335M, and F360M filters and MIRI imaging using the F770W, F1000W, F1130W, and F2100W filters. Lee et al. (2022) describe the general procedures for PHANGS-JWST observations and reduction. Here we use a preliminary version of the images reduced with the Calibration References Data System 29 (CRDS) versions 11.16.15 (NIRCam) and 11.16.16 (MIRI).
Figure 1 shows the location of SN 2021aefx in NGC 1566 and presents cutouts around this location in each filter. The figure shows that in all eight filters SN 2021aefx appears as a bright point source near the J2000 location of α = 649725 and δ = −54
948081 reported by Valenti et al. (2021). Despite the significant variation of the point-spread function (PSF) size from 2 to 21 μm, there is no issue identifying the location of the source in each band, and the SN always appears brighter than the surrounding emission.
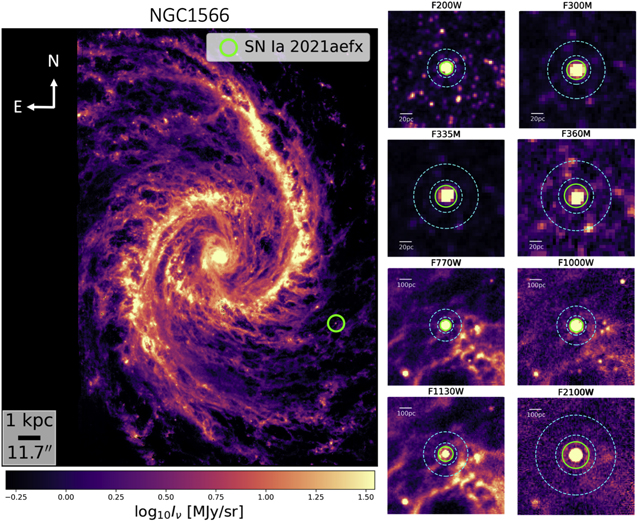
Figure 1. SN 2021aefx in NGC 1566 at ≈2–21 μm. Left panel: MIRI F1130W PHANGS-JWST image of NGC 1566 showing the location of SN 2021aefx, marked with a green circle. Right panels: zoom-ins on SN 2021aefx in each PHANGS-JWST filter. The top four panels show 200 pc × 200 pc cutouts from NIRCam images at 2.0–3.6 μm. The bottom four panels show 1 kpc × 1 kpc MIRI images at 7.7–21 μm. The inner green circle marks the aperture used in the photometry measurement, and the two concentric dashed cyan circles mark the inner and outer apertures used for the background subtraction. The results of the photometry appear in Table 1.
Download figure:
Standard image High-resolution imageWe measure the flux of SN 2021aefx using aperture photometry and report our results in Table 1. To do this, we use the aperture photometry module of the astropy-affiliated package photutils. 30 Because we use initial versions of the PHANGS-JWST images in which the astrometry remains moderately uncertain, we center the circular aperture on the brightest pixel associated with the SN, which is slightly offset from filter to filter. We have no reason to think that the position of the SN varies by band and ascribe all of the slight variations in position to astrometric uncertainty.
Table 1. Filter-specific Photometry Data: Exposure Time, t; Nominal Wavelength at the Filter Center, λ; Nominal Wavelength Width of the Filter, Δλ; Flux Density, Flux; Statistical Uncertainty, σStat; Systematic Uncertainty, σSys; Luminosity Times the Frequency, ν Lν ; and Luminosity Times the Nominal Frequency Width of the Filter, Δν Lν
| Filter | t | λ | Δλ | Flux | σStat | σSys | ν Lν | Δν Lν |
|---|---|---|---|---|---|---|---|---|
| (s) | (μm) | (μm) | (μJy) | (μJy) | (μJy) | (105 L⊙) | (105 L⊙) | |
| F200W | 1203 | 1.99 | 0.461 | 20.12 | 1.55 | 0.85 | 3.012 | 0.707 |
| F300M | 387 | 2.996 | 0.318 | 14.2 | 0.15 | 1.45 | 1.412 | 0.15 |
| F335M | 387 | 3.365 | 0.347 | 19.28 | 0.21 | 1.67 | 1.707 | 0.176 |
| F360M | 430 | 3.621 | 0.372 | 4.77 | 0.2 | 0.2 | 0.392 | 0.04 |
| F770W | 88 | 7.7 | 2.2 | 268.52 | 1.39 | 26.34 | 10.388 | 3.03 |
| F1000W | 122 | 10.0 | 2.0 | 173.33 | 1.41 | 25.38 | 5.163 | 1.043 |
| F1130W | 311 | 11.3 | 0.7 | 181.41 | 2.3 | 11.24 | 4.782 | 0.297 |
| F2100W | 321 | 21.0 | 5.0 | 440.26 | 7.36 | 22.51 | 6.245 | 1.508 |
Download table as: ASCIITypeset image
We assign aperture radii of 2 times the FWHM of the PSF for each filter. We also estimate and subtract a local background using an annulus spanning from 1.5 to 3 times the radius of this photometric aperture (Figure 1). Finally, we apply an aperture correction to each filter based on the fraction of total energy encircled within the PSF (found using WebbPSF; 31 Perrin et al. 2015) of our adopted aperture.
We check our photometry by also estimating the flux using two independent methods. The first follows Hoyer et al. (2022) and fits the source with two Sérsic profiles, one for the core and another for the halo of the source, without PSF convolution. The two profiles are integrated to find the total flux of the source, and a flat offset is added to account for the background. The second check uses the DOLPHOT stellar photometry package (Dolphin 2000, 2016), which estimates the flux of sources using PSF fitting applied to individual calibrated image frames (“level 2”) prior to drizzling the images into the final mosaics used for our primary analysis (“level 3”). Our DOLPHOT analysis uses the beta versions of the NIRCam 32 (D. Weisz et al. 2022, in preparation) and MIRI 33 (J. Peltonen et al. 2022, in preparation) modules. These measurements differ by an average of 6% from our nominal flux density measurement.
We also estimate statistical and systematic uncertainties associated with the photometry.
We use a relatively empty region of the image itself to assess the statistical uncertainty. To do this, we focus on the northwest corner of the image, which is free of bright emission (Figure 1). For each band, we generate 100 apertures with the same radius as the measurement aperture for that band and place them randomly in the empty region. We then measure the standard deviation among the flux measurements for these empty apertures and treat this as a realistic estimate of the statistical uncertainty. Because both the local background and the source measurement vary across these “empty” apertures, we expect this estimate to reflect both uncertainty in the background level and noise within the aperture.
We include two contributions to the systematic uncertainty of each measurement, an overall flux calibration uncertainty and a methodological uncertainty. For the first, we assume a 4% overall calibration uncertainty because JWST targets an overall flux calibration of 2% 34 and Rigby et al. (2022) quote a photometric reproducibility of 4% for NIRCam. To be conservative, we assume that this 4% value reflects the current calibration uncertainty of the telescope and that this also applies to MIRI imaging. The second, methodological term reflects that different methods that ideally should yield identical results vary owing to the influence of the background, imperfect knowledge of the PSF, or other methodological choices. To account for this, we take the median absolute deviation among the three flux measurements obtained with different methods for each filter and then express this as a corresponding rms uncertainty. Finally, we add both systematic uncertainties in quadrature and report them alongside the statistical uncertainty in Table 1.
Table 1 also reports ν Lν and Δν Lν , calculated by converting the flux density to a luminosity (Lν ) and then multiplying by the frequency at the nominal filter center, 35 , 36 ν, and the nominal frequency width of the filter, Δν, respectively. Δν Lν is a more useful physical measurement than ν Lν because it more nearly corresponds to a direct integral over the filter, 37 and the emission from the SN is expected to be localized line emission (e.g., Fransson & Jerkstrand 2015; Kwok et al. 2022).
2.2. Flux Calibration of the +255-day Spectrum
We compute synthetic photometry from the 0.3–14 μm +255-day spectrum of SN 2021aefx published by Kwok et al. (2022), so we briefly discuss the precision of the spectral flux calibration. JWST is currently obtaining Cycle 1 calibration observations, so the absolute flux calibration has not been finalized. However, there are several reasons why we consider the flux calibration of the +255-day spectrum to be sufficient. The optical portion of the +255-day spectrum has contemporaneous UBgVri photometry to ensure precise flux calibration (Kwok et al. 2022). Additionally, the MIRI Low-Resolution Spectroscopy (LRS) spectrum is scaled by only 2% to match the MIRI F1000W acquisition-image photometry (Kwok et al. 2022). Thus, the optical and mid-IR wavelengths have flux calibration accurate to ≲5%.
Only the NIRSpec observations lack corresponding photometry. While this could result in uncertain flux calibration for the ≈1–5 μm range, the NIRSpec spectrum shows excellent agreement with the flux-calibrated optical and mid-IR spectra on either end of the wavelength range. The current JWST flux calibration is accurate to 2%–5% (S. Kendrew, private communication), so we adopt a conservative uncertainty of 0.1 mag for photometry synthesized from the NIRSpec (1–5 μm) portion and 0.05 mag otherwise.
2.3. Optical Photometry
We supplement the JWST observations with optical BVgri imaging from the Precision Observations of Infant Supernova Explosions (POISE; Burns et al. 2021) project. These observations were conducted on MJD 59,904.7, ≈17 rest-frame hours before the JWST observations, with the SITe3 camera on the Swope telescope. Section 2 in Ashall et al. (2022) provides a brief overview of the data reduction and calibration process, with further discussions in Krisciunas et al. (2017). Finally, difference imaging with SkyMapper (Wolf et al. 2018) data is used to mitigate the host galaxy contribution, although the effect is minimal for SN 2021aefx, as it is located in the outskirts of NGC 1566.
3. Results
Figure 2 shows our new near- and mid-IR photometry of SN 2021aefx at +357 days after maximum light. Our new measurements appear as purple stars, with the filters illustrated below the SED and the nominal filter widths indicated by the horizontal error bars. Filter curves are taken from the Spanish Virtual Observatory’s filter profile service 38 (Rodrigo & Solano 2020). The solid line behind our data shows the spectrum of Kwok et al. (2022). For comparison, we also compute synthetic photometry from the +255-day 0.3–14 μm spectrum of SN 2021aefx (Kwok et al. 2022), which appears as black-and-white circles.
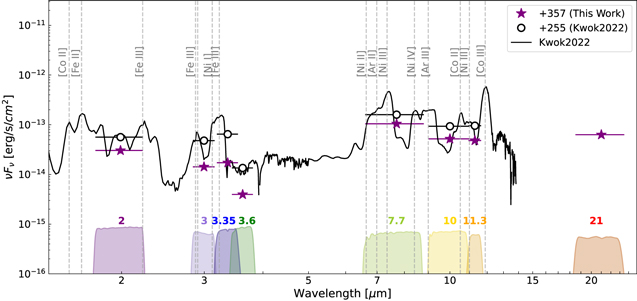
Figure 2. A comparison of the near- and mid-IR flux of SN 2021aefx at +255 and +357 days. Purple stars mark our flux measurements from each filter, and black open circles signify synthetic photometry from the +255-day spectrum (black line). Horizontal error bars show the nominal wavelength width of each filter. Vertical error bars mark the uncertainty in the measurement and are shown, but they are typically smaller than the points. The vertical gray dashed lines mark emission features identified by Kwok et al. (2022). NIRCam and MIRI filter curves are plotted along the bottom axis.
Download figure:
Standard image High-resolution imageComparing the synthesized photometry to the new JWST observations, one can see that the shape of the SED measured from our data resembles that found by Kwok et al. (2022). While SN 2021aefx has faded slightly during the ≈102 days between these observations, the dominant emission features appear to have similar strengths with the exception of Co-dominated features (DerKacy et al. 2023) as 56Co decays into 56Fe. This is consistent with the optical and near-IR spectroscopic evolution of SNe Ia during this time span (e.g., Mazzali et al. 2020; Tucker et al. 2022a; Graham et al. 2022).
Our F2100W detection is unique because it was not covered by the spectrum obtained by Kwok et al. (2022). No models in the literature currently predict which emission features should be present at these wavelengths. Fransson & Jerkstrand (2015) suggest that several MIR fine-structure lines dominate the total emission of SN 2011fe at ∼1000 days after  , but time-dependent modeling is unavailable. Thus, we use simple assumptions to estimate the emission features responsible for the observed F2100W flux.
The temperature and electron density at these epochs are Te
≈ 104 K and ![${\mathrm{log}}_{10}({n}_{e}[{\mathrm{cm}}^{-3}])\,\approx $](https://content.cld.iop.org/journals/2041-8205/944/2/L28/revision1/apjlacb6d8ieqn5.gif) 5–6, respectively (e.g., Fransson & Jerkstrand 2015; Flörs et al. 2020; Shingles et al. 2022). The ground-state [Fe iii] 22.93 μm transition likely accounts for most of the observed flux despite the F2100W bandpass capturing only ∼50% of the total emission. The rest of the observed flux might be attributable to a combination of the weaker [Ar iii] 21.83 μm and [Co ii] 18.80 μm lines, although detailed modeling is needed to accurately capture the complex non-LTE processes at nebular epochs (e.g., Li et al. 2012; Shingles et al. 2020; Hoeflich et al. 2021). Future observations with the JWST MIRI Mid-Resolution Spectrometer (MRS; Wells et al. 2015) will directly measure the contributing spectral features.
5–6, respectively (e.g., Fransson & Jerkstrand 2015; Flörs et al. 2020; Shingles et al. 2022). The ground-state [Fe iii] 22.93 μm transition likely accounts for most of the observed flux despite the F2100W bandpass capturing only ∼50% of the total emission. The rest of the observed flux might be attributable to a combination of the weaker [Ar iii] 21.83 μm and [Co ii] 18.80 μm lines, although detailed modeling is needed to accurately capture the complex non-LTE processes at nebular epochs (e.g., Li et al. 2012; Shingles et al. 2020; Hoeflich et al. 2021). Future observations with the JWST MIRI Mid-Resolution Spectrometer (MRS; Wells et al. 2015) will directly measure the contributing spectral features.
Combining the flux-calibrated +255-day spectrum with our new optical and IR photometry, we estimate the fraction of flux emerging in the optical, near-IR, and mid-IR for both epochs. The F2100W measurement is excluded from these calculations owing to the uncertain spectral shape, as SNe Ia are dominated by line emission at nebular epochs. The +255-day spectrum is scaled to match the observed +357-day optical and IR photometry using the filter-specific decline rates shown in Figure 3. A bootstrapping routine is used to estimate the associated uncertainty. For the 1–2 μm region where we lack corresponding photometry, the J- and H-band decline rate is uniformly sampled between 0.0 and 0.3 mag/100 days, which was found for a sample of SNe Ia by Graur et al. (2020). The final scaled spectrum and its uncertainty are shown in Figure 4. The fraction of 1–2.5 μm to 0.3–1 μm flux is 5.1% ± 0.5% and 13.4% ± 1.3% at +255 and +357 days, respectively, in agreement with previous estimates for other SNe Ia (Stanishev et al. 2007; Leloudas et al. 2009; Dimitriadis et al. 2017; Maguire et al. 2018; Graur et al. 2020). We consider this agreement, without adopting prior assumptions on the optical to near-IR flux ratios, a general confirmation that our methodology is accurate within our quoted uncertainties.
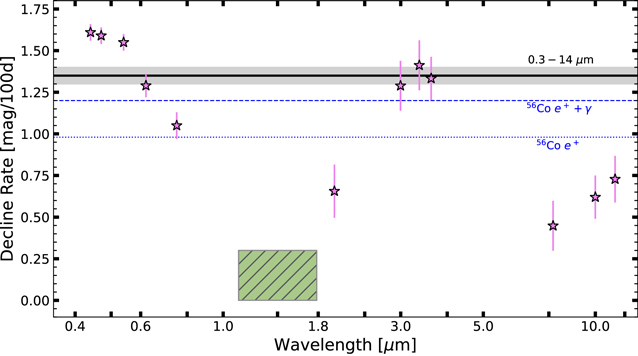
Figure 3. Nebular-phase decline rates as a function of wavelength for SN 2021aefx. The green region represents the J- and H-band decay rates of 0.0–0.3 mag/100 days from Graur et al. (2020). Blue horizontal lines show the energy deposition rate for 56Co with (dashed) and without (dotted) the γ-ray contribution included. The black line and shaded region represent the integrated 0.3–14 μm decline rate derived in Section 3. Data for this figure are included in the online version of the manuscript.(The data used to create this figure are available.)
Download figure:
Standard image High-resolution image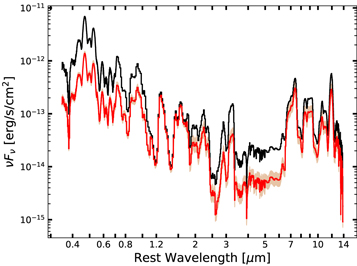
Figure 4. Flux-calibrated +255-day spectrum from Kwok et al. (2022; black) and our reconstructed +357-day spectrum (red). The shaded region represents the 95% confidence interval from the bootstrapping routine.
Download figure:
Standard image High-resolution imageTable 2 provides the fluxes for each wavelength region in addition to the fraction of the total 0.3–14 μm flux. The majority of the total flux is emitted at <1 μm for both epochs, although the relative fraction decreases from fopt ≈ 85% to 70%. This decrease is compensated by the increasing fractional flux at 1–2.5 μm and 5–14 μm. The 2.5–5 μm region appears to retain the same fraction of the total flux between the two epochs, although this spectral region only consists of ≈1.5% of the total flux.
Table 2. Integrated Fluxes F and Fractional Contribution to the Total 0.3–14 μm Flux f for Different Wavelengths
| λ | F255 | f255 | F357 | f357 | Δm |
|---|---|---|---|---|---|
| (μm) | (erg s−1 cm−2) | (%) | (erg s−1 cm−2) | (%) | (mag/100 days) |
| 0.3–1 | (1.3 ± 0.1) × 10−12 | 86.1 ± 3.9 | (3.0 ± 0.2) × 10−13 | 72.0 ± 4.6 | 1.57 ± 0.04 |
| 1–2.5 | (6.9 ± 0.3) × 10−14 | 4.7 ± 0.3 | (4.6 ± 0.4) × 10−14 | 11.3 ± 1.0 | 0.43 ± 0.08 |
| 2.5–5 | (2.1 ± 0.1) × 10−14 | 1.4 ± 0.1 | (5.6 ± 0.8) × 10−15 | 1.4 ± 0.2 | 1.42 ± 0.15 |
| 5–14 | (1.1 ± 0.1) × 10−13 | 7.5 ± 0.4 | (6.0 ± 0.5) × 10−14 | 14.9 ± 1.4 | 0.63 ± 0.08 |
| 0.3–14 | (1.5 ± 0.1) × 10−12 | … | (4.1 ± 0.2) × 10−13 | … | 1.35 ± 0.05 |
Note. Fractions may not exactly equal 100% owing to round-off and sampling errors.
Download table as: ASCIITypeset image
Finally, we use the integrated fluxes to compute the decline rates for the different wavelength regions listed in Table 2. We find that the majority of the emitted energy occurs at optical wavelengths, and this wavelength region also declines the fastest owing to higher-energy transitions becoming harder to populate as the density decreases. The ≈3–4 μm region also declines quickly owing to the presence of [Fe iii] emission features. Spectral regions corresponding to singly ionized transitions (1–2.5 μm, 6–12 μm) decline slower at ≲0.6 mag/100 days, in agreement with the findings of Gerardy et al. (2007) and McClelland et al. (2013). However, the fast-declining optical wavelengths dominate the total flux, producing a total 0.3–14 μm decline rate of Δm0.3−15 = 1.35 ± 0.05 mag/100 days. This is higher than the decay rate of 0.98 mag/100 days from 56Co positrons. Including the small amount of heating from singly scattered γ-ray photons (e.g., Equation (1) from Kushnir & Waxman 2020) raises the predicted decline rate to 1.20 mag/100 days, which still disagrees with our observed decline rate at ∼3σ.
4. Discussion
We have provided new nebular-phase optical and IR imaging of the SN Ia 2021aefx, including the first detection of an SN Ia at >15 μm. Only a few SNe Ia have mid-IR observations, so comparisons are limited. However, the general picture outlined by Fransson & Jerkstrand (2015) and Graur et al. (2020) appears robust. In this picture, ultraviolet flux from Fe transitions is redistributed into the optical and IR via multiple scatterings and fluorescence (e.g., Pinto & Eastman 2000). Spectral regions corresponding to doubly ionized transitions typically decay faster than their singly ionized counterparts owing to the ejecta cooling as it expands (e.g., McClelland et al. 2013). However, this framework for interpreting the observed decline rates may be overly simplistic, as the pseudocontinuum is produced by a multitude of overlapping spectral features (e.g., Fransson & Jerkstrand 2015; Mazzali et al. 2015; Wilk et al. 2020), which may or may not evolve similarly to the strongest emission feature in a given bandpass.
The derived (pseudo)bolometric decay rate of 1.35 ± 0.05 mag/100 days is higher than expected for 56Co decay. The most likely explanation for this discrepancy is that more flux is emerging at >14 μm at later epochs. [Fe ii] has two low-energy transitions at 24.52 and 25.99 μm with lower-level energies of El = 0.30 eV and El = 0.00 eV, respectively. The nebular-phase J- and H-band plateaus are driven by low-energy [Fe ii] transitions at 1–2 μm, so it is plausible that the mid-IR transitions experience a similar flattening in the decline rate. If there is no nonradiative energy loss at these epochs (i.e., the bolometric light curve follows the energy generation rate), then the flux at >14 μm must have a decline rate of ≈0.1 mag/100 days to reconcile our results with predictions for 56Co decay.
Although we find flux emerging at >14 μm the most plausible explanation, there are other physical processes that can expedite the (pseudo)bolometric decay relative to 56Co. Allowing a few percent of the high-energy positrons to escape the ejecta into the surrounding environment will increase the nebular-phase decline rate. In this scenario, the bolometric light curve does not reflect the energy deposition rate, as some of the radioactive decay energy is not converted into photons. Magnetic fields can restrict the propagation of positrons within the ejecta, but the source and strength of such fields remain unclear (e.g., Hristov et al. 2018). Furthermore, the fraction of escaping positrons would need to increase between +255 and +357 days, which is possible if the magnetic field strength diminishes as the density decreases. Allowing even a small fraction of positrons to escape the ejecta would have important ramifications for our understanding of the 511 keV positronium annihilation signal observed in the Milky Way (e.g., Siegert et al. 2016). Conversely, complete positron confinement requires a relatively strong (≳106 G) and/or morphologically complex magnetic field (e.g., Table 2 in Hristov et al. 2021). Strong magnetic fields can be produced in the merger of two white dwarfs (e.g., Williams et al. 2022), but it is unclear how the magnetic field strength and morphology will be affected by the explosion (e.g., Remming & Khokhlov 2014). Alternatively, particle streaming instabilities can generate magnetic fields (e.g., Gupta et al. 2021), but no simulations have assessed whether nebular-phase SN Ia ejecta meet the required instability criteria.
Separately, Kushnir & Waxman (2020) propose that the expansion of the ejecta will extend the time over which 56Co positrons deposit their energy into the ejecta. This “delayed deposition” effect should result in a steepening of the light curve (relative to 56Co decay) at ≲500 days after  owing to the finite time needed for positrons to deposit their energy into the ejecta. The deviation from 56Co decay is only a few percent of the energy generation rate at ∼200–400 days after
  , which can qualitatively reproduce our pseudobolometric decline rate. However, these epochs correspond to a flattening in the differential heating rate (see Figure 3 in Kushnir & Waxman 2020), which may negate any deviations from 56Co decay during our observational baseline.
Future observations of SNe Ia with JWST are crucial to better understand the complex physics governing SNe Ia at nebular phases. Multiepoch photometry constrains the mass ratios of isotopes produced during high-density burning (e.g., Kerzendorf et al. 2017; Shappee et al. 2017). The late-time (≳500 days after  ) mid-IR luminosity is a key diagnostic of the ejecta’s cooling properties, as these epochs correspond to the end of the H-band light-curve plateau (Graur et al. 2020) and a distinct shift in the optical ionization properties (Tucker et al. 2022a). Several lines of evidence suggest that clumping is present in SN Ia ejecta (e.g., Black et al. 2016; Mazzali et al. 2020), but specifics about the physical conditions remain elusive (e.g., Wilk et al. 2020; Shingles et al. 2022). Emission-line profiles in the near- and mid-IR should be able to directly ascertain the nebular-phase magnetic field strength (Penney & Hoeflich 2014) and further constrain positron propagation (or lack thereof) within the ejecta (e.g., Hristov et al. 2021).
JWST is poised to revolutionize our understanding of SNe Ia in the nebular phase with both dedicated SN Ia programs (e.g., GO 2072, PI: Jha; GO 2114, PI: Ashall) and serendipitous observations like those presented here. To date, the PHANGS-JWST program has observed six nearby star-forming galaxies (IC 5332, NGC 0628, NGC 1365, NGC 1385, NGC 1566, NGC 7496). Of those galaxies, two have confirmed SNe Ia in the JWST footprint that exploded within the past 20 yr: SN 2010el (SN Iax; Foley et al. 2013) and SN 2021aefx in NGC 1566 and SN 2012fr in NGC 1365. SN 2021aefx is analyzed here. SN 2010el is located coincident to heavy background emission in the MIRI filters and is not visible in any of the available filters (e.g., Table 1). Similarly, there is no obvious emission seen at the location of SN 2012fr. These results are unsurprising because the JWST images were obtained 9.75 yr after  (Contreras et al. 2018) for SN 2012fr and ∼12.5 yr after the discovery (Monard 2010) of SN 2010el.
The PHANGS-JWST Cycle 1 Treasury Program will be observing 13 more galaxies in addition to those listed above, and we will continue searching for SN emission in future PHANGS data. Even the SNe that do not show clear nebular-phase emission offer an unprecedented, sharply resolved view of the environments into which SNe deposit their energy and momentum. Looking at the IR emission at the locations of these SNe can be used to constrain the late-time impact of these explosions and assess their role in the evolution of the interstellar medium (e.g., Mayker Chen et al. 2022).
This work was carried out as part of the PHANGS Collaboration.
A.K.L. and N.M.C. gratefully acknowledge support by grants 1653300 and 2205628 from the National Science Foundation, award JWST-GO-02107.009-A, award SOSP SOSPADA-010 from the NRAO, and a Humboldt Research Award from the Alexander von Humboldt Foundation.
E.R. acknowledges the support of the Natural Sciences and Engineering Research Council of Canada (NSERC), funding reference No. RGPIN-2022-03499, and the support of the Canadian Space Agency (CSA) [22JWGO1-20].
S.W.J. and L.A.K. acknowledge support by NASA grant JWST-GO-02072.001 and NASA FINESST fellowship 80NSSC22K1599.
J.D., C.A., and P.H. acknowledge support by NASA grant JWST-GO-02114.032-A.
M.B. acknowledges support from FONDECYT regular grant 1211000 and by the ANID BASAL project FB210003.
F.B. acknowledges funding from the European Research Council (ERC) under the European Union's Horizon 2020 research and innovation program (grant agreement No. 726384/Empire).
O.E. gratefully acknowledges funding from the Deutsche Forschungsgemeinschaft (DFG, German Research Foundation) in the form of an Emmy Noether Research Group (grant No. KR4598/2-1, PI Kreckel).
E.S. acknowledges funding from the European Research Council (ERC) under the European Union's Horizon 2020 research and innovation program (grant agreement No. 694343).
L.G. acknowledges financial support from the Spanish Ministerio de Ciencia e Innovación (MCIN), the Agencia Estatal de Investigación (AEI) 10.13039/501100011033, and the European Social Fund (ESF) “Investing in your future” under the 2019 Ramón y Cajal program RYC2019-027683-I and the PID2020-115253GA-I00 HOSTFLOWS project; from Centro Superior de Investigaciones Científicas (CSIC) under PIE 20215AT016 and LINKA20409 projects; and from the program Unidad de Excelencia María de Maeztu CEX2020-001058-M.
M.O. acknowledges support from UNRN PI2020 40B885.
M.D. Stritzinger is funded by the Independent Research Fund Denmark (IRFD, grant No. 10.46540/2032-00022B).
This work is based on observations made with the NASA/ESA/CSA James Webb Space Telescope. The data were obtained from the Mikulski Archive for Space Telescopes at the Space Telescope Science Institute, which is operated by the Association of Universities for Research in Astronomy, Inc., under NASA contract NAS 5-03127 for JWST. These observations are associated with program Nos. 02107 and 02072. The specific observations for PHANGS-JWST can be accessed via doi:10.17909/9bdf-jn24.
Facility: JWST (NIRCam, MIRI) - , Swope (SITe3) - .
Software: Astropy (Astropy Collaboration et al. 2013), photutils (Bradley et al. 2020), Jupyter (Kluyver et al. 2016).
Footnotes
- 29
- 30
- 31
- 32
- 33
- 34
- 35
- 36
- 37
This approach neglects second-order effects related to the locations of the lines and the spectral slope adopted during calibration. When comparing to the Kwok et al. (2022) spectral data below, we impute synthetic photometry from their spectra to allow a rigorous comparison.
- 38