Abstract
As part of the Canadian Hydrogen Intensity Mapping Experiment Fast Radio Burst (CHIME/FRB) project, we report 41 new rotation measures (RMs) from 20 repeating fast radio bursts (FRBs) obtained between 2019 and 2023 for which no previous RM was determined. We also report 22 additional RM measurements for eight further repeating FRBs. We observe temporal RM variations in practically all repeating FRBs. Repeaters appear to be separated into two categories: those with dynamic and those with stable RM environments, differentiated by the ratios of RM standard deviations to the averaged RM magnitudes. Sources from stable RM environments likely have small RM contributions from the interstellar medium of their host galaxies, whereas sources from dynamic RM environments share some similarities with Galactic pulsars in eclipsing binaries but appear distinct from solitary pulsars in the Galactic centre. We observe a new stochastic, secular, and again stochastic trend in the temporal RM variation of FRB 20180916B, which does not support binary orbit modulation being its cause. We highlight two more repeaters that show RM sign change, namely FRBs 20290929C and 20190303A. We perform an updated comparison of polarization properties between repeating and nonrepeating FRBs, which show a marginal dichotomy in their distribution of electron-density-weighted parallel-component line-of-sight magnetic fields.
Original content from this work may be used under the terms of the Creative Commons Attribution 4.0 licence. Any further distribution of this work must maintain attribution to the author(s) and the title of the work, journal citation and DOI.
1. Introduction
Fast radio bursts (FRBs) are bright, millisecond bursts of radio waves from extragalactic distances. First discovered by D. R. Lorimer et al. (2007), the provenance of these energetic bursts remains a mystery. Polarization analysis of FRBs is a way to obtain observational constraints that can provide important clues to their emission mechanisms and their host environments, hence improving our understanding of the progenitor theories.
In the literature, polarimetric information is still relatively rare for FRBs. At the time of writing, polarimetric information is only available for over 100 sources out of the 700+ currently published FRB sources. This is because most of the FRB search programs thus far are conducted using intensity data, so polarization analysis is limited to search projects equipped with the capability to trigger raw voltage callback or to repeating FRBs where subsequent follow-up observations collecting Stokes information are possible.
The detection of linear polarization implies the possibility of constraining the Faraday rotation measure (RM), which represents the amount of rotation of the polarization position angle of linearly polarized light as it passes through a magnetoionic medium due to the influence of the magnetic field and the column density of the free electrons along the line of sight between the FRB and the observer. Thus far, FRBs have mostly been observed with high linear polarization fraction, although values from 0 to 100% have been reported (see, e.g., A. Pandhi et al. 2024; M. B. Sherman et al. 2024). FRBs have also been seen with a wide range of RM magnitudes, from almost zero to tens of thousands of rad m−2 (D. Michilli et al. 2018). The observed RM values can shed light on the local environment of the FRB, given that the contribution of the intergalactic medium to the RM is expected to be small (see, e.g., A. D. Amaral et al. 2021). For example, the high RM magnitude of the order of 105 rad m−2 and large temporal RM variations observed for FRB 20121102 may be associated with a turbulent supernova remnant (B. Marcote et al. 2017). At the other end of the scale, the almost-zero RM observed in FRB 20200120E has been attributed to the clean environment of the host globular cluster (M. Bhardwaj et al. 2021; F. Kirsten et al. 2022; K. Nimmo et al. 2022). Small observed RM values can also be used as an upper bound to constrain the cosmic contribution to the line-of-sight RM and help to probe the magnetization of the cosmic web (S. Hackstein et al. 2019). Magnetic field strengths of a few microgauss have been derived from FRB RM measurements (see, e.g., R. Mckinven et al. 2023a; M. B. Sherman et al. 2023). This is nonnegligible compared to magnetic field strengths in the interstellar medium (ISM), which can range from ∼5 μG in the solar neighborhood (L. F. Burlaga et al. 2013) to ∼10 μG in the dense Galactic plane (R. M. Crutcher 2012), to tens of microgauss in nearby starburst galaxies (R. Beck 2015).
The polarization angle (PA; ψ) is the emission angle (geometry) of the linearly polarized component of the light from the FRB source and is typically presented as a function of time during the burst. It is defined to be PA =  , where Qderot and Uderot are the QU-fitting derotated Stokes values. Diverse PA variations during bursts (for example, sweeping up, down, up, and down) have been observed in some FRBs (e.g., FRB 20180301; R. Luo et al. 2020), with at least one recently reported one-off FRB displaying PA evolution that closely matches the rotating vector model often applied to pulsar measurements (R. Mckinven et al. 2024). It has been suggested that such diverse variations are consistent with a magnetospheric origin for the FRB radio emission associated with different open magnetic field line regions as the central compact object, possibly a magnetar, rotates, and disfavor synchrotron maser models that predict constant PAs attributed to ordered magnetic fields. However, the fact that both varying and constant PAs have been observed in repeaters and nonrepeaters (K. Masui et al. 2015; D. Michilli et al. 2018; R. Luo et al. 2020) in different environments (Y. Feng et al. 2022) also suggests that the PA is intrinsic to the radiation physics of the FRB and might not be a meaningful classifier to distinguish between different repetition behaviors and host environments.
Currently, ∼3% of all published FRBs have been seen to repeat21 (CHIME/FRB Collaboration et al. 2023). Repeating FRBs allow for the study of temporal variations in the polarization properties. RM variations on timescales of days to years have been detected, potentially pointing to dynamic magnetoionic environments (G. H. Hilmarsson et al. 2021; R. Mckinven et al. 2023b). A temporal RM sign change in FRB 20190520B indicated a reversal in the direction of the magnetic field lines, where the orbit of a binary star has been proposed as an explanation for the observed polarization properties (R. Anna-Thomas et al. 2023).
The Canadian Hydrogen Intensity Mapping Experiment (CHIME) is a radio telescope located at the Dominion Radio Astrophysical Observatory. As a transit telescope, CHIME has no moving parts and scans each sky position within its ∼200 deg2 instantaneous field of view with a daily cadence. This makes the FRB search backend of CHIME (CHIME/FRB Collaboration et al. 2018) particularly well suited for discovering and subsequently monitoring repeating FRB behavior. At the time of writing, 60 repeating FRBs are reported on the CHIME repeating FRB database22 (CHIME/FRB Collaboration et al. 2019, 2023; E. Fonseca et al. 2020). Furthermore, CHIME is equipped with a complex voltage recording system (herein referred to as the baseband buffer system; D. Michilli et al. 2021), which holds data from the last ∼20 s. FRBs above the detection threshold trigger a callback data dump from the baseband ring buffer, enabling a polarimetric study of FRBs with high time and frequency resolution.
This paper presents the first polarization information for 20 repeating FRBs whose discoveries were initially reported by CHIME/FRB Collaboration et al. (2023, hereafter CHIME23), which increases the number of repeaters with polarization properties from 18 to 38. We also present updated polarization information for eight repeating FRBs with previously published polarization data. In Section 2, we describe the data set and the analysis techniques. We present the polarization results In Section 3, and discuss the astrophysical implications in Section 4, before concluding in Section 5.
2. Observations, Data Reduction, and Analysis
This work presents the first polarization data for 20 repeating FRBs whose discoveries were initially reported in CHIME23. During the period 2019 April–2023 July, triggered baseband data (D. Michilli et al. 2021) were captured for about half of the bursts CHIME/FRB detected from these repeaters. These 53 events are listed in Table 2. These bursts met the baseband triggering threshold for signal-to-noise ratio (S/N) that was set at 10. Five out of the 25 sources from the CHIME23 sample (FRBs 20190226B, 20200420A, 20181226F, 20191114A, and 20200913C) have no baseband data in that time period. These sources are not discussed further in this paper. In addition, eight repeaters whose polarization properties have previously been reported by P. Kumar et al. (2019, 2022), M. Bhardwaj et al. (2021), G. H. Hilmarsson et al. (2021), and R. Mckinven et al. (2023a, 2023b) continued to be detected by CHIME. During the period 2019 January–2024 May, 22 events with new polarization results from these sources were detected and these are presented in Table 3. Note that all but one FRB in this group were initially discovered by CHIME/FRB (CHIME/FRB Collaboration et al. 2019; E. Fonseca et al. 2020; M. Bhardwaj et al. 2021). The exception is FRB 20171019A, which was discovered using the ASKAP radio telescope (R. M. Shannon et al. 2018).
The key features of the CHIME baseband polarization processing are summarized below. First, the baseband data are localized and beamformed at the best sky position of each repeater using the CHIME/FRB localization pipeline presented by D. Michilli et al. (2021). These data are coherently de-dispersed at the S/N-optimizing dispersion measure (DM) determined by the search pipeline. The output of the baseband pipeline is data consisting of dual polarization information along N–S and E–W directions, with 1024 frequency channels at a frequency resolution of 390 kHz with a time resolution of 2.56 μs. From these input data, we search for the structure-optimized DM (DMstruct) using the dm_phase23 package (see A. P. Curtin et al. 2024, for more details). It is important to properly align the FRB signal before conducting the polarization analysis, since an incorrect DM value could impact the RM and ψ measurements.
The polarization pipeline of R. Mckinven et al. (2021) computes the four Stokes parameters (I for total intensity, Q and U for linearly polarized components, and V for the circularly polarized component) as well as the polarization angle. Two RM detection methods are implemented in the polarization pipeline. The RM synthesis technique (B. J. Burn 1966; M. A. Brentjens & A. G. de Bruyn 2005) steps through trial Faraday depths (ϕ) and calculates the corresponding average linearly polarized intensity across CHIME’s 400–800 MHz bandpass. The range of ∣ϕ∣ searched is inversely proportional to the bandwidth of the event and is set to be the point where intrachannel depolarization is at maximum 50%. Since it is assumed that the FRB emission region is small and has little Faraday complexity (the “Faraday thin regime”), if the FRB signals are polarized, we expect to see a single peak at a specific Faraday depth in the resulting Faraday dispersion function (FDF). By fitting a parabolic curve to the FDF, we obtain the rotation measure (RMFDF) at the peak of the fit while the uncertainty in RMFDF is taken to be the FWHM divided by 2 × S/N.
The FDF method does not correct for the cable delay between the two linear polarizations, which means we can lose some polarized signal. We have attempted to extract the RM using the QU-fitting technique (S. P. O’Sullivan et al. 2012), which models the oscillations in Stokes Q and U introduced by Faraday rotation. This method allows for a simultaneous fitting of the instrumental leakage in Stokes U–V and the polarization model (Q, U, RM, ψ). However, we notice an inconsistency in the sign of the RM values between the FDF and QU-fitting methods. It appears that QU-fitting does not perform well for narrow or low-S/N bursts and can show the wrong RM sign. For this reason, we choose to report only RM values derived using the FDF method in Tables 2 and 3.
Intrachannel depolarization could lead to a nondetection if the intrinsic RM is high. To mitigate this issue, a semicoherent RM search (R. Mckinven et al. 2021) is performed for events where no significant RM peaks were found in the RM synthesis. Coherent derotation is conducted at a sparse grid of trial RMs in the range −106 ≤ RM ≤ 106 rad m−2, followed by an incoherent RM search like the regular pipeline around neighboring RM values. We note that in this work, the semicoherent search did not detect any RM with large magnitudes.
To study the extragalactic DM and RM contributions for each FRB (see Section 4.3), we compute and subtract the RM contribution from the Milky Way using the map of S. Hutschenreuter et al. (2022) and the DM contribution using the thermal electron density maps of J. M. Yao et al. (2017) and J. M. Cordes & T. J. W. Lazio (2002) by using a Python wrapper code PyGEDM package.24 See Table 1 for the Galactic DM and RM estimates for the 28 repeaters presented in this paper. The Galactic DM estimates do not include the DM contribution of the Galactic halo, which is expected to contribute an average value of ∼30–50 rad m−2, depending on the halo model assumed (e.g., K. Dolag et al. 2015; S. Yamasaki & T. Totani 2020; A. M. Cook et al. 2023). We have not taken into account the RM contribution from the Earth’s ionosphere since, conveniently for CHIME, most FRBs were detected close to the zenith during meridian transients. This means that the ionospheric RM variations due to pointings at different line-of-sight elevations are expected to be minimal (no more than a few rad m−2) and less than the uncertainty of the RM values.
Table 1. Galactic DM and RM Estimates and the Coordinates for the 28 Repeating FRBs Presented in This Paper
| Source | α | δ | DMMW | RMMW | |
|---|---|---|---|---|---|
| (pc cm−3) | (rad m−2) | ||||
| TNS Name | (J2000) | (J2000) | NE2001 | YMW16 | |
| FRB 20171019A | 334.3(18) | −8.66(11) | ∼37 | ∼26 | −24(7) |
| FRB 20180910A | 354.8(9) | 89.01(1) | ∼57 | ∼55 | −15(9) |
| FRB 20180916B | 29.170(7) | 65.740(18) | ∼199 | ∼325 | −94(45) |
| FRB 20181119A | 190.50(12) | 65.13(15) | ∼34 | ∼26 | +22(5) |
| FRB 20190110C | 249.33(1) | 41.445(9) | ∼37 | ∼30 | 14(1) |
| FRB 20190117A | 331.75(3) | 17.383(4) | ∼48 | ∼40 | −26(8) |
| FRB 20190208A | 283.75(5) | 46.966(4) | ∼65 | ∼71 | −8(13) |
| FRB 20190303A | 208.25(5) | 48.250(4) | ∼30 | ∼22 | +21(5) |
| FRB 20190430C | 277.210(9) | 24.770(9) | ∼99 | ∼84 | 92(26) |
| FRB 20190604A | 218.75(4) | 53.283(3) | ∼32 | ∼24 | +12(2) |
| FRB 20190609C | 73.32(1) | 24.068(6) | ∼113 | ∼153 | −32(13) |
| FRB 20190804E | 261.34(2) | 55.069(8) | ∼43 | ∼37 | 11(6) |
| FRB 20190915D | 11.78(3) | 46.86(2) | ∼89 | ∼88 | 10(6) |
| FRB 20191013D | 40.42(2) | 13.63(3) | ∼43 | ∼36 | −7(4) |
| FRB 20191106C | 199.58(1) | 43.002(9) | ∼25 | ∼21 | −1(3) |
| FRB 20200118D | 106.91(1) | 42.837(9) | ∼77 | ∼91 | 2(6) |
| FRB 20200120E | 149.486(9) | 68.82(2) | ∼40 | ∼35 | −11(8) |
| FRB 20200127B | 119.2(1) | 86.609(8) | ∼54 | ∼51 | −23(10) |
| FRB 20200202A | 25.93(2) | 44.290(7) | ∼83 | ∼84 | −61(14) |
| FRB 20200223B | 8.265(8) | 28.831(7) | ∼46 | ∼37 | −54(6) |
| FRB 20200619A | 272.6(1) | 55.56(6) | ∼51 | ∼45 | 32(12) |
| FRB 20200809E | 20.0(1) | 82.89(2) | ∼72 | ∼81 | −5(10) |
| FRB 20200926A | 283.2(2) | 53.9(3) | ∼64 | ∼59 | 8(9) |
| FRB 20200929C | 17.04(2) | 18.47(1) | ∼38 | ∼29 | −18(3) |
| FRB 20201114A | 221.59(8) | 71.79(3) | ∼38 | ∼31 | 8(12) |
| FRB 20201124A | 77.0152(4) | 26.0610(2) | ∼123 | ∼197 | −57(33) |
| FRB 20201130A | 64.39(1) | 7.94(1) | ∼56 | ∼9 | 32(21) |
| FRB 20201221B | 124.20(3) | 48.78(2) | ∼51 | ∼46 | −1(3) |
Note. The NE2001 DM values are derived from the J. M. Cordes & T. J. W. Lazio (2002) model, whereas the YMW16 are from the model of J. M. Yao et al. (2017). The sky coordinates are taken from CHIME/FRB Collaboration et al. (2019, 2023) and E. Fonseca et al. (2020), whereas the DMs are estimated using the PyGEDM package. We note that the DM estimates have large systematic uncertainty, which is typically assumed to be ∼20% in the literature. Names are from the Transient Name Server (TNS).
A machine-readable version of the table is available.
Download table as: Machine-readable (MRT)Typeset image
3. Results
Table 2 lists the measured and fitted burst properties from the baseband data for the repeaters initially discovered in CHIME23, while the same information for the newer bursts of the previously published repeaters can be found in Table 3. Unconstrained parameters are shown as “−.” Uncertainties are reported at the 1σ confidence level. The topocentric times of arrival provided in the third column are in modified Julian date (MJD) format, referenced at 400 MHz with ∼1 s precision. The DMs reported in the fifth column are obtained through structure-optimization fitting (refer to A. P. Curtin et al. 2024). Certain bursts do not have significant S/N at our highest downsampling factor, and hence we are unable to determine a structure-maximized DM. In these cases, we visually determine the DMs and do not report any uncertainties for these measurements in Tables 2 and 3. These cases are discussed in further detail by A. P. Curtin et al. (2024). The downsampling factor in the sixth column provides the time resolution (i.e., ndown × 2.56 μs) of the dynamic spectrum (waterfall) plots displayed in Figures 1–4. The linear polarization fraction (L/I) in the seventh column is calculated by integrating L over the burst profile. The upper limits on L/I for unpolarized bursts are indicated by “<” symbols. It is possible that RM measurements with small magnitudes could be a result of instrumental effects, for example, leakage from Stokes I to Q induced by differential sensitivity of the X, Y polarized feeds (see e.g., R. Mckinven et al. 2021). However, if the associated L/I fraction is high and a burst signal is seen in both the Stokes Q and U waterfalls, then the RM value is unlikely to be purely instrumental (e.g., the case of burst #1 (TNS name 20190609C) from FRB 20190609C). We are thus reporting small RM values only if the associated L/I is high.
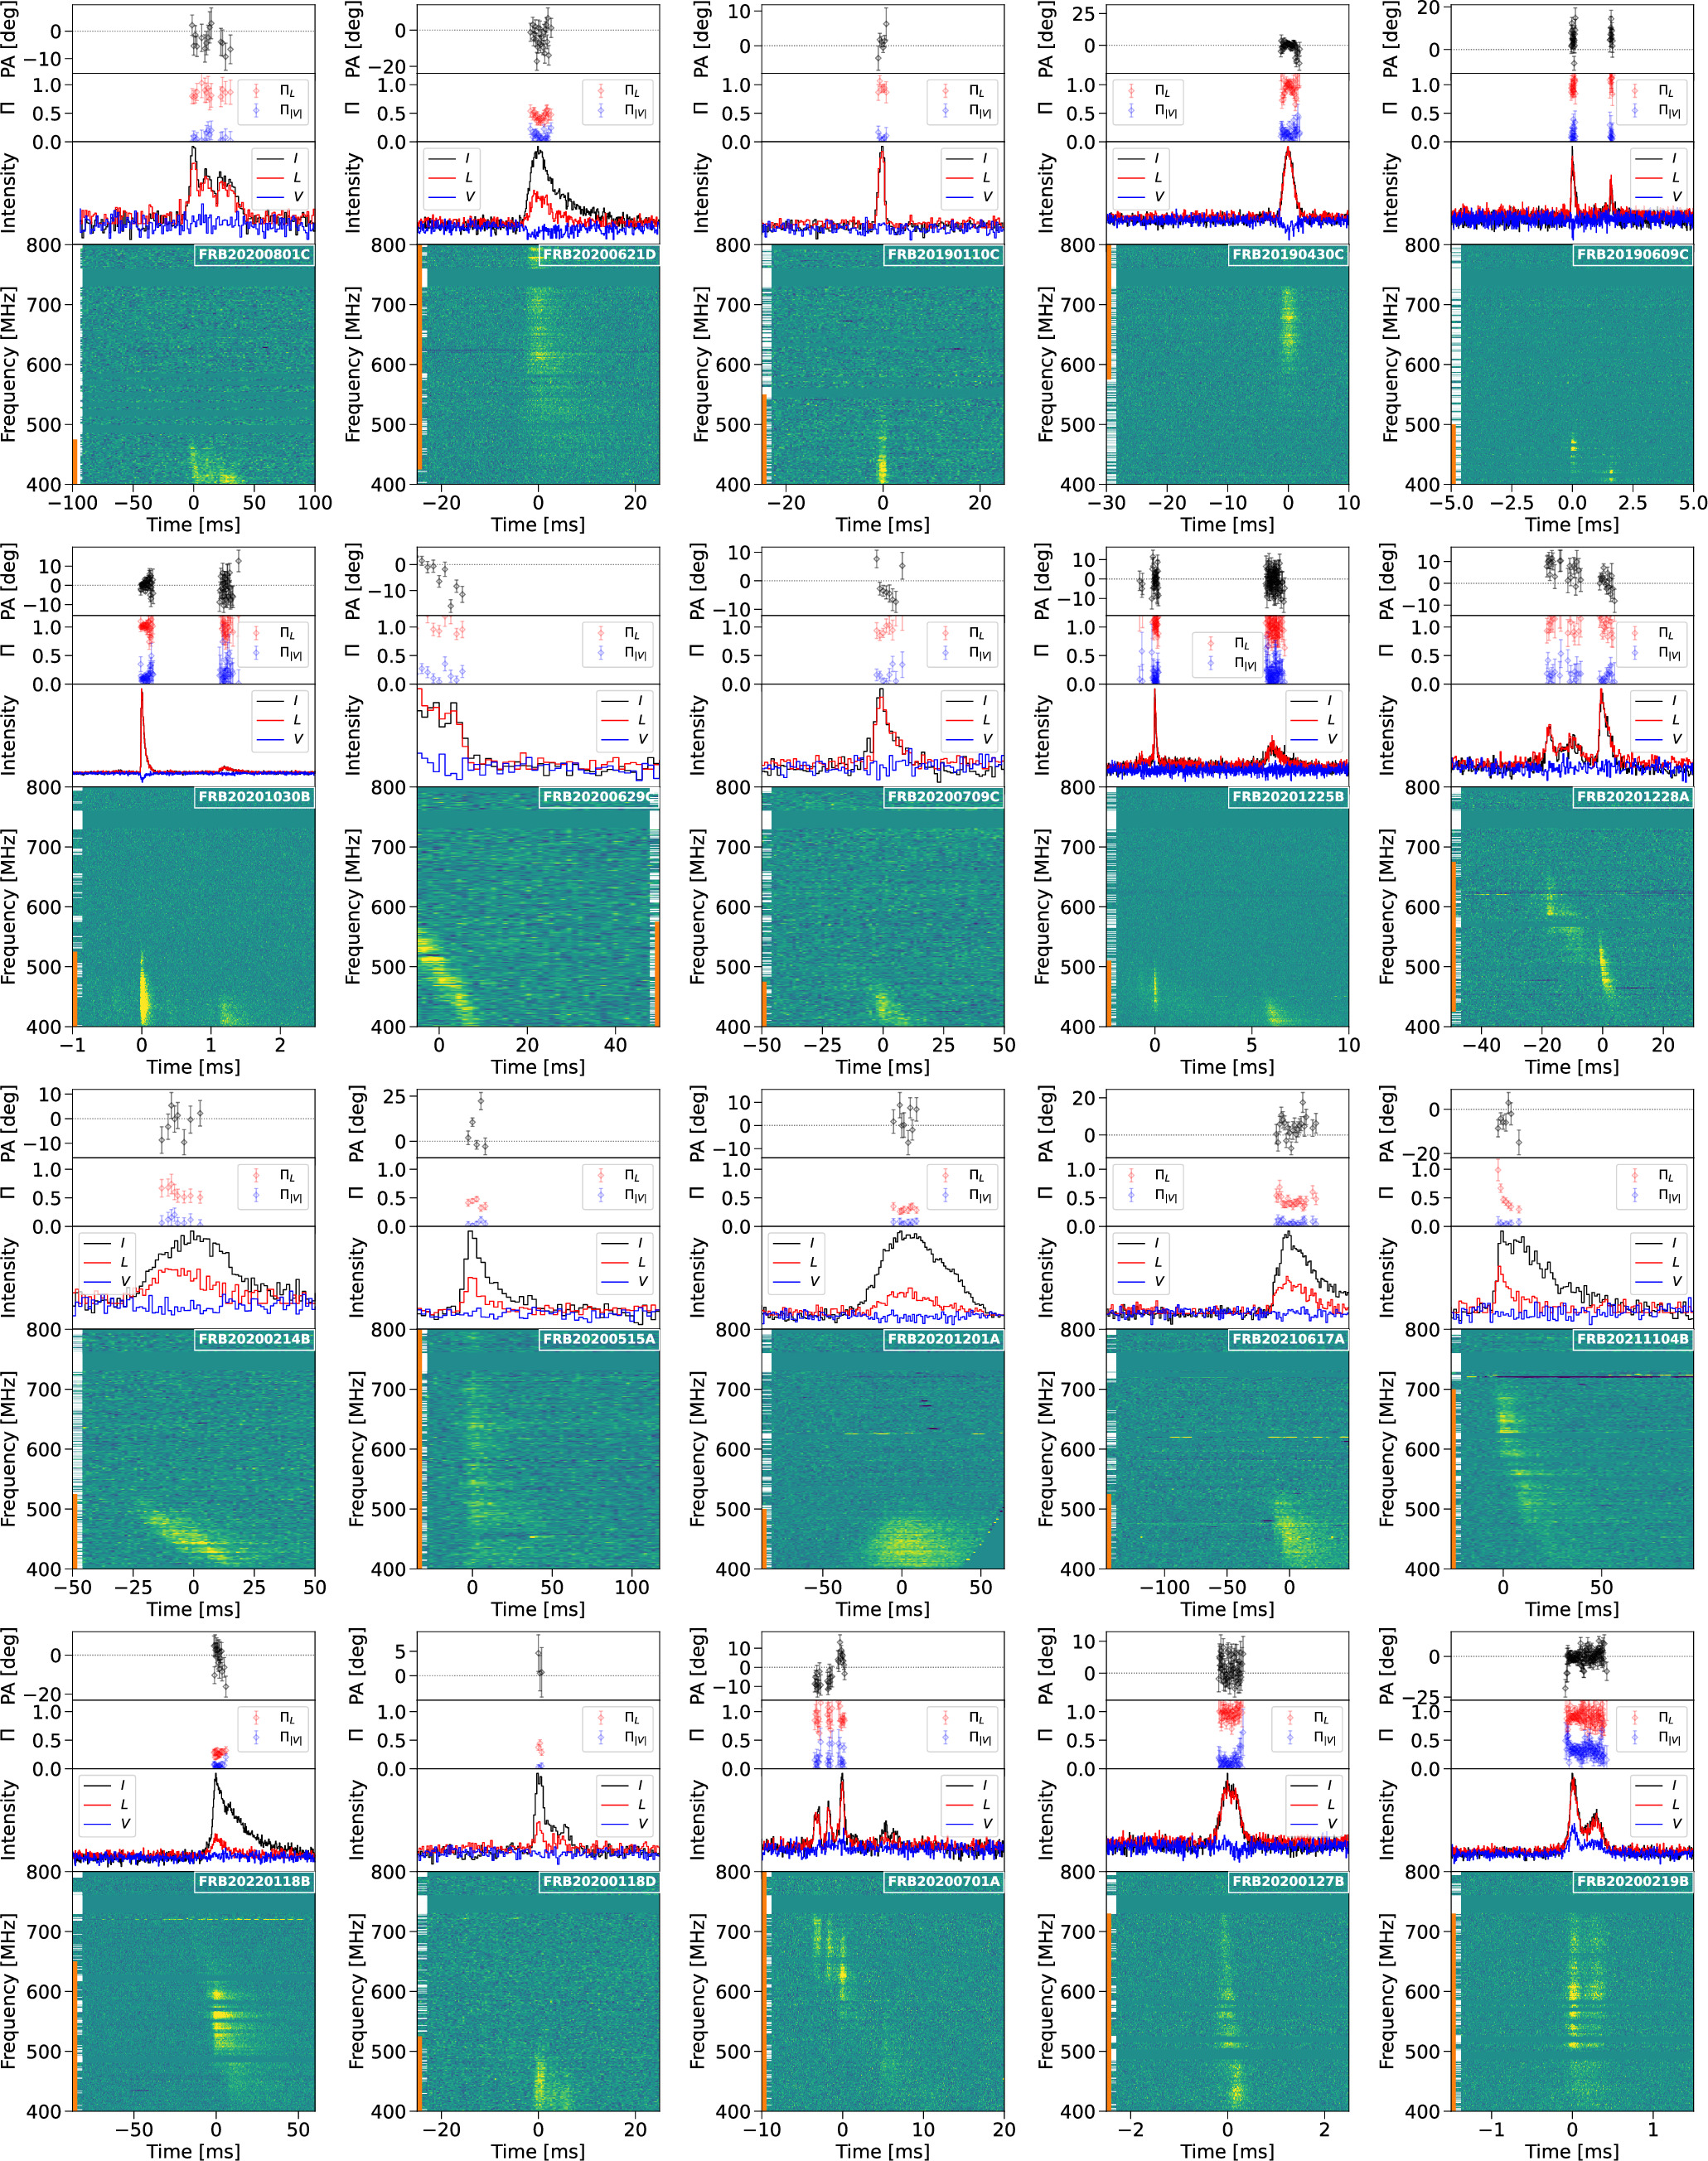
Figure 1. Total intensity waterfalls (de-dispersed to the associated DMstruct) and temporal profiles of Stokes I (black line),  (red line), V (blue line), linear polarization fraction (L/I; red circles), circular polarization fraction (∣V∣/I; blue circles), and linear polarization position angle (PA; black circles) for the FRBs from Tables 2 and 3. Channels masked due to radio-frequency interference are highlighted by white streaks and the spectral limits are indicated by orange lines on the left-hand side of the total intensity waterfall plots. The panels are labeled with the TNS name of each event.
Download figure:
Standard image High-resolution image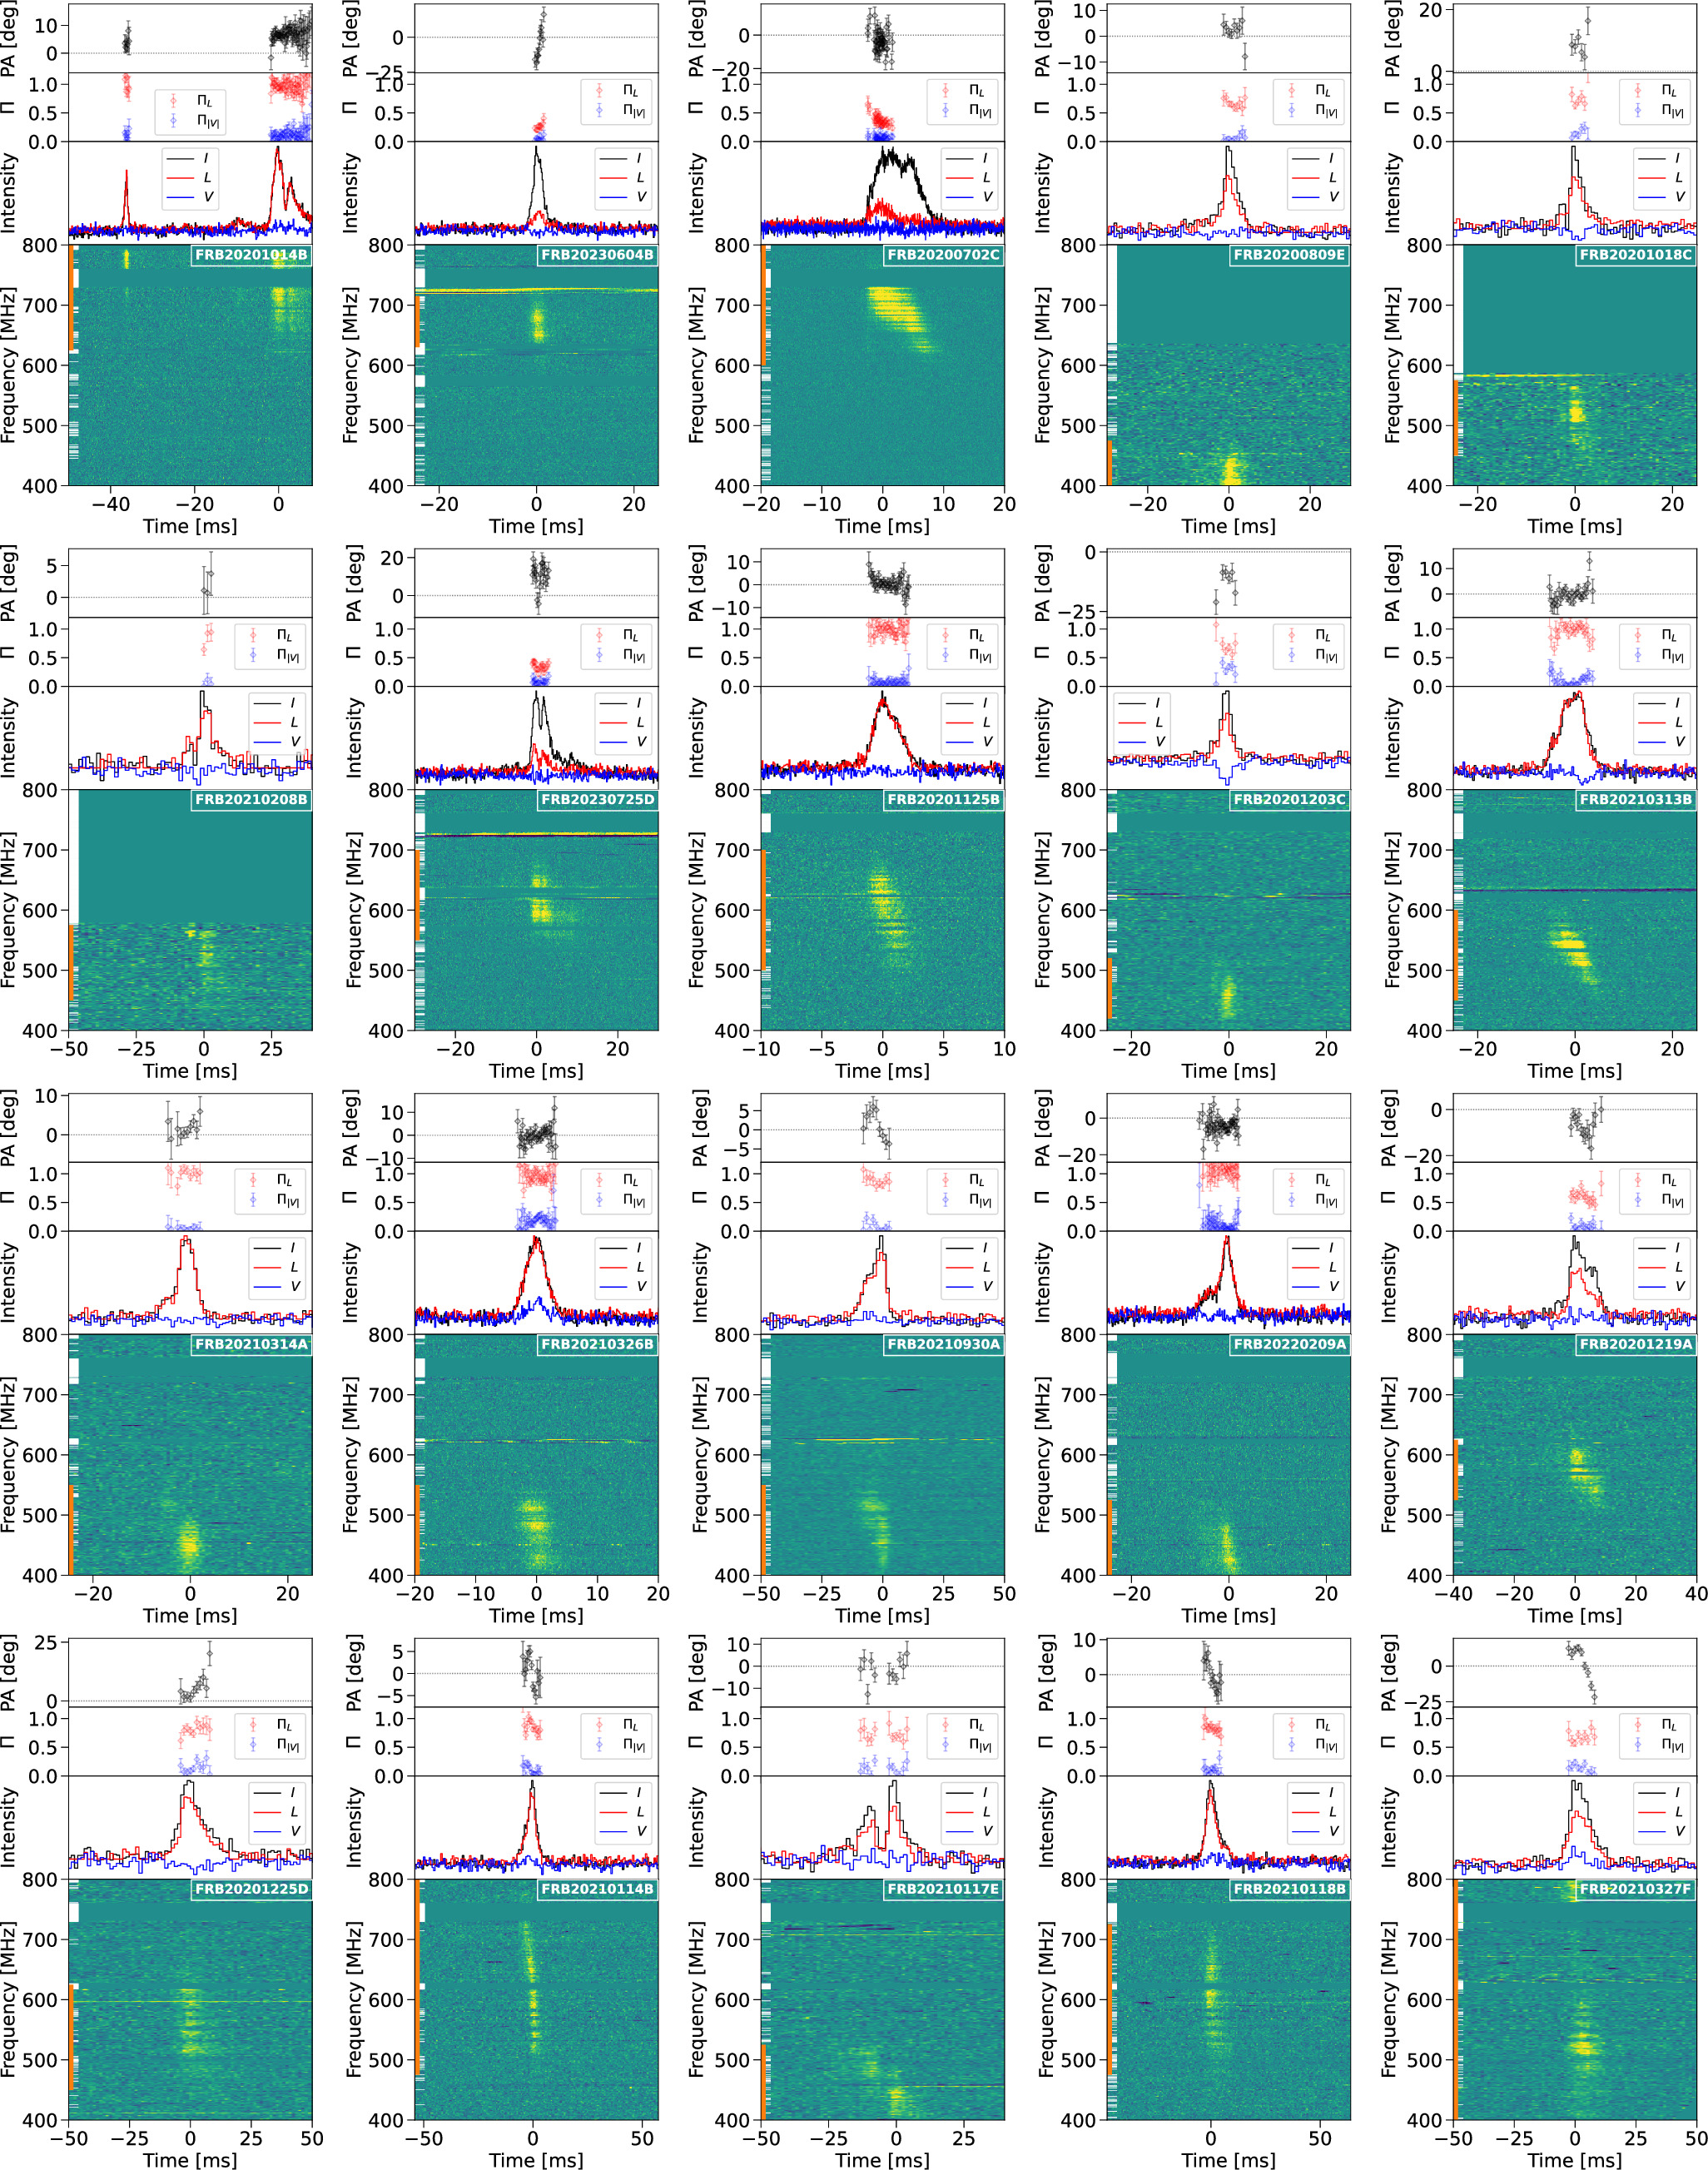
Figure 2. Further intensity waterfalls. Refer to the caption of Figure 1 for information on the legends and annotations.
Download figure:
Standard image High-resolution image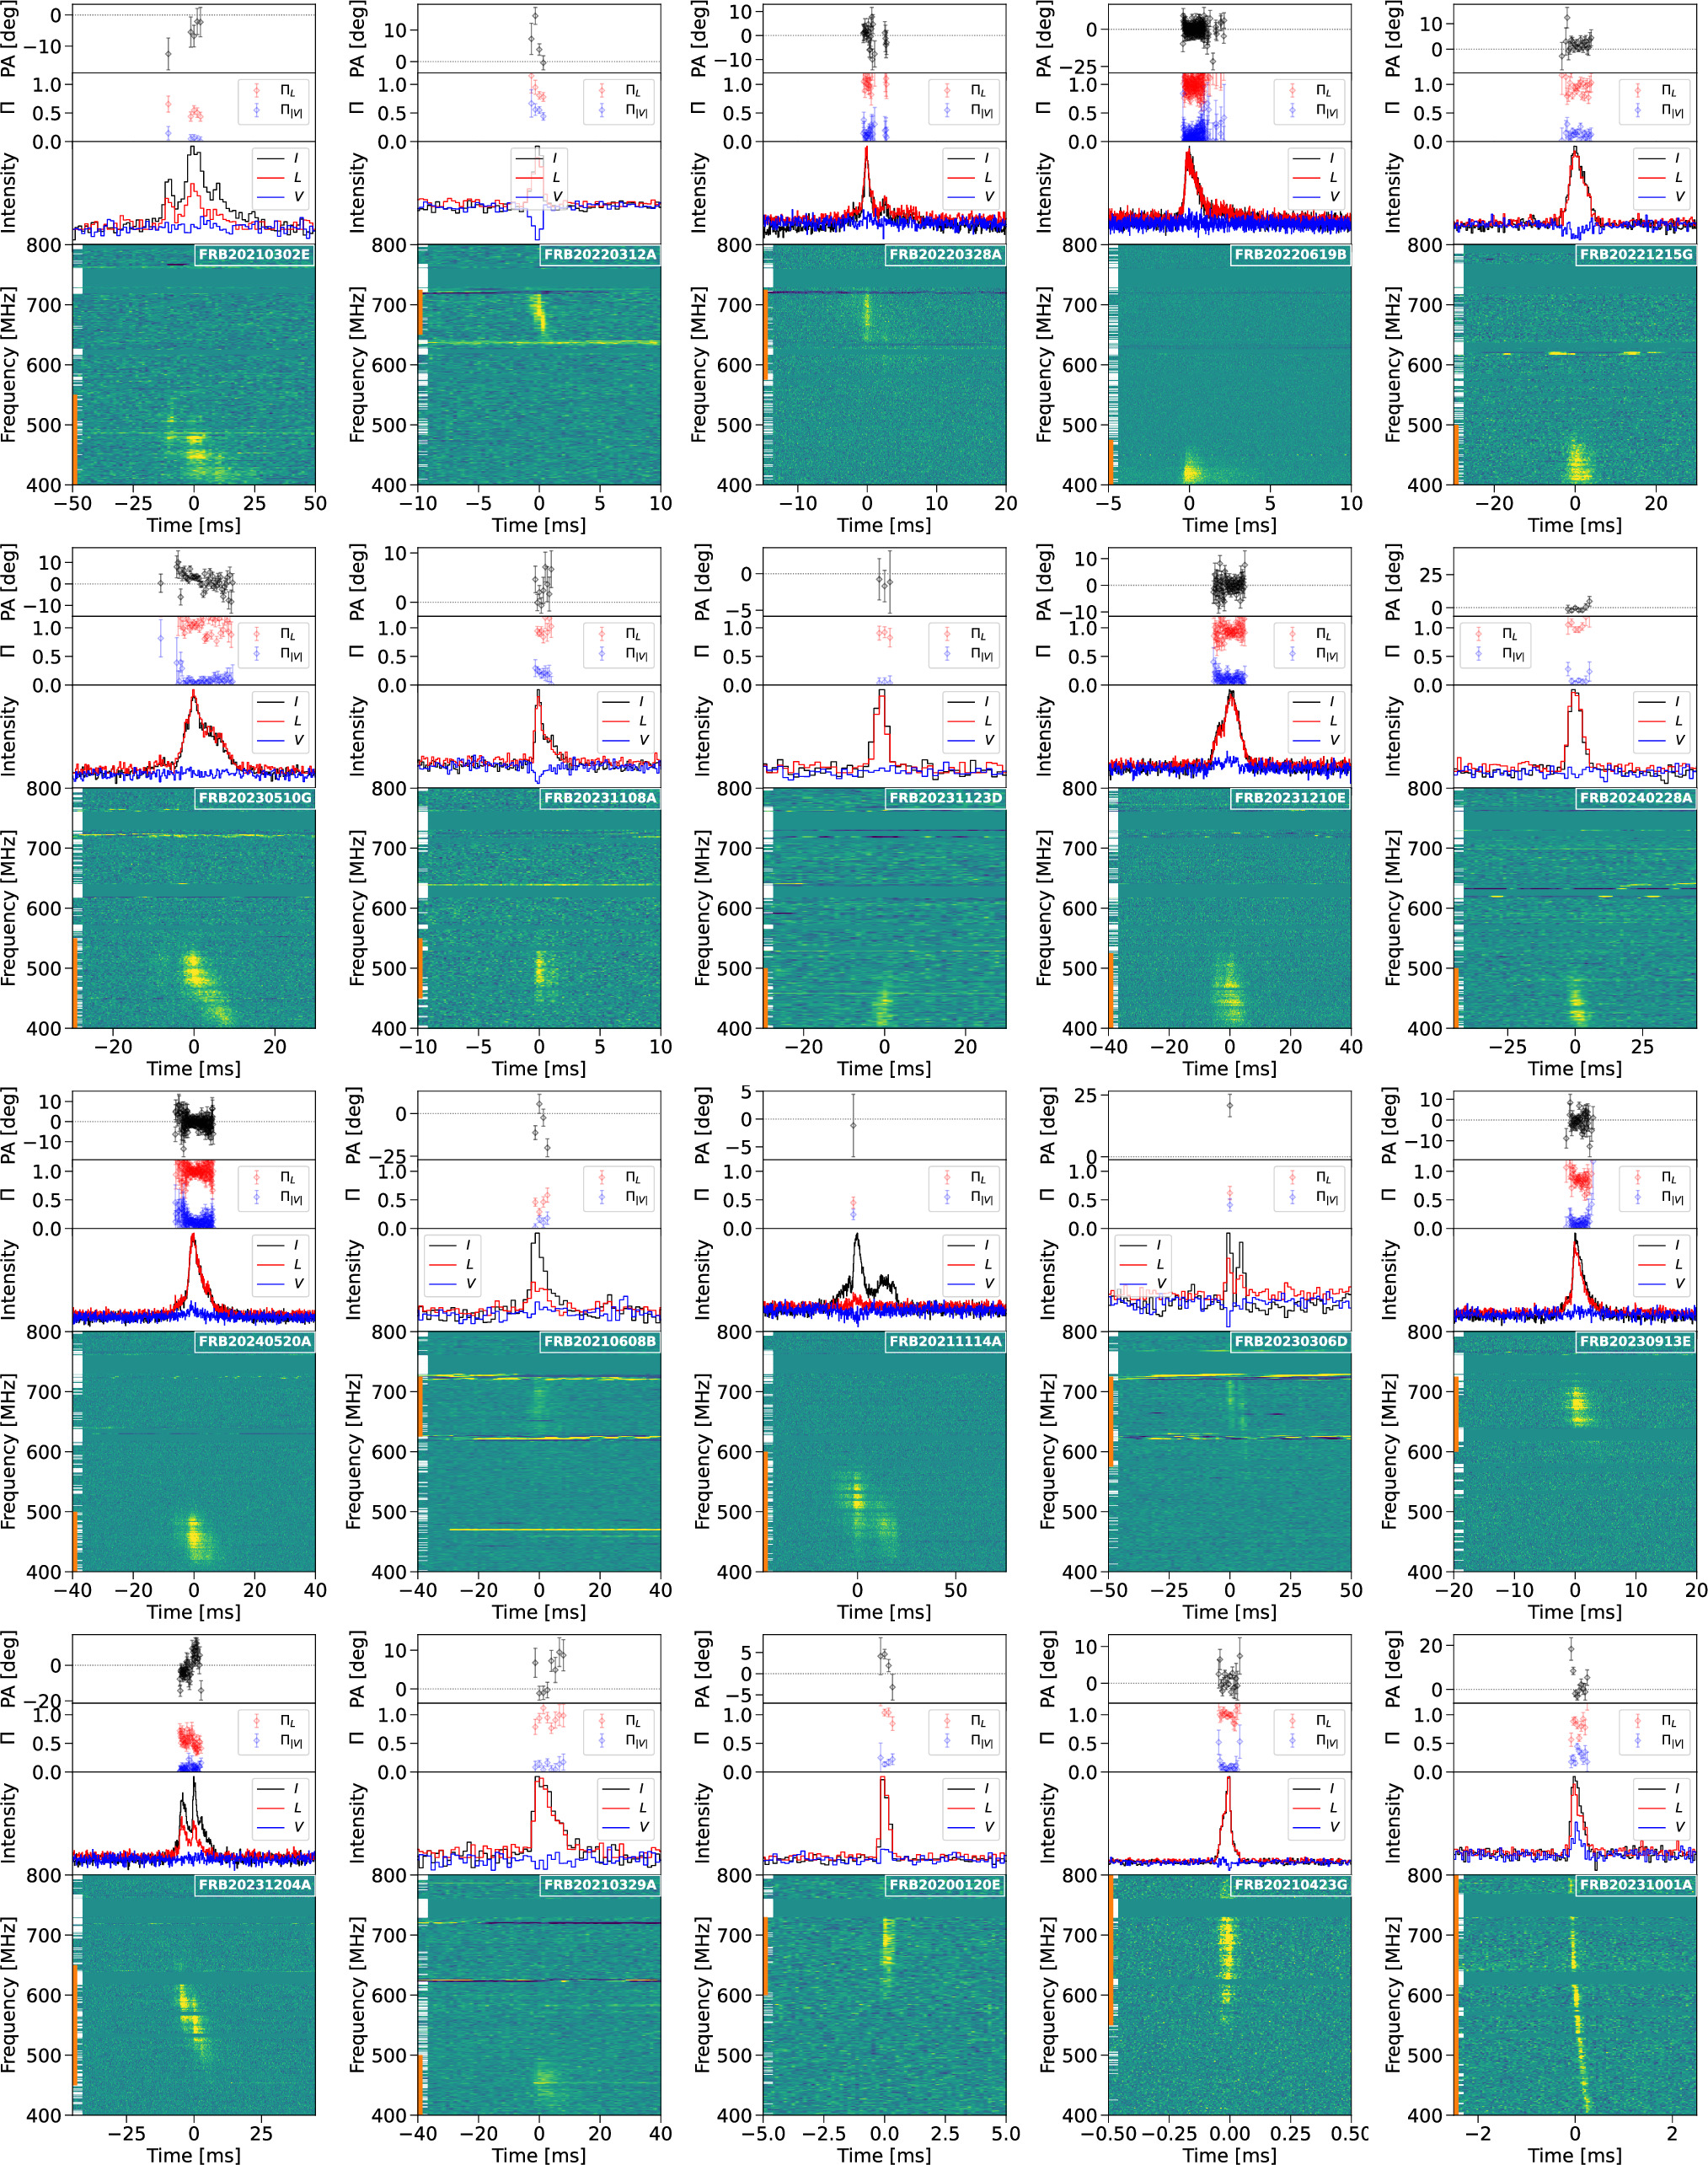
Figure 3. Further intensity waterfalls. Refer to the caption of Figure 1 for information on the legends and annotations.
Download figure:
Standard image High-resolution image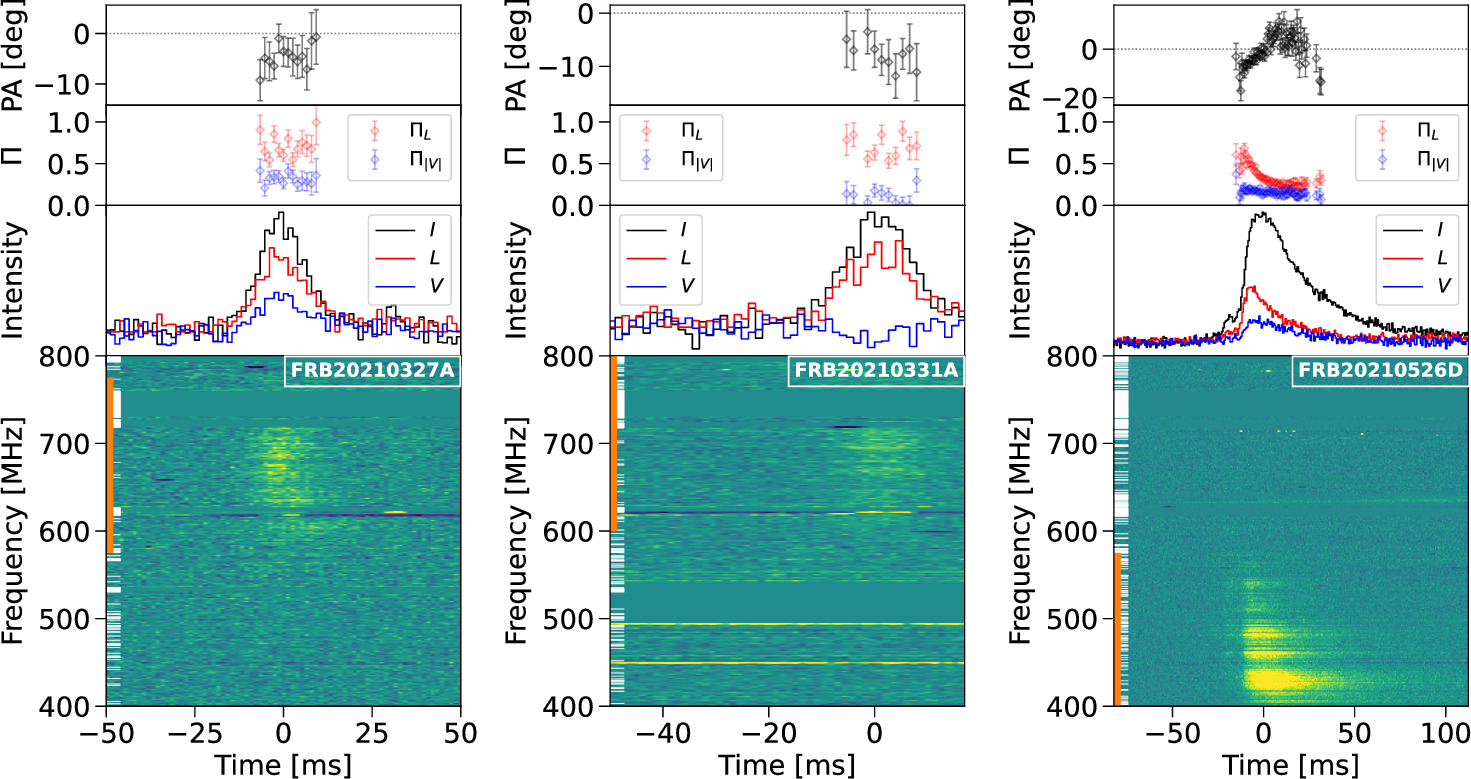
Figure 4. Further intensity waterfalls. Refer to the caption of Figure 1 for information on the legends and annotations.
Download figure:
Standard image High-resolution imageTable 2. Individual Burst Properties of Repeating CHIME/FRB Sources from the CHIME23 Sample
| TNS Names | Arrival Date | Arrival Time | S/N | DMstruct | ndown | 〈L/I〉 | RMFDF |
|---|---|---|---|---|---|---|---|
| (YYYY/MM/DD) | (MJD) | (pc cm−3) | (rad m−2) | ||||
| FRB 20171019A | |||||||
| 20200801C | 2020/08/01 | 59062.40088 | 18.2 | 455.0058(14) | 256 | 0.851(15) | −2.0(3) |
| FRB 20180910A | |||||||
| 20200621D | 2020/06/21 | 59021.04801 | 65.9 | 696.36(16) | 32 | 0.343(8) | −340.37(16) |
| FRB 20190110C | |||||||
| 20190110C | 2019/01/10 | 58493.71640 | 23.9 | 222.03(3) | 64 | 0.93(2) | +118.5(2) |
| FRB 20190430C | |||||||
| 20190430C | 2019/04/30 | 58603.49572 | 66.5 | 400.35(16) | 16 | 0.913(19) | −71.25(17) |
| FRB 20190609C | |||||||
| 20190609C | 2019/06/09 | 58643.81885 | 22.4 | 479.8612(5) | 2 | 0.9337(15) | −3.7(3) |
| 20201030B | 2020/10/30 | 59152.42714 | 58.0 | 479.7960(7) | 1 | 0.966(2) | −39.46(2) |
| 20210113D | 2021/01/13 | 59227.22623 | 6.3 | 479.6 | N/A | <0.55(18) | − |
| FRB 20190804E | |||||||
| 20200629C | 2020/06/29 | 59029.28288 | 23.5 | 362.77(4) | 256 | 0.435(2) | −200.75(14) |
| 20200709C | 2020/07/09 | 59039.25722 | 11.5 | 362.3 | 256 | 0.55(3) | −206.4(6) |
| 20201225B | 2020/12/25 | 59208.79707 | 27.3 | 362.724(5) | 1 | 0.991(12) | −202.53(15) |
| 20201228A | 2020/12/28 | 59211.78653 | 21.2 | 362.96(2) | 64 | 0.809(15) | −196.0(2) |
| 20220203A | 2022/02/03 | 59613.68909 | 8.7 | 362(13) | N/A | <0.51(12) | − |
| FRB 20190915D | |||||||
| 20200214B | 2020/02/14 | 58893.96581 | 22.1 | 487.6(3) | 256 | 0.274(12) | −170.3(4) |
| FRB 20191013D | |||||||
| 20200515A | 2020/05/15 | 58984.79805 | 24.3 | 522.6(3) | 256 | 0.357(13) | −35.7(2) |
| FRB 20191106C | |||||||
| 20201201A | 2020/12/01 | 59184.69025 | 41.9 | 330.6 | 256 | 0.172(5) | −263.3(2) |
| 20210212C | 2021/02/12 | 59257.48754 | 7.0 | 330.78 | N/A | <0.33(15) | − |
| 20210617A | 2021/06/17 | 59382.14621 | 38.5 | 330.6 | 256 | 0.209(2) | −468.5(2) |
| 20210822A | 2021/08/22 | 59448.96952 | 22.1 | 331.2 | 256 | <0.525(7) | − |
| 20211104B | 2021/11/04 | 59522.76580 | 28.0 | 331.60(16) | 256 | 0.186(9) | −921.8(3) |
| 20220118B | 2022/01/18 | 59597.56025 | 59.5 | 330.56(9) | 64 | 0.219(4) | −1044.43(17) |
| 20220514C | 2022/05/14 | 59713.24328 | 21.9 | 331.38(11) | N/A | <0.27(4) | − |
| FRB 20200118D | |||||||
| 20200118D | 2020/01/18 | 58866.30273 | 21.7 | 625.22(2) | 64 | 0.258(2) | +125.4(8) |
| 20200701A | 2020/07/01 | 59031.84983 | 40.8 | 625.28(2) | 16 | 0.696(13) | +132.6(3) |
| FRB 20200127B | |||||||
| 20200127B | 2020/01/27 | 58875.83372 | 70.3 | 351.3 | 2 | 0.703(10) | +39.32(5) |
| 20200219B | 2020/02/19 | 58898.76908 | 117.1 | 351.3 | 1 | 0.909(7) | +40.58(4) |
| FRB 20200202A | |||||||
| 20201014B | 2020/10/14 | 59136.34382 | 30.8 | 726.44(7) | 32 | 0.833(9) | +52.6(2) |
| 20230604B | 2023/06/04 | 60099.70443 | 40.5 | 734.3(2) | 16 | 0.230(9) | +61.5(10) |
| FRB 20200223B | |||||||
| 20200702C | 2020/07/02 | 59032.57511 | 163.9 | 200.354(10) | 8 | 0.182(2) | +70.4(4) |
| 20210115C | 2021/01/15 | 59229.04023 | 45.9 | 200.521(10) | N/A | <0.328(8) | − |
| FRB 20200619A | |||||||
| 20201022D | 2020/10/22 | 59144.00771 | 6.9 | 439(23) | N/A | <0.31(15) | − |
| 20210130E | 2021/01/30 | 59244.72817 | 10.0 | 440.2 | N/A | <0.21(10) | − |
| FRB 20200809E | |||||||
| 20200809E | 2020/08/09 | 59070.49237 | 23.7 | 1702.89(9) | 128 | 0.70(2) | −40.6(6) |
| 20201018C | 2020/10/18 | 59140.32924 | 21.2 | 1702.85(3) | 128 | 0.80(2) | −36.5(3) |
| 20210208B | 2021/02/08 | 59253.00241 | 14.6 | 1703.35(2) | 256 | 0.58(3) | −36.3(5) |
| FRB 20200926A | |||||||
| 20201223A | 2020/12/23 | 59206.86524 | 6.8 | 759.3 | N/A | <0.51(16) | − |
| 20211206A | 2021/12/06 | 59554.91389 | 4.0 | 759.4 | N/A | <0.86(5) | − |
| 20230725D | 2023/07/25 | 60150.27956 | 52.4 | 758.62(3) | 32 | 0.266(7) | +274.1(4) |
| FRB 20200929C | |||||||
| 20201125B | 2020/11/25 | 59178.20015 | 63.9 | 413.66(6) | 16 | 0.879(8) | −4.85(9) |
| 20201203C | 2020/12/03 | 59186.17777 | 20.0 | 413.54(3) | 128 | 0.65(2) | −8.4(4) |
| 20210313B | 2021/03/13 | 59286.90499 | 49.3 | 413.67(10) | 64 | 0.906(7) | +9.23(11) |
| 20210314A | 2021/03/14 | 59287.90333 | 26.1 | 413.54(17) | 128 | 0.897(16) | −1.55(19) |
| 20210326B | 2021/03/26 | 59299.86586 | 50.0 | 413.74(12) | 32 | 0.874(7) | +11.34(7) |
| 20210930A | 2021/09/30 | 59487.35525 | 30.0 | 413.43(19) | 256 | 0.531(8) | −42.37(13) |
| 20220209A | 2022/02/09 | 59619.99073 | 36.9 | 413.20(6) | 32 | 0.908(11) | −12.25(11) |
| FRB 20201114A | |||||||
| 20201219A | 2020/12/19 | 59202.70239 | 31.1 | 321.31(13) | 128 | 0.541(12) | +1348.7(3) |
| FRB 20201130A | |||||||
| 20201225D | 2020/12/25 | 59208.24932 | 26.7 | 287.6(5) | 256 | 0.475(13) | +183.62(16) |
| 20210114B | 2021/01/14 | 59228.19620 | 38.6 | 288.2(2) | 128 | 0.618(13) | +183.53(15) |
| 20210117E | 2021/01/17 | 59231.18612 | 7.4 | 287.82(10) | 256 | 0.46(2) | +188.9(6) |
| 20210118B | 2021/01/18 | 59232.18424 | 41.0 | 287.9(5) | 128 | 0.633(11) | +184.01(13) |
| 20210327F | 2021/03/27 | 59300.00032 | 39.7 | 287.67(11) | 256 | 0.430(11) | +182.94(16) |
| FRB 20201221B | |||||||
| 20210224A | 2021/02/24 | 59269.24936 | 4.1 | 510.0 | N/A | <0.6(2) | − |
| 20210302E | 2021/03/02 | 59275.24211 | 19.6 | 510.5 | 256 | 0.455(13) | −1.7(2) |
| 20210303F | 2021/03/03 | 59276.23157 | 38.2 | 509.71(14) | N/A | <0.155(8) | − |
Note. We include the TNS name, the topocentric times of arrival referenced at 400 MHz, the structure-optimized DM, the downsampling factor in time for the waterfall plots in Figures 1–4, the linear polarization fraction (L/I) integrated over the burst profile, as well as the observed RM from the FDF method (uncorrected for ionospheric or Milky Way contributions). Uncertainties are reported at the 1σ confidence level. The L/I upper limits for unpolarized bursts are indicated by “<” symbols and the corresponding unconstrained RMs are shown as “−.”
A machine-readable version of the table is available.
Download table as: Machine-readable (MRT)Typeset images: 1 2
Table 3. Updated Burst Properties of Repeating FRB Sources with Previously Published Polarization Information, with the Same Columns as Described in the Caption of Table 2
| TNS Names | Arrival Date | Arrival Time | S/N | DMstruct | ndown | 〈L/I〉 | RMFDF |
|---|---|---|---|---|---|---|---|
| (YYYY/MM/DD) | (MJD) | (pc cm−3) | (rad m−2) | ||||
| FRB 20180916B | |||||||
| 20220312A | 2022/03/12 | 59650.93438 | 15.0 | 348.51(10) | 64 | 0.64(2) | −54.1(23) |
| 20220328A | 2022/03/28 | 59666.89952 | 27.1 | 348.96(7) | 16 | 0.868(18) | −56.6(5) |
| 20220619B | 2022/06/19 | 59749.66674 | 56.3 | 348.986(11) | 2 | 0.945(6) | −53.30(12) |
| 20221215G | 2022/12/15 | 59928.17600 | 32.1 | 349.25(2) | 64 | 0.888(12) | −59.80(17) |
| 20230510G | 2023/05/10 | 60074.77908 | 45.4 | 348.95(12) | 64 | 0.834(9) | −54.49(7) |
| 20231108A | 2023/11/08 | 60256.29047 | 21.9 | 348.89(2) | 32 | 0.716(19) | −53.8(3) |
| 20231123D | 2023/11/23 | 60271.24684 | 9.4 | 349.44(6) | 256 | 0.74(3) | −51.8(4) |
| 20231210E | 2023/12/10 | 60288.18768 | 62.1 | 349.4 | 32 | 0.866(7) | −57.94(11) |
| 20240228A | 2024/02/28 | 60368.98383 | 15.1 | 349.11(18) | 256 | 0.81(2) | −52.2(2) |
| 20240520A | 2024/05/20 | 60450.74919 | 69.7 | 349.02(8) | 16 | 0.968(6) | −56.14(6) |
| FRB 20181119A | |||||||
| 20210608B | 2021/06/08 | 59373.14569301 | 13.8 | 364.939(15) | 256 | 0.274(14) | +355.2(11) |
| FRB 20190117A | |||||||
| 20211114A | 2021/11/14 | 59532.10691 | 9.9 | 395.89(4) | 256 | 0.476(19) | +28.9(2) |
| FRB 20190208A | |||||||
| 20230306D | 2023/03/06 | 60009.66716 | 8.5 | 579.81(18) | 256 | 0.460(18) | +26.3(10) |
| FRB 20190303A | |||||||
| 20230913E | 2023/09/13 | 60200.93406 | 47.8 | 221.48(6) | 16 | 0.805(7) | +371.7(3) |
| 20231204A | 2023/12/04 | 60282.70886 | 67.0 | 221.24(3) | 32 | 0.490(14) | +287.8(2) |
| FRB 20190604A | |||||||
| 20210329A | 2021/03/29 | 59302.42051 | 11.0 | 552.4(5) | 256 | 0.37(2) | −14.6(4) |
| FRB 20200120E | |||||||
| 20200120E | 2020/01/20 | 58868.41500 | 17.0 | 87.85(10) | 64 | 0.95(2) | −29.8(2) |
| 20210423G | 2021/04/23 | 59327.15873 | 70.1 | 87.760(10) | 1 | 0.993(7) | −28.78(14) |
| 20231001A | 2023/10/01 | 60218.72630 | 42.0 | 87.7 | 8 | 0.75(2) | −24.45(13) |
| FRB 20201124A | |||||||
| 20210327A | 2021/03/27 | 59300.03220 | 30.8 | 416.5 | 256 | 0.263(9) | −543.6(3) |
| 20210331A | 2021/03/31 | 59304.02299 | 25.6 | 416.2 | 256 | 0.439(9) | −576.3(3) |
| 20210526D | 2021/05/26 | 59360.86503 | 87.2 | 410.8 | 64 | 0.266(2) | −602.01(5) |
A machine-readable version of the table is available.
Download table as: Machine-readable (MRT)Typeset image
Some bursts appear unpolarized despite semicoherent RM searches up to ∣106∣ rad m−2. As concluded by R. Mckinven et al. (2023a), for repeaters with multiple bursts, it is likely that some events (typically also the ones with lower S/N) appear unpolarized because the polarized signal from those bursts is below the limits of our sensitivity. For these unpolarized bursts, we use the total intensity burst S/N to calculate the L/I that would be required to produce a polarization detection at S/N = 5. This value is used as a conservative upper limit on L/I in Table 2. Finally, the last columns in Tables 2 and 3 contain the observed RM values derived from the FDF method described in Section 2. These values are not corrected for ionospheric and Milky Way contributions.
Figures 1–4 are the frequency versus time waterfall plots for the 63 bursts that have well-constrained RM values. In the top two panels (L/I, ∣V∣/I, and PA profiles) for each burst, only data points with S/N limits on L of >5 are shown. Some faint FRBs with low linear polarization thus can have very few (or no) points on their profiles. As explained by R. Mckinven et al. (2023b), the PA curves are not calibrated for absolute angles and should only be used to study the relative evolution across the profile. For the circular polarization measurements, even though a first-order correction has been included to account for the instrumental effect of nonzero cable delay, there remain secondary effects (e.g., due to the frequency-dependent beam phase) that still result in residual instrumental circular polarization that could be of the order of ∣V∣/I ∼ 20%. Hence, the information on circular polarization shown in Figures 1–4 represents only the relative changes and is not absolutely calibrated.
3.1. Individual Repeaters
FRB 20180916B. A periodic (∼16.35 days) activity window was found for this FRB (CHIME/FRB Collaboration et al. 2020). R. Mckinven et al. (2023a) have reported temporal RM variations that are unrelated to the 16.35 days cycle, showing stochastic behavior between 2019 January and 2021 January, and then a secular increase until early 2022. In our extended data set of FRB 20180916B taken between 2022 January and 2024 May, CHIME recorded 26 baseband events, of which significant polarization measurements can be obtained for 10 events that are bright enough, as listed in Table 3. From these, we report that the RM of FRB 20180916B once again shows a stochastic trend through to mid-2024 (Figure 5). A similar trend was reported by S. Bethapudi et al. (2025) during the preparation of this work.
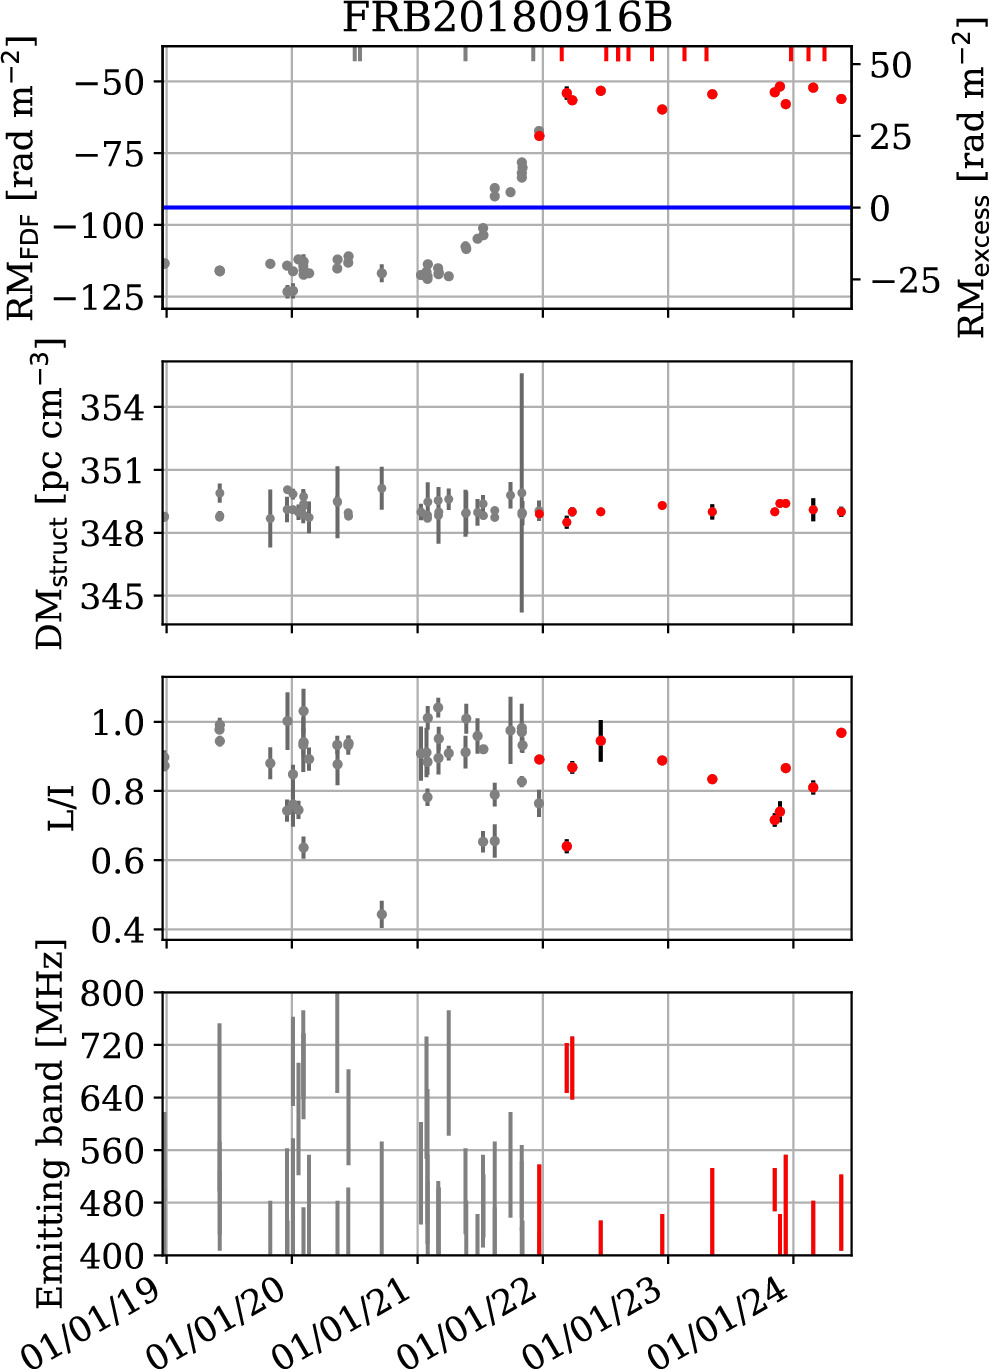
Figure 5. Burst properties (RMFDF, DMstruct, L/I, and emission bandwidth) as a function of time for FRB 20180916B. The gray points correspond to data previously published by R. Mckinven et al. (2023a), whereas the red ones are new results from this work. The small ticks on the top of the top panel show epochs when baseband data were recorded but no significant polarization measurements were detected. Error bars correspond to 1σ for the RM and L/I panels and 3σ for the DM panel.
Download figure:
Standard image High-resolution imageThis temporal variation pattern does not support the long-orbit binary models proposed by F. Y. Wang et al. (2022), Z. Y. Zhao et al. (2023), and H.-T. Lan et al. (2024) being the reason for this observed polarization fluctuation, particularly since no clear RM sign change nor turning point is seen during the five years of observations, which argues against a potential magnetic field reversal caused by the orbital motion of the binary star along the line of sight. However, this does not preclude FRB 20180916B from being in a binary system. We note that the expected Galactic RM contribution at the position of FRB 20180916B is quite uncertain, with RMMW = −94 ± 45 rad m−2. If the true Galactic contribution is <−59 rad m−2, then our latest observations would indicate an RM sign change happened in 2022. This may or may not indicate a magnetic field reversal. The ambiguity is due to the fact that we cannot distinguish the fractional RM contribution from the host ISM.
We see no correlation between the RM variation and other burst parameters, namely emission bandwidth, L/I, and DM. Note that the emitting bandwidth shown in Figure 5 represents a by-eye estimation of the portion of the 400–800 MHz CHIME band over which emission is observed, uncorrected for the nonuniform bandpass of the instrument. The emission bandwidth appears to drift to lower frequencies in more recent observations, as was already noted by R. Mckinven et al. (2023b), although correlated changes are not observed in the other parameters. Figure 6 shows L/I versus fluence for the bursts we have detected from FRB 20180916B. We do not see any obvious correlation between the two parameters, with a Spearman correlation coefficient p-value of 0.07. There is perhaps a wider spread of L/I values at the higher fluence end, which is likely due to the fact that it is easier to detect weakly polarized signals in brighter events.
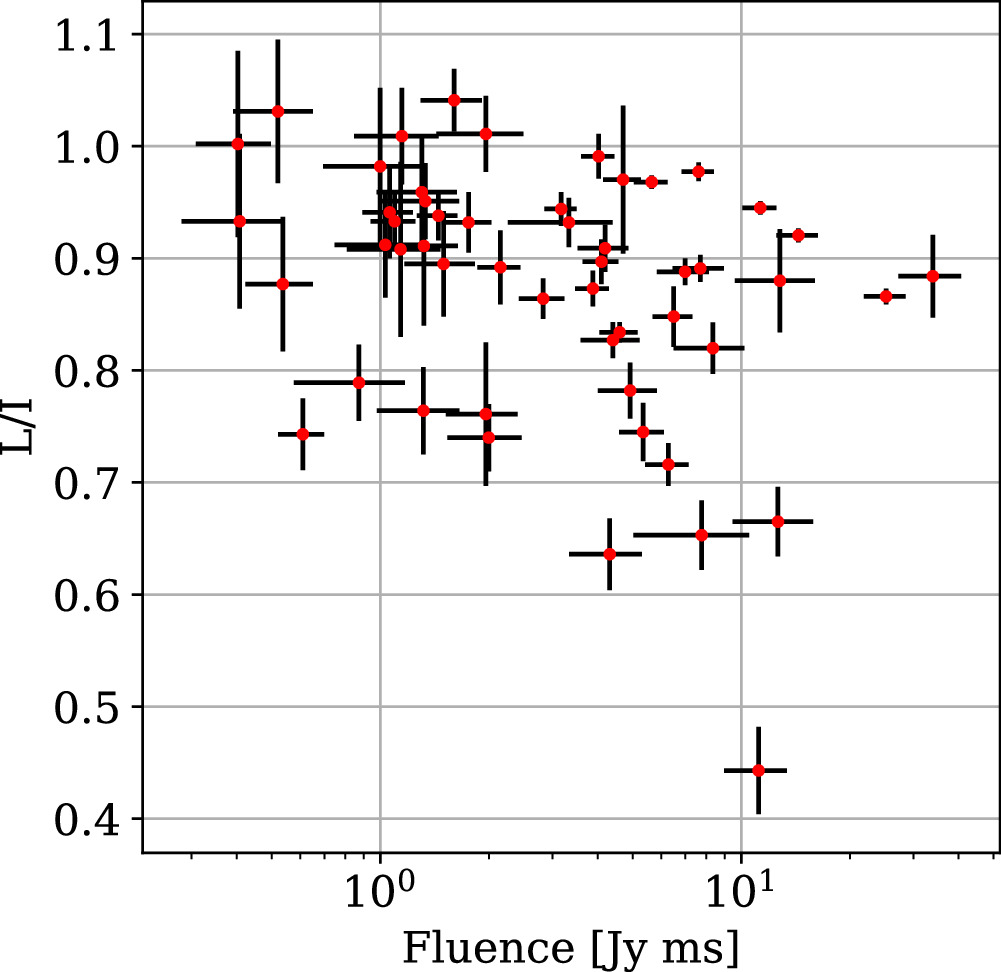
Figure 6. L/I vs. fluence for FRB 20180916B. Statistically these two parameters are uncorrelated, with a Spearman coefficient p-value of 0.07.
Download figure:
Standard image High-resolution imageFRB 20181119A. Three baseband polarization measurements (RMs of +606.2(1.2), +1343(2), and +480.9(5) rad m−2) from FRB 20181119A have already been published by R. Mckinven et al. (2023b). In this paper, we include a fourth event (RM of +355.2(11) rad m−2) during the time period 2020 June–2021 June. The RMs vary by hundreds of units during this period. The cable delay for some of these events is quite large (∼19 ns), which introduced some uncertainty in the signs of the RMs, although the positive RM fits showed slightly higher likelihood.
FRB 20190117A. Eight baseband events were recorded between 2019 June and 2023 May. Only one burst with significant RM detection is shown in Table 3, while the remaining bursts have no constraining measurements, likely due to low S/N.
FRB 20190303A. This FRB has been localized to a merging galaxy pair (D. Michilli et al. 2023). Five baseband events were recorded between 2021 June and 2023 September. Only two bursts with significant RM detections are shown in Table 3. Comparing these new measurements to the ones published by R. Mckinven et al. (2023a) (see the left column in Figure 7), FRB 20190303A shows a secular temporal RM trend where the RM values increase by several hundreds of units. Given that the Galactic RM contribution at this position is +21 ± 5 rad m−2, we can be certain that a sign change (from negative to positive) of the RM took place between 2022 and 2023.
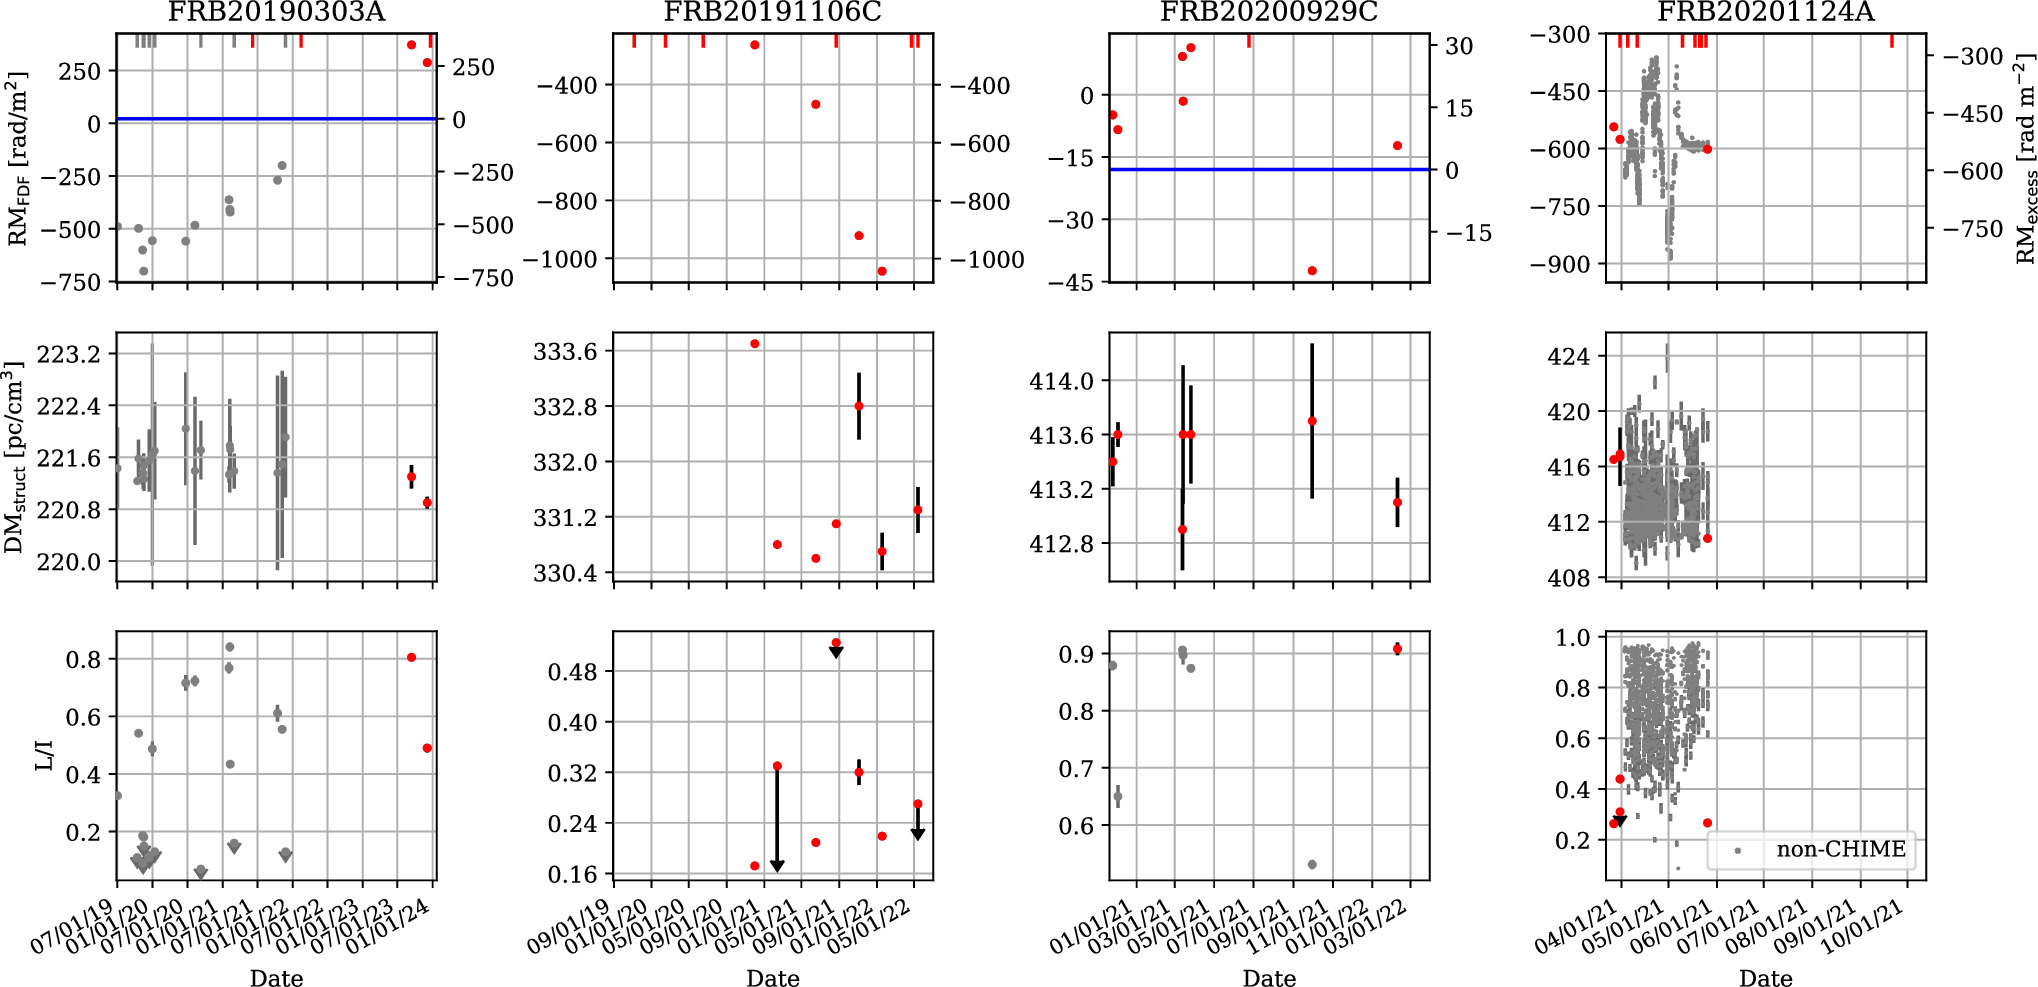
Figure 7. Burst properties (RMFDF, DMstruct, and L/I) as a function of time for (far left) FRB 20190303A, (left) FRB 20191106C, (right) FRB 20200929C, and (far right) FRB 20201124A. The gray points are data from the literature, including measurements from R. Mckinven et al. (2023a), P. Kumar et al. (2022), G. H. Hilmarsson et al. (2021), and H. Xu et al. (2022). Red points are new results from this paper. The error bars represent the 1σ uncertainty range in the RM and L/I panels and the 3σ uncertainty range in the DM panels. Downwards arrows in the L/I panels indicate upper limits. The times of arrival of the bursts with unconstrained RM are indicated as small ticks on the top of the top panels. The blue horizontal lines in the top panels indicate the level RM = 0 rad m−2 for the two FRBs with RM sign change.
Download figure:
Standard image High-resolution imageFRB 20191106C. This is a relatively active repeater with 11 baseband events between 2019 November and 2022 May. Four events were not recorded properly, hence only seven are presented in Table 2 and Figure 7. There are significant RM variations of several hundred RM units, showing a clear secular trend. There is a low level of linear polarization (red line) in all available waterfalls.
FRB 20200120E. This is the FRB in a globular cluster associated with the galaxy M81 (M. Bhardwaj et al. 2021; F. Kirsten et al. 2022). We have eight events with baseband data recorded between 2022 January and 2023 October. Only three bursts with significant RM detections are shown in Table 3. One of these was previously announced by M. Bhardwaj et al. (2021) but not with complete polarization information. We note that the RMs of this source do not vary a lot (σ(RM) = 2.0 rad m−2) throughout the few years of data we have, which is consistent with the expectation from the sparse ISM environment of a globular cluster.
FRB 20200929C. All seven bursts from this repeater have low ∣RM∣ values, although given the relatively high L/I fraction, the detected RM is unlikely to be (purely) instrumental. Given that the Galactic RM contribution at this position is −18 ± 3 rad m−2, we can say that there are at least two RM sign changes in the corrected, extragalactic RM component between 2020 November and 2022 February (see third column in Figure 7).
FRB 20201124A. 15 events with baseband data were recorded for this repeater between 2021 March and September. Some of these events were described by A. E. Lanman et al. (2022) although polarization information was not included. Only the three bursts with significant RM detections are shown in Table 3. CHIME/FRB has not detected this repeater after 2021 September despite regular operations, but if we combine the CHIME/FRB measurements with those in the literature (G. H. Hilmarsson et al. 2021; P. Kumar et al. 2022; H. Xu et al. 2022), we see that the CHIME/FRB measurements are consistent with those of the other telescopes, showing secular temporal variations where the RMs fluctuate for hundreds of units (see right column of Figure 7). The CHIME/FRB data seem to have a lower L/I than data from the other telescopes, which might be because these other facilities observe at higher frequency than CHIME/FRB and their data suffer less Faraday depolarization. We also note that burst #3 (TNS name 20210526D) shows possibly varying L/I as a function of time during the burst (last panel in Figure 4).
FRB 20201130A. Six baseband events were recorded between 2020 December and 2021 March, although one of them was not saved properly and thus cannot be analyzed. The RM of this source is stable at around 180–190 rad m−2 within this period. A range of morphologies was observed. All five events shown in Figure 1 have a high degree of linear polarization (red line).
4. Discussion
In this work, we have presented a polarization analysis of 75 bursts from 28 repeating FRB sources, of which 63 bursts have significant RM and L/I measurements. At the time of writing, combining these new results with those in the literature, there is a total of 26 repeating FRBs that have more than one RM measurement, and we can see the RM versus time plot of all these sources in Figure 8 and in Figure 12 in the Appendix. From our results alone, we do not see bursts with extreme RM magnitudes, with the highest ∣RM∣ value being 1348.7(3) rad m−2 from FRB 20201114A.
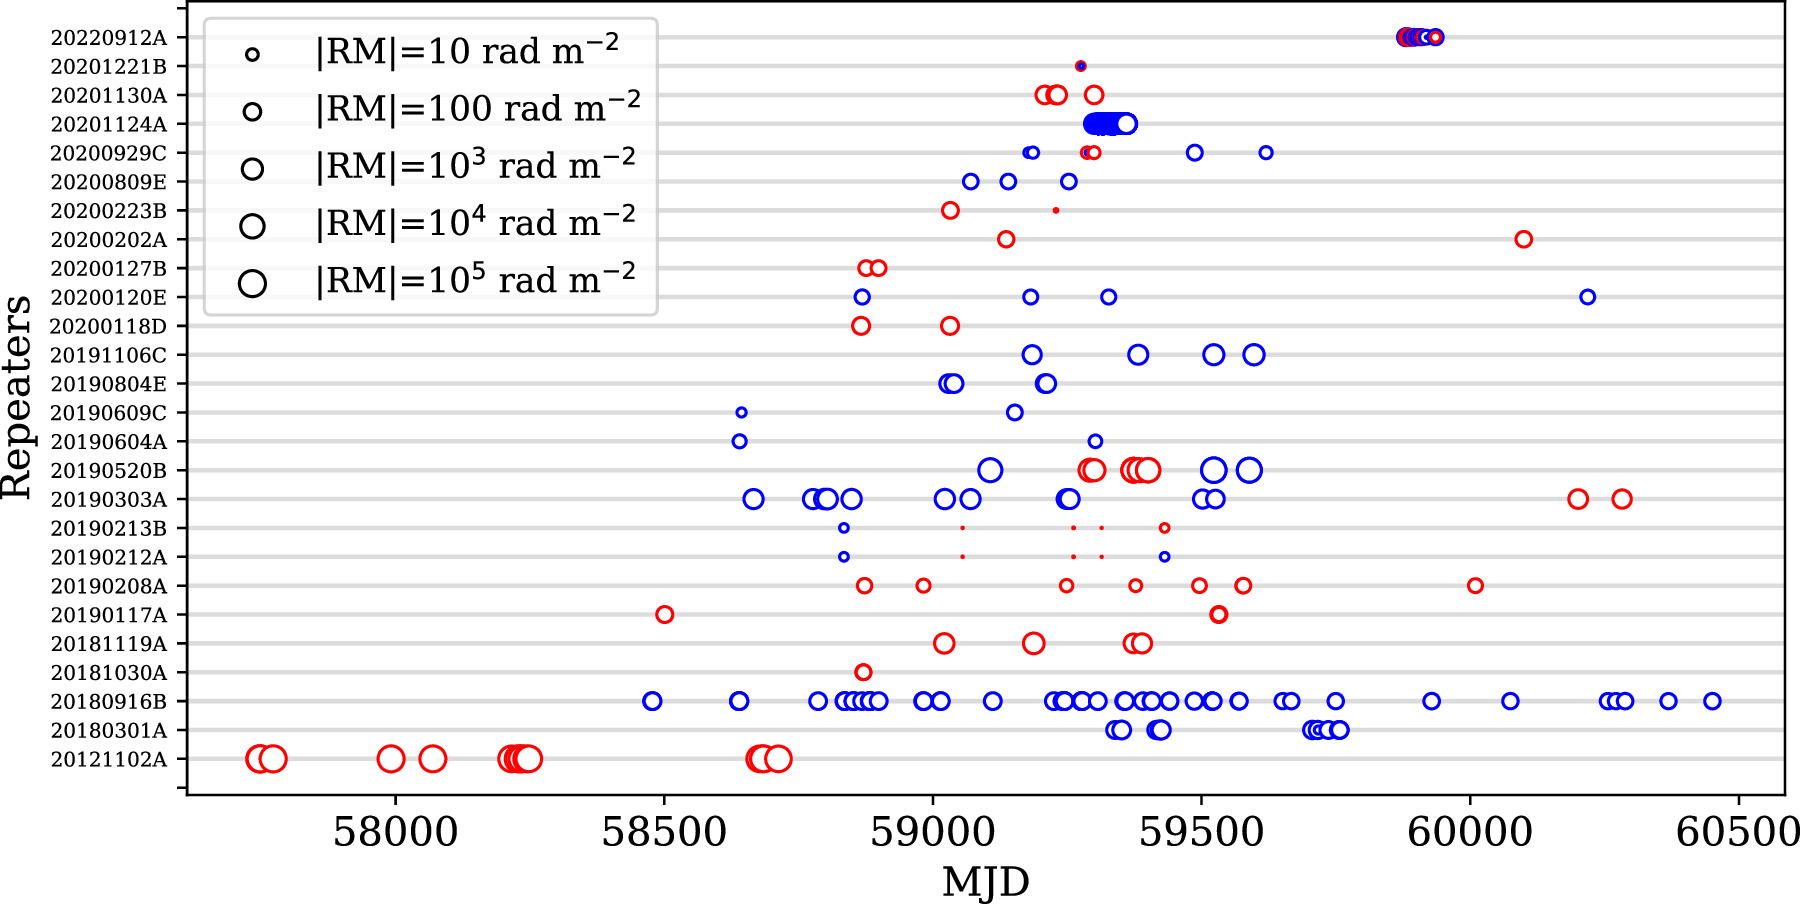
Figure 8. Temporal RM variations for 26 repeating FRBs with more than one RM. The size of the circles is proportional to the magnitude of the RM values, whereas red color indicates positive RMs and blue negative RMs.
Download figure:
Standard image High-resolution imageSimilar to previous findings (see, e.g., R. Mckinven et al. 2023a), we do not observe correlated variations in DM, L/I or any other parameters that resemble the RM trends. The L/I measurement distribution is largely consistent with that previously reported by R. Mckinven et al. (2023a), showing a wide range of values that suggest significant intrinsic variations per repeater source.
We observe some variations in the PA as a function of time during the burst, but these are typically small fluctuations of less than 30°. There are no events that show a significant S-swing in the PA profile, like the one reported by R. Mckinven et al. (2024).
4.1. Temporal RM Variations
We further study the RM distribution of all 26 repeaters with more than one RM value. In Figure 9, we compare the standard deviation of the RM excess (observed RMFDF – RMMW) with the maximum time span of measurements (the time of the newest data point minus the oldest), as well as the averaged RM excess magnitudes. From the left panel, we can see that the majority of these repeaters have at least one year of data, albeit with varying degrees of cadence (refer to Figure 8). RM measurements taken on short time spans are likely probing the same Faraday active media, whereas RM measurements taken a long time apart could give insights into Faraday active media of much larger physical sizes. Intuitively, we would expect RMs taken near in time to show small variations (σ(RM)), whereas larger RM variations could be expected over longer periods of time. This is mostly consistent with what the left panel is showing. However, we do see that a number of FRB repeaters have small RM variations of a few tens of units irrespective of the time span (bottom half of the plot area). These are likely the repeaters associated with stochastic RM variations, and the observed behavior suggests a uniform environment with limited turbulence. On the top half of the plot area, a number of exceptions show much higher levels of RM variations. This division is perhaps more apparent from the right panel of Figure 9, where these repeaters seem to separate into two categories. Those to the right of the dotted line, with a low ratio of σ(RM)/ , likely come from stable magnetoionic environments. On the other side (to the left of the dotted line), these sources have a high ratio of σ(RM)/
 and likely reside in dynamic RM environments. The cases of FRBs 20190520B, 20121102A, 20181119A, 20190303A, and 20201124A have already been discussed in the literature (D. Michilli et al. 2018; R. Luo et al. 2020; R. Anna-Thomas et al. 2023; R. Mckinven et al. 2023a). This work adds FRB 20191106C to this subgroup of FRBs with high
  , which are thought to reside in dynamic RM environments, where the extreme circumburst environment contributes to the high-level RM variations. It is also remarkable that the top boundary of the trend in the right panel is very close to a 1–1 relation between σ(RM) and
  . This is additional evidence that for these repeaters in dynamic RM environments, the majority of the RM variations are likely due to contributions from the local environment (which we expect to vary in time), instead of from the ISM of the host galaxy (which we expect to be stable with time). We could also conclude that the sources located close to the 1–1 relation must have a low fractional contribution from the ISM of the host galaxy to the RM temporal variation, as the majority of the temporal variations are already accounted for by the evolving environment near the FRB source.
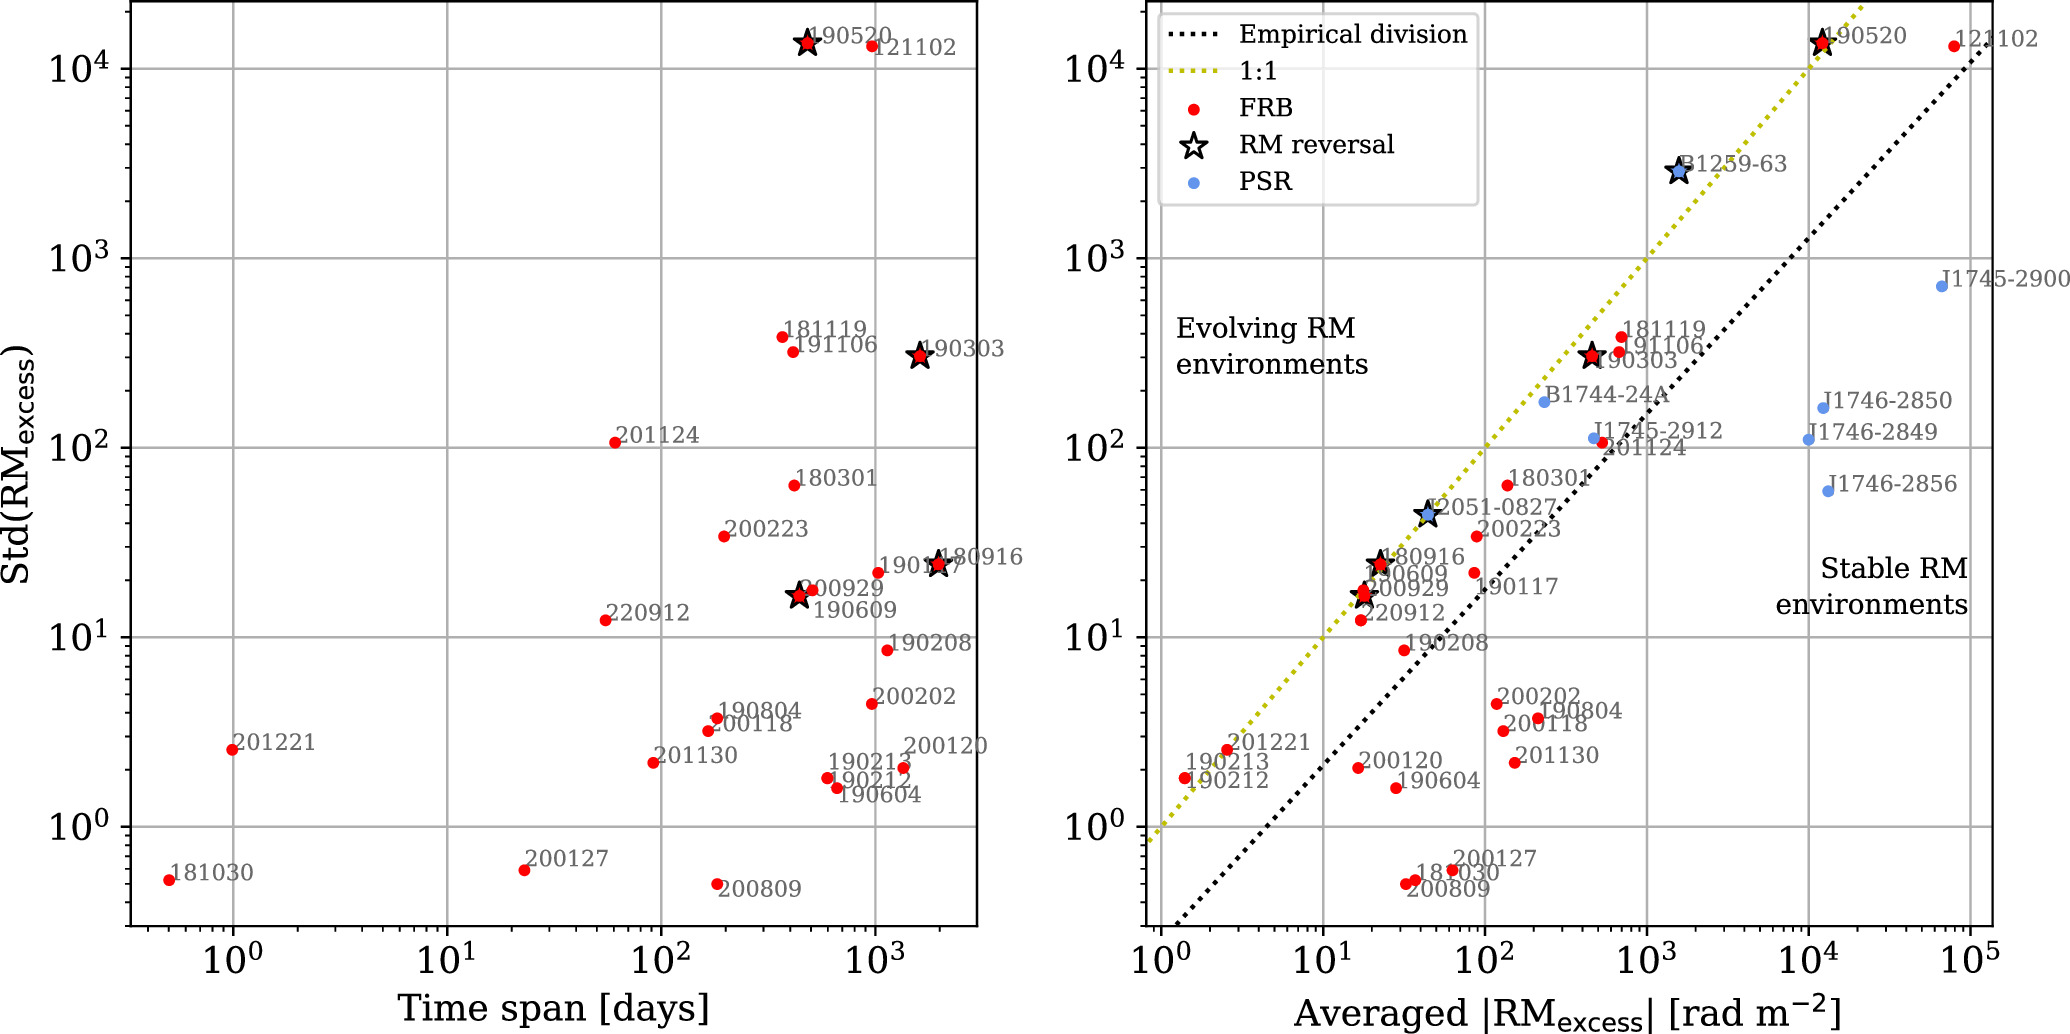
Figure 9. Left: standard deviation of RM excess vs. variability timescale (maximum time span of available data) for all repeating FRBs (red dots) with more than one RM measurement. Right: standard deviation of RM vs. the averaged magnitude of RM excess. A few notable pulsar systems with peculiar RM properties are included as blue dots. Sources that exhibit an RM sign change are represented by stars. The yellow dotted line indicates a 1:1 ratio of σ(RM)/ , whereas the black dotted line is an empirical division of the two types of RM environments.
Download figure:
Standard image High-resolution imageIn general, practically all FRB repeaters demonstrate temporal RM variations that have larger amplitudes than those found for Galactic pulsars, which are typically no more than a few rad m−2 (H. M. Wahl et al. 2022). There are certain pulsar systems that show a comparably high magnitude of RM variations (see right panel of Figure 9). Examples include pulsars near the Galactic center close to Sagittarius A* (e.g., PSRs J1745−2900, J1746−2849, J1746−2850, J1746−2856, and J1745−2912; G. Desvignes et al. 2018; F. Abbate et al. 2023), “windy”25
pulsar binaries (e.g., PSRs J2051−0827 and B1259−63; T. W. Connors et al. 2002; S. Q. Wang et al. 2023), and a redback26
system (PSR B1744−24A; D. Li et al. 2023). The FRB repeaters from evolving RM environments appear to agree quite well with the pulsars from (eclipsing) binary systems, but not so well with the solitary ones near the Galactic center. Given the similarities, it might be suggestive to say that coronal winds from a binary stellar companion are a potential explanation of the circumburst environments of these FRB systems with a high ratio of σ(RM)/ , and that these repeating FRBs probably did not come from the Galactic center of their host galaxies, assuming similar host ISM properties to our Milky Way. This is indeed the case for the three high-σ(RM)/
 sources that have localizations from very long baseline interferometry, namely FRB 20190520B at 5 kpc from the center of its host galaxy (C. H. Niu et al. 2022), FRB 20180916B with a 4.7 kpc offset (B. Marcote et al. 2020), and FRB 20220912A with a 0.8 kpc offset (D. M. Hewitt et al. 2024). In addition, in the cases of the Galactic center pulsars, large variations in DM were also reported (F. Abbate et al. 2023), which is not the case for the FRB repeaters.
Beyond stochastic variations, some sources show deterministic trends that are not captured in Figure 9 and that can cause an overestimation of stochastic variation. To investigate this, we have defined four simple empirical models for the RM evolution: (1) a constant RM (one parameter), (2) a linear trend (one parameter), (3) a model with constant RM episodes connected by a linear trend (four parameters, motivated by FRB 20180916B), and (4) a periodic model (four parameters, motivated by FRB 20190520B). We have used least-squares fitting to fit all four models to the 19 sources with more than two RM measurements and selected the best-fit model using the Akaike information criterion (see Section 2.4 in K. Burnham & D. Anderson 2002), modified for small sample sizes.
In this framework, 12 FRBs are best fit by a constant RM. FRBs 20180301A and 20191106C are best fit by a linear trend with slopes of 0.24 and −2.0 rad m−2 day−1 over ≥418 and ≥413 days, respectively. FRBs 20121102A, 20180916B, and 20190303A are best fit by a model with constant episodes connected by a linear trend with slopes of −90, 0.19, and 0.72 rad m−2 day−1 over 378, 323, and ≥1275 days, respectively. FRB 20190520B is best fit by a periodic model with a period of 350 days (note that this does not imply it is in an orbit) and FRB 20201124A shows too much temporal variation to produce a meaningful fit using these four simple models.
Indeed, the standard deviation of the residual RM after removing the best-fit models goes down and all sources show stochastic changes σ(RM) ≲ 80 rad m−2, except for FRBs 20121102A, 20181119A, and 20190520B, which still show σ(RM)  rad m−2. Interestingly, the five best-fit linear trends normalized by the median RM of the respective sources all fall within 0.1%–0.3% day−1. The time evolution could be further quantified using correlation or structure functions, but we defer this investigation to future work.
4.2. RM Sign Change27
In this work, we report the change of signs in RMs for two FRBs, namely FRBs 20200929C and 20190303A. Together with one other previously published case of FRB 20190520B (R. Anna-Thomas et al. 2023), there are now three examples (see red star symbols in Figure 9) in this subgroup. A possible fourth source is FRB 20180916B (see Figure 5), whose low Galactic latitude of 3 7 implies high uncertainty in its Milky Way RM contributions (RMMW = −94 ± 45 rad m−2), which may or may not indicate that the RM variations we see in FRB 20180916B fluctuate around zero. We note that these sources have the highest ratios of σ(RM)/
 , which are all very close to 1:1 (yellow line), occupying the further left region in the right panel of Figure 9.
This subsample of FRB repeaters with RM sign changes is a stark contrast to the Galactic pulsar population, where out of the over 3000 known pulsars, an RM sign change has only been reported in two systems with windy binaries, namely the black widow binary PSR J2051−0827 (S. Q. Wang et al. 2023) and the binary system PSR B1259−63, which has a Be-star companion (T. W. Connors et al. 2002; S. Johnston et al. 2005). In both pulsar systems, the RM sign change is attributed to the change in magnetic field strength along the line of sight due to binary orbital motions, and indeed the RM temporal variations of these two pulsar systems show orbital modulations that match the orbital periods. The fact that RM sign changes have not been seen more commonly in other windy pulsar binaries might be mostly due to the detection limit of the telescope. D. Li et al. (2023) have shown that RM changes of thousands of rad m−2 can take place rapidly in these binary systems, and so depolarization could occur in these pulsar observations where an integration time of tens of seconds was typically used. In contrast, this is less of a problem for the much brighter FRB signals where the RM can be measured from each individual burst. Nonetheless, the four repeating FRBs with RM sign changes do not (yet) show any orbital modulations in their RM variations that resemble those observed in the windy pulsars. Further monitoring of the RM variations of these four repeaters would be insightful in understanding any potential relationship between them and the pulsar systems.
4.3. Comparing Repeaters and Nonrepeaters
Recently, A. Pandhi et al. (2024) compared the polarization properties of 118 nonrepeating FRBs (89 polarized and 29 unpolarized) to 13 repeating sources. They find that the linear polarization fractions and rotation measure distributions of repeaters and nonrepeaters are consistent with being drawn from the same population; however, they present only marginal evidence for repeaters originating from more magnetized environments. In this section, we update their analysis comparing repeaters and nonrepeaters by adding the 75 bursts from 28 repeating FRBs presented in this work. For brevity, we do not detail the full methodology and statistical techniques involved; instead, we refer the reader to A. Pandhi et al. (2024) for this information.
In the top panel of Figure 10, we show the cumulative distribution function (CDF) of the linear polarization fraction for repeaters in blue and nonrepeaters in red. The CDF for nonrepeating sources is computed using the Kaplan–Meier method (E. L. Kaplan & P. Meier 1958), which also accounts for upper limits on L/I for unpolarized bursts, and the red shaded region is the 95% confidence interval. The blue shaded region shows the full range of L/I measurements across bursts for each repeating source. The middle panel of Figure 10 shows the CDFs for the RM with the Milky Way foreground subtracted (∣RMEG∣) for repeaters and nonrepeaters, respectively. Finally, the bottom panel of Figure 10 depicts the CDFs for the observer-frame lower limit on the average line-of-sight amplitude of magnetic field strength (∣β∣), where  and DMEG is the extragalactic component in the DM.
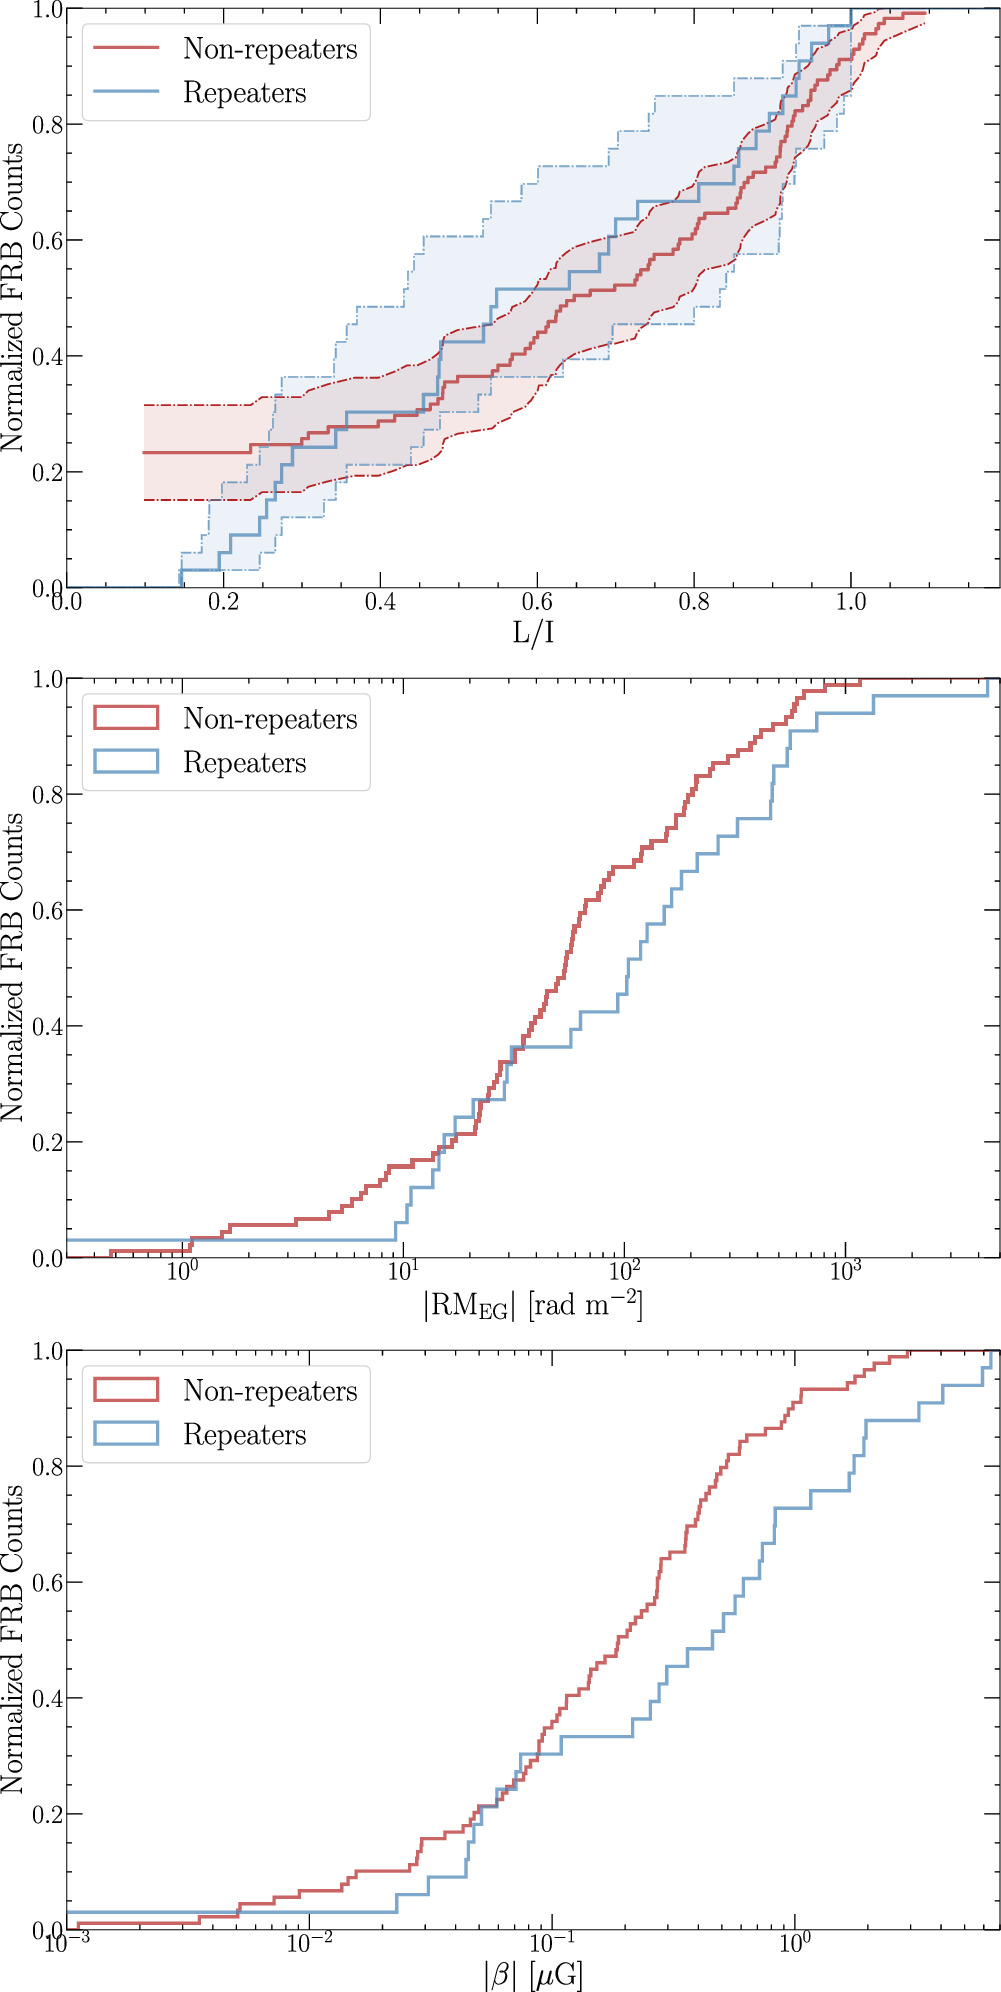
Figure 10. Comparison of the polarization properties of repeaters (in blue; M. Bhardwaj et al. 2021; R. Mckinven et al. 2023a; and this work) and nonrepeaters (in red; A. Pandhi et al. 2024) observed by CHIME/FRB. The panels, from top to bottom, show the CDF of L/I (including upper limits for the unpolarized nonrepeaters), the magnitude of the foreground-subtracted rotation measure ∣RMEG∣, and the observer-frame lower limit of the line-of-sight magnetic field strength ∣β∣.
Download figure:
Standard image High-resolution imageApplying the Kolmogorov–Smirnov (KS; N. Smirnov 1948; A. Kolmogorov 1956) and Anderson–Darling (AD; T. Anderson & D. Darling 1954) tests to each pair of CDFs presented in Figure 10, we find no evidence for a dichotomy between repeating and nonrepeating FRBs in terms of their L/I using Kendall’s τ test (M. G. Kendall 1938) or their ∣RMEG∣ using the KS and AD tests. We find marginal evidence for a dichotomy in the repeater and nonrepeater ∣β∣ distributions (with p values of 0.033 and 0.015 with the KS and AD tests, respectively), consistent with the results from A. Pandhi et al. (2024), who used a smaller sample of repeating FRBs.
To test whether the DMs and RMs in our FRBs originate from the same type of media along the line of sight, we analyze the correlation between the RM with the Milky Way foreground subtracted (∣RMEG∣) and the foreground-subtracted DM (DMEG). A plot of ∣RMEG∣ versus DMEG for all CHIME/FRB observed repeaters and nonrepeaters with polarimetric measurements to date, including the 28 repeating sources in this paper, is presented in Figure 11. Mirroring the analysis by A. Pandhi et al. (2024), we use Spearman’s rank correlation coefficient test (C. Spearman 1904) to gauge the extent of a possible correlation between  and
and  in our expanded repeater data set. We find a Spearman rank p-value of 0.804 (i.e., no statistical significance) when evaluating the
  correlation across all polarized repeating FRBs detected with CHIME/FRB. We note that in the literature, A. Pandhi et al. (2024) also find no correlation for repeaters but they did find a marginal correlation between DMEG and ∣RMEG∣ in their nonrepeating FRB samples. Meanwhile, M. B. Sherman et al. (2023) point to a correlation in RMhost versus DMhost for both repeaters and nonrepeaters in their sample of localized FRBs where redshift information is available and so the host contributions to RM and DM are estimated separately.
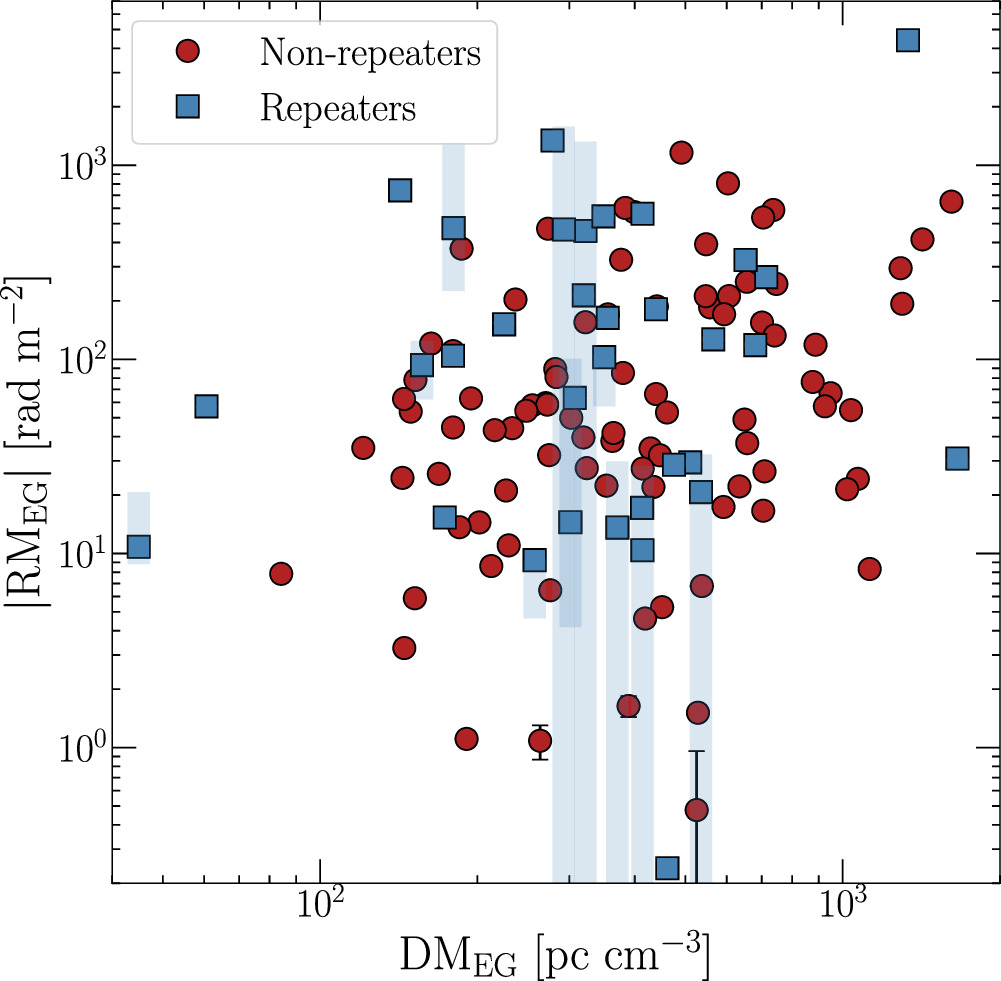
Figure 11. The foreground-subtracted ∣RMEG∣ plotted as a function of the foreground-subtracted DM, DMEG for all CHIME/FRB repeating (blue squares) and nonrepeating (red circles) FRBs. Measurement uncertainties are plotted as black error bars and blue shaded regions represent the intrinsic variability across repeat bursts for each repeating source.
Download figure:
Standard image High-resolution imageOne possible explanation for the lack of a  correlation in repeating FRBs, and for the marginal dichotomy in ∣β∣, is that the media contributing the bulk of the RM may be distinct from the media primarily contributing to the DM for repeating FRBs. As suggested by A. Pandhi et al. (2024), repeating FRBs might be embedded in more strongly magnetized local environments (which contribute significantly more to the total RM than to the total DM) than nonrepeating FRBs. In addition, the lack of redshift information (and hence a lack of precise knowledge of the host and local environment) for the FRBs in the samples used in this study may also contribute to the lack of observed correlation.
We note that in this analysis, we have restricted the comparison to CHIME/FRB-detected bursts only in order to limit bias due to the instrumental properties of different telescopes. This means that our sample does not include some of the repeaters with the highest σ(RM)/ ratios (e.g., FRBs 20190520B and 20121102A, and only very few bursts from FRB 20201124A). Intrachannel depolarization could be a reason why CHIME/FRB is less likely to detect high-σ(RM)/
 sources than telescopes that operate at higher observing frequencies (e.g., FAST and ASKAP). Another possible reason why CHIME/FRB might not have detected these sources is scattering, although based on the scattering measurements from A. P. Curtin et al. (2024), we do not observe any correlation between σ(RM)/
 and the scattering timescale among the events presented in this paper. As suggested in Section 4.1, if indeed there are two categories of magnetoionic environments and if the high-σ(RM)/
 repeaters are primarily the ones from more dynamic environments, the actual ∣β∣ and DM–RM dichotomy between nonrepeaters and repeaters might have been more significant.
5. Conclusion
We have presented a total of 75 bursts from 28 repeating FRB sources recorded between 2019 January and 2024 May, including 63 new polarization measurements. We present RM values ranging from −1044 to +1348 rad m−2, along with a wide range of L/I from less than 0.2 to almost 1, while PA variations are typically small and no bursts in this paper exhibit a clear S-swing in the PA profile. We observe temporal RM variations that are higher than those associated with Galactic pulsars, consistent with previous findings. Repeating FRBs appear to separate into two categories of dynamic versus stable RM environments that are differentiated by the ratios of σ(RM)/ . FRB 20191106C shows high-level RM changes (hundreds of rad m−2 on timescales of months) that could potentially point to dynamic magnetoionic environments, similar to the cases of FRBs 20190520B, 20121102A, 20181119A, 20190303A, and 20201124A. From the last five years of observations of FRB 20180918B, we witness the RM variations change from stochastic to secular and back to stochastic, with no turning point that could suggest an orbital effect from a binary system, although we do not exclude the possibility that FRB 20180916B is in a binary. We highlight two more repeaters with changes in RM sign that imply a change in magnetic field sign along those lines of sight. Finally, we present an updated comparison of polarization properties between repeaters and nonrepeaters, and our results show only marginal dichotomy in the distribution of magnetic field strength between the two groups, consistent with the findings of A. Pandhi et al. (2024).
Acknowledgments
We acknowledge that CHIME is located on the traditional, ancestral, and unceded territory of the Syilx/Okanagan people. We are grateful to the staff of the Dominion Radio Astrophysical Observatory, which is operated by the National Research Council of Canada. CHIME is funded by a grant from the Canada Foundation for Innovation (CFI) 2012 Leading Edge Fund (Project 31170) and by contributions from the provinces of British Columbia, Québec and Ontario. The CHIME/FRB Project is funded by a grant from the CFI 2015 Innovation Fund (Project 33213) and by contributions from the provinces of British Columbia and Québec, and by the Dunlap Institute for Astronomy and Astrophysics at the University of Toronto (funded through an endowment established by the David Dunlap family and the University of Toronto). Additional support was provided by the Canadian Institute for Advanced Research (CIFAR), McGill University and the Trottier Space Institute thanks to the Trottier Family. B.M.G. is supported by an NSERC Discovery Grant (RGPIN-2015-05948) and by the Canada Research Chairs (CRC) program. R.M. recognizes support from the Queen Elizabeth II Graduate Scholarship and the Lachlan Gilchrist Fellowship. V.M.K. holds the Lorne Trottier Chair in Astrophysics and Cosmology, a Distinguished James McGill Professorship, and receives support from an NSERC Discovery grant (RGPIN 228738-13), from an R. Howard Webster Foundation Fellowship from CIFAR, and from the FRQNT CRAQ. K.W.M. is supported by an NSF Grant (2008031). D.Z.L is a Lyman Spitzer, Jr. Fellow. A.B.P. is a Banting Fellow, a McGill Space Institute (MSI) Fellow, and a Fonds de Recherche du Quebec—Nature et Technologies (FRQNT) postdoctoral fellow. M.B is a McWilliams fellow and an International Astronomical Union Gruber fellow. M.B. also receives support from the McWilliams seed grant. D.L.J. is a KIPAC Kavli Fellow. K.S. is supported by the NSF Graduate Research Fellowship Program. The polarization analysis presented here makes use of the RMtools package28 (C. R. Purcell et al. 2020) written by Cormac Purcell and maintained by Cameron Van Eck. We thank Grégory Desvignes for sharing the RM data of PSR J1745−2900.
Appendix
Additional Figure 12 on RM variations that supports the discussion in Section 4.
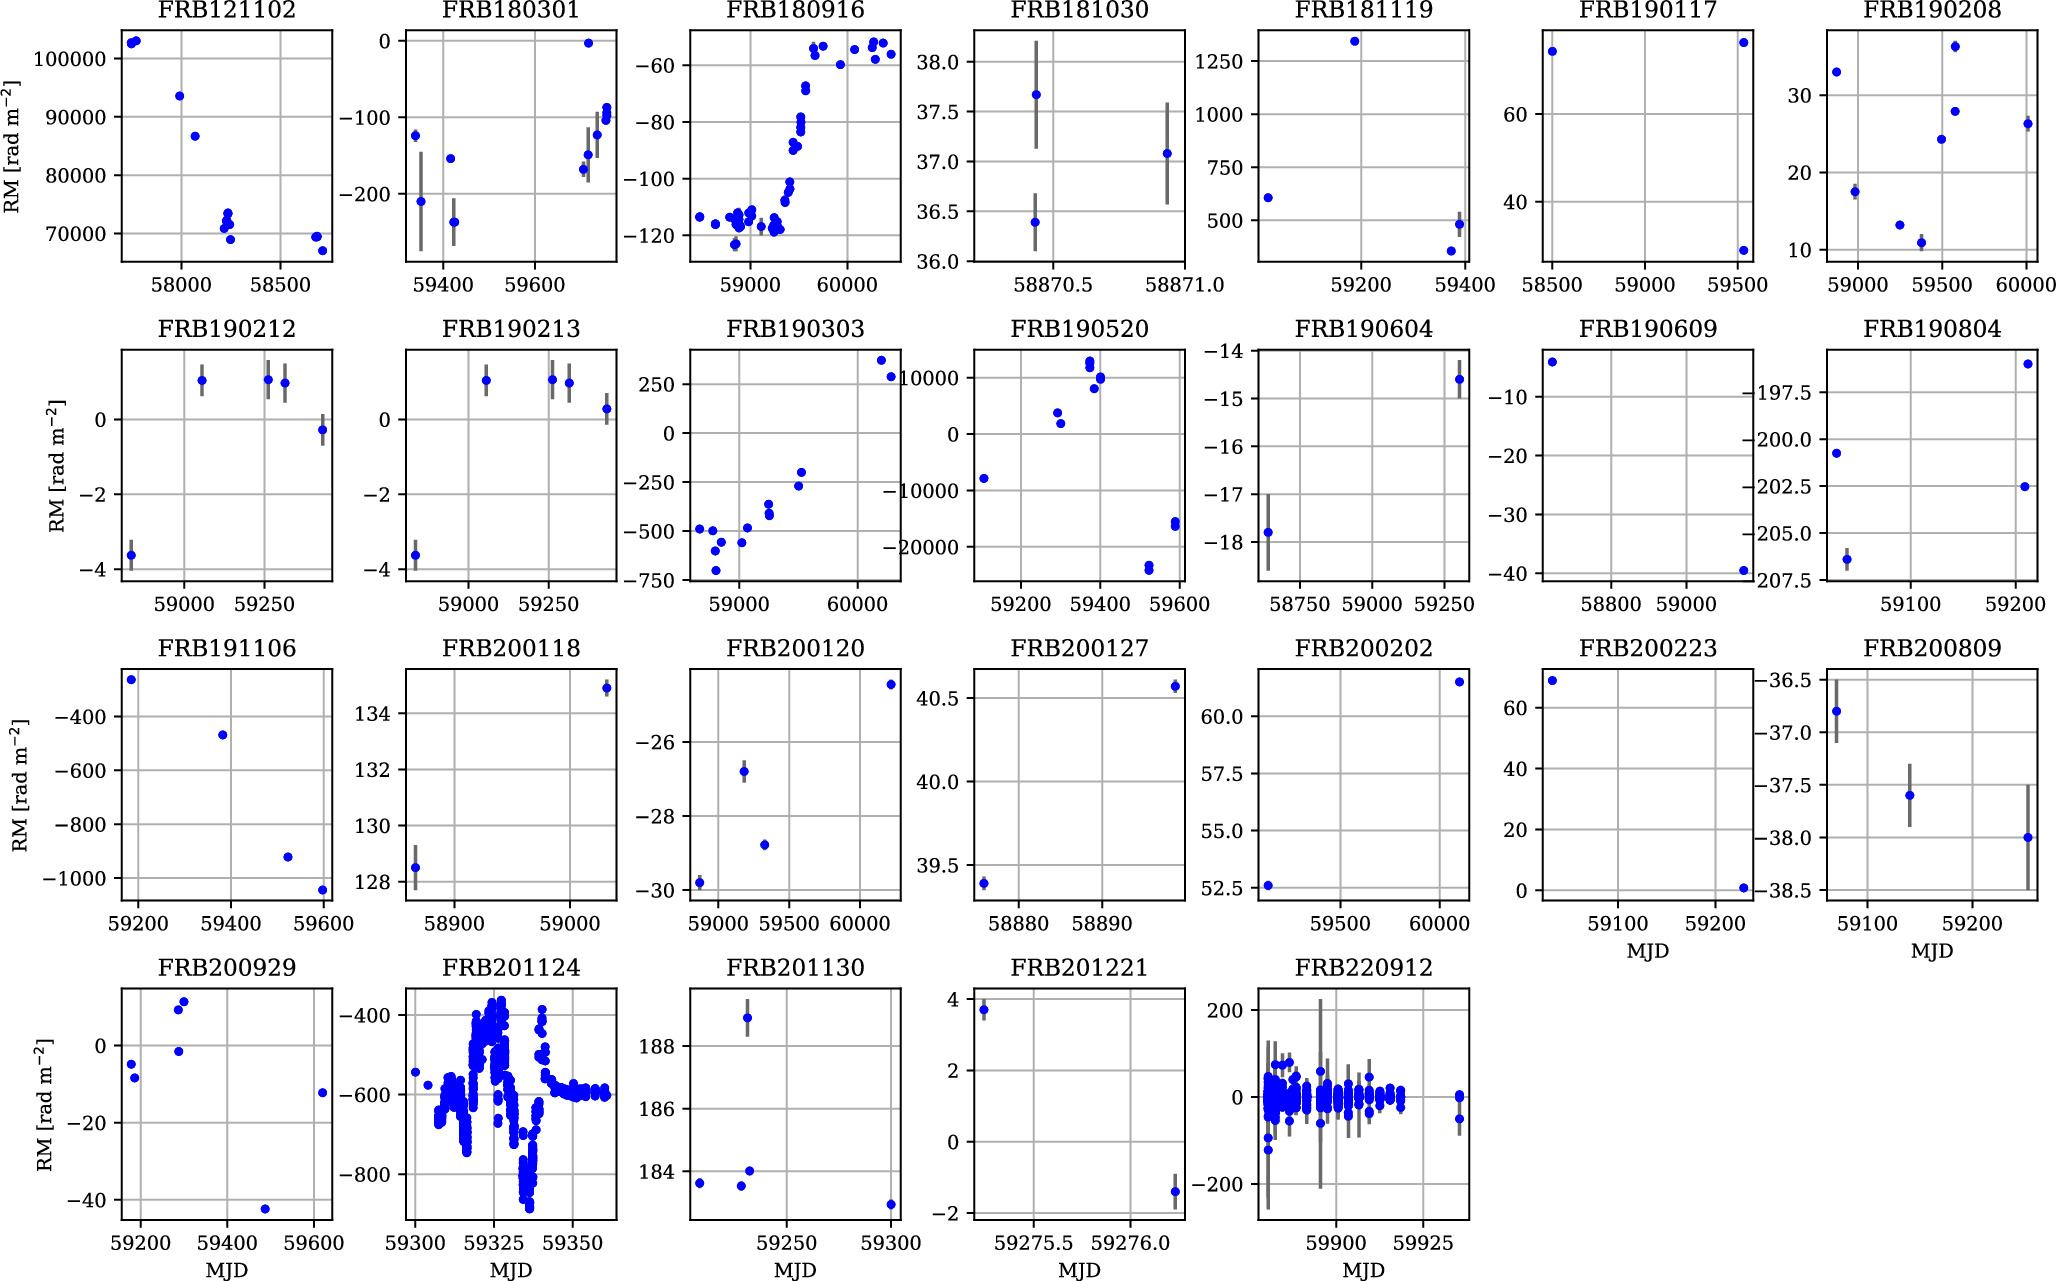
Figure 12. Temporal RM variations for 26 repeating FRBs with more than one RM, including the new results from this work as well as data from the literature.
Download figure:
Standard image High-resolution imageFootnotes
- 21
- 22
- 23
- 24
- 25
A “windy” pulsar binary implies a massive star companion that is emanating strong stellar winds.
- 26
A redback pulsar system typically consists of a low-mass companion like a red dwarf and the system usually has a short orbital period of the order of hours.
- 27
We consciously use “RM sign change” instead of “reversal” as we want to be agnostic to any assumptions of the actual magnetic field structure. A change in the sign of the observed RMexcess implies a change in the sign of the extragalactic RM components. But since we cannot separate out the multiple possible components (e.g., host, local, intervening galaxy), especially for FRB sources without precise redshift measurements, we cannot disentangle the relative changes in each extragalactic RM component and hence cannot infer whether the magnetic field pattern for a specific component has reversed.
- 28