ABSTRACT
We use the complete MOJAVE 1.5 Jy sample of active galactic nuclei (AGNs) to examine the gamma-ray detection statistics of the brightest radio-loud blazars in the northern sky. We find that 23% of these AGNs were not detected above 0.1 GeV by the Fermi-LAT during the four-year 3FGL catalog period partly because of an instrumental selection effect and partly due to their lower Doppler boosting factors. Blazars with synchrotron peaks in their spectral energy distributions located below  Hz also tend to have high-energy peaks that lie below the 0.1 GeV threshold of the LAT, and are thus less likely to be detected by Fermi. The non-detected AGNs in the 1.5 Jy sample also have significantly lower 15 GHz radio modulation indices and apparent jet speeds, indicating that they have lower than average Doppler factors. Since the effective amount of relativistic Doppler boosting is enhanced in gamma-rays (particularly in the case of external inverse-Compton scattering), this makes them less likely to appear in the 3FGL catalog. Based on their observed properties, we have identified several bright radio-selected blazars that are strong candidates for future detection by Fermi.
1. INTRODUCTION
The Fermi space telescope is a powerful broadband gamma-ray facility that has continuously scanned the entire sky every 3 hr since 2008. One of its major discoveries has been that away from the galactic plane, the gamma-ray sky is dominated by the blazar class of active galactic nuclei (AGNs; Abdo et al. 2010a). These relatively rare AGNs harbor powerful jets of relativistically moving plasma that are oriented close to our line of sight. Their overall spectral energy distribution (SED) tends to be dominated by relativistically boosted emission from the jet and typically consists of two broad peaks in a plot of log  versus log ν, where
  is the observed flux density at frequency ν (Abdo et al. 2010e). The lower-frequency peak is associated with synchrotron emission from relativistic electrons in the jet plasma, while the high-frequency peak is widely believed to be created by inverse-Compton (IC) up-scattering of photons from the jet, accretion disk, and/or broad-line region (e.g., Dermer & Schlickeiser 1993; Sikora et al. 1994).
Since the same population of jet electrons is responsible for these two peaks, we might expect the synchrotron and gamma-ray emission from individual blazars to be correlated, and this has proven to be the case. Many studies have found statistical correlations between the radio/submillimeter band and the  GeV time-averaged fluxes measured by the Fermi-LAT instrument (e.g., Kovalev et al. 2009; Ackermann et al. 2011, Lister et al. 2011; Giommi et al. 2012; Fuhrmann et al. 2014; Mufakharov et al. 2015). Mahony et al. (2010) have also shown that the fraction of radio-loud AGNs detected by Fermi steadily increases with increasing 20 GHz flux density.
Despite these well-established correlations, it is still not fully understood why a substantial fraction of the brightest, most compact blazars in the GHz band have not been detected at energies above 0.1 GeV, despite the four years of continuous observations included in the most recent Fermi catalog (3FGL; Acero et al. 2015). In this Letter, we investigate the properties of a complete, flux density-limited, 15 GHz AGN sample of the northern sky, the MOJAVE 1.5 Jy survey, where 23% of the AGNs have no Fermi detections. We show that these non-detected AGNs have a lower than average jet speed and radio variability index (indicative of a lower Doppler boosting factor) and a synchrotron component that peaks below  Hz. The latter causes their secondary SED peak to be located well below the lower-energy cutoff of the LAT instrument, resulting in a low LAT gamma-ray flux and non-detection by Fermi. We discuss the 1.5 Jy sample and observational data in Section 2, present our analysis in Section 3, and summarize our conclusions in Section 4.
2. OBSERVATIONAL DATA
In order to properly evaluate the statistics of gamma-ray detections of bright radio-loud blazars, it is essential to use well-defined, complete samples. The GeV and radio bands above ∼10 GHz are ideal in this respect due to the lack of foreground obscuration (away from the galactic plane) and little contamination from non-active galaxies. In these bands, the AGN emission is dominated by that of the jet, with little contribution from the extended lobes. In this section, we describe the radio-selected MOJAVE 1.5 Jy AGN sample and the supporting data from our own studies and the literature.
2.1. Radio Data
In the GHz band, there have been many large sky surveys carried out over the last few decades, e.g., FIRST (Becker et al. 1995), NVSS (Condon et al. 1998), GB6 (Gregory et al. 1996), AT20G (Murphy et al. 2010), such that virtually every radio-loud AGN above 1 Jy has been identified and cataloged. Nevertheless, a major challenge in obtaining complete samples of radio-loud blazars has been their highly variable flux densities, which over the course of several years can change by factors exceeding ∼10 in the GHz band (Richards et al. 2014) and ∼200 in the GeV band (Abdo et al. 2010c; Fuhrmann et al. 2014). Any single-epoch flux-limited survey therefore stands to miss a substantial portion of the population.
As part of a Very Long Baseline Array (VLBA) key project to study the parsec-scale structure and evolution of AGN jets (Lister et al. 2009b), we have constructed a complete, flux density-limited sample, based on all available GHz band flux density data on bright radio AGNs over a 16 year period from 1994.0 to 2010.0 (Lister et al. 2013). The MOJAVE 1.5 Jy sample includes all AGNs (excluding gravitational lenses) located north of J2000 declination  that are known to have exceeded 1.5 Jy in compact (milliarcsecond-scale) 15 GHz flux density at least once during that period. We were able to estimate the milliarcsecond-scale flux density from single-dish measurements by using near-simultaneous VLBA/single-dish observations of each source at several epochs. The difference of these near-simultaneous measurements represents the amount of arcsecond-scale emission resolved out by the VLBA, which is expected to be non-variable due to its size. Given the measurement errors, we were able to detect any extended emission above 0.02 Jy.
Using newly obtained data from the OVRO 15 GHz AGN monitoring program (Richards et al. 2011), we have refined our extended flux density estimates and subsequently dropped two AGNs (MG1 J021114+1051 and OP−050) from the original 1.5 Jy sample list. We list the properties of all 181 AGNs in the revised sample in Table 1. For the purposes of this paper, we consider only the 163 AGNs that are located at least 10° away from the galactic plane. This ensures that issues related to galactic gamma-ray foreground subtraction do not affect the LAT detection statistics of our sample.
Table 1. 1.5 Jy MOJAVE AGN Sample Properties
| J2000 | Alias | Fermi Catalog Name | z | Sext | Smax | Smed | a |

|

|
|---|---|---|---|---|---|---|---|---|---|
| (1) | (2) | (3) | (4) | (5) | (6) | (7) | (8) | (9) | (10) |
| J0006−0623 | NRAO 005 | ⋯ | 0.3467 | 0.08 | 2.69 | 2.09 | 0.78 | 13.0 | 13.1 |
| J0010+1058 | III Zw 2 | ⋯ | 0.0893 | ⋯ | 1.82 | 0.72 | 0.81 | 13.3 | 13.3 |
| J0019+7327 | S5 0016+73 | ⋯ | 1.781 | ⋯ | 1.48 | 1.10 | 0.66 | 12.3 | 12.7 |
| J0050−0929 | PKS 0048−09 | 3FGL J0050.6−0929 | 0.635 | 0.04 | 2.33 | 0.82 | 1.10 | 14.3 | 14.5 |
| J0102+5824a | TXS 0059+581 | 3FGL J0102.8+5825 | 0.644 | ⋯ | 5.41 | 2.49 | 1.21 | 12.7 | 12.9 |
Notes. Columns are as follows: (1) J2000 name, (2) other name, (3) Fermi catalog name, (4) redshift, (5) arcsecond-scale flux density at 15 GHz in Jy, (6) maximum 15 GHz VLBA flux density in Jy during 3FGL time window, (7) median 15 GHz VLBA flux density in Jy during 3FGL time window, (8) radio activity index, (9) log of observed synchrotron peak frequency in Hz (observer frame), (10) log of observed synchrotron peak frequency in Hz (rest frame).
aLow galactic latitude ( ).
).
Only a portion of this table is shown here to demonstrate its form and content. A machine-readable version of the full table is available.
Download table as: DataTypeset image
2.2. Gamma-Ray Data
The Third Fermi Gamma-ray Catalog (3FGL; Acero et al. 2015) is based on LAT data collected between 2008 August 4 and 2012 July 31 and contains 3033 high-confidence detections above 0.1 GeV. The Third LAT AGN Catalog (3LAC; Ackermann et al. 2015) associates 1563 of these sources with AGNs. Because of the relatively large sky position errors (∼several arcmin) of the 3FGL sources, true counterpart identification has only been achieved in 12% of the cases. The remainder of the 3FGL associations were established using extensive statistical likelihood tests and a variety of celestial source catalogs. The 3LAC list consists of only high-confidence 3FGL AGN associations. For brevity, we will refer to these AGNs as “LAT-detected” throughout this paper. Although a large number (992) of 3FGL gamma-ray sources remain unassociated, virtually all of the brightest ones have associations (see, e.g., Lister et al. 2011; Acero et al. 2015).
A total of 122 AGNs in our sample are listed as associations in the 3LAC. Additionally, PKS 0539−057 and 4C+06.69 appeared in the 1FGL catalog (Abdo et al. 2010a), and the LAT detection of 3C 120 was announced by Abdo et al. (2010b). The latter three AGNs likely do not appear in the 3FGL catalog since they experienced at most only a brief period of gamma-ray flaring; thus, their four-year averaged fluxes were below the 3FGL significance cutoff. We checked the remaining non-LAT detected AGNs in our sample, and in all cases the closest 3FGL source was at least 17 arcmin away. There are also no Fermi associations for any of these AGNs in the refined list published by Massaro et al. (2015).
2.3. SED Peak Data
As discussed previously by Finke (2013), there are considerable inconsistencies in the SED synchrotron peak locations of blazars reported in the literature. Since the peaks for most of our sample lie between 1012 and 1014 Hz, where there is typically a paucity of observational data, considerable interpolation-based errors are present. Since our AGNs are highly core dominated, any contribution from extended lobe emission to the SED is negligible above  Hz; however, some authors have included the (non-jet) IR and optical big blue bump components in their polynomial fits to the synchrotron SED component, resulting in overestimates of the true peak location.
In order to minimize these errors, we have used the ASDC SED builder Version 3.1.6 tool9 to estimate the peak location using a third-degree polynomial fit to flux densities published in the literature. For most of the AGNs in our sample, there were hundreds of available measurements at numerous frequencies; however, we only considered data up to 1014 Hz and extended this up to 1015 Hz only for clear cases where the SED remained parabolic and there was no significant blue bump component. In some instances, there were insufficient flux density data or too much confusion from non-jet emission in the 1011.5–1014 Hz region to reliably estimate the location of the synchrotron peak. Based on comparisons to other published values in the literature for our AGNs, we estimate a typical error of ±0.3 dex in our values.
3. DISCUSSION
3.1. Fermi Detection and Synchrotron Peak Location
The passband of the LAT instrument covers photon energies in the approximate range of 100 MeV–300 GeV (Atwood et al. 2009). At the highest energies, AGN detections are typically limited by low photon fluxes since they typically have steep gamma-ray spectra with power-law energy indices ranging from −1.5 to −3 (Acero et al. 2015). The LAT’s fixed passband tends to discriminate against AGNs with IC peaks located below 1 GeV and those with very steep gamma-ray spectra. If the IC peak shapes of blazars are similar, then the LAT’s fixed passband should create a correlation between the LAT energy index and the IC peak location. Unfortunately, the latter are often difficult to measure due to a lack of observational data in the soft gamma-ray and hard X-ray bands. However, we would also expect the locations of the synchrotron and IC peaks to be correlated since the same population of jet electrons is responsible for both features. This has been shown to be the case in the form of a relatively tight correlation between LAT energy index and synchrotron peak location (Abdo et al. 2010d). Therefore, since the two SED peaks track each other, AGNs with low synchrotron peak locations should have IC peaks located well below the LAT bandpass, and consequently a smaller chance of detection by Fermi.
In Figure 1, we show histograms of synchrotron peak frequency for the LAT and non-LAT detected sub-samples. All of the non-detected AGNs have synchrotron peak frequencies below  Hz (in both the rest and observer frames). We performed two commonly used non-parametric statistical tests to look for differences in the distributions. The Kolmogorov–Smirnov test evaluates possible differences in the cumulative distribution functions, while the Wilcoxon rank-sum test evaluates whether the data points of one sample are generally higher valued (or lower valued) than the other. We list the test results in Table 2. The LAT and non-LAT AGNs have significantly different synchrotron peak distributions, both in the observed and rest frames. Figure 2 shows that as predicted, the AGNs in our sample with higher synchrotron peak frequencies are more likely to be detected by Fermi.
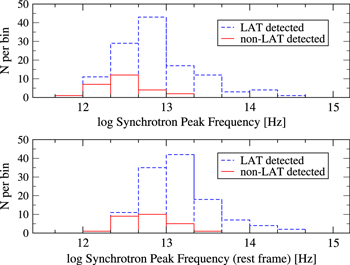
Figure 1. Top panel: distributions of observed synchrotron peak frequency for LAT detected (blue dashed line) and non-LAT detected (red solid line) sub-samples. Lower panel: same as the top panel, but for rest-frame synchrotron peak frequency.
Download figure:
Standard image High-resolution image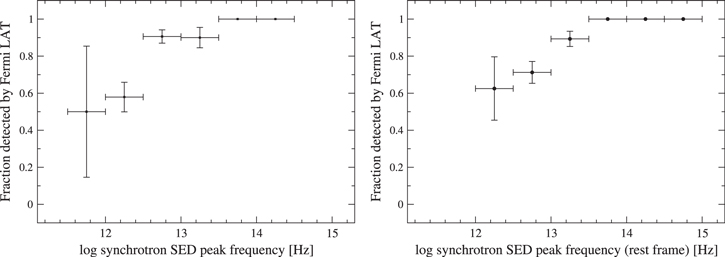
Figure 2. Left panel: LAT detection fraction vs. synchrotron peak frequency. The vertical error bar for each bin assumes a binomial distribution with variance equal to  , where N is the number of AGNs in the bin and f is the LAT detection fraction. Right panel: same as the left panel, but for rest-frame peak frequency.
Download figure:
Standard image High-resolution imageTable 2. Statistical Tests on LAT and Non-LAT Sub-samples
| Property | Kolmogorov–Smirnov | Wilcoxon Rank Sum |
|---|---|---|
| Synchrotron peak location (observed) | 1 × 10⁻⁴ |

|
| Synchrotron peak location (rest frame) | 1 × 10⁻⁴ |

|
| Maximum observed jet speed | 2 × 10⁻⁶ |

|
| 15 GHz modulation index | 5 × 10⁻⁴ |

|
| Redshift | 0.50 | 0.45 |
| Radio activity indexa | 0.10 | 0.14 |
| Median VLBA radio flux densitya | 0.86 | 0.50 |
| Maximum VLBA radio flux densitya | 0.04 | 0.05 |
| Median VLBA radio luminositya | 0.86 | 0.80 |
| Maximum VLBA radio luminositya | 0.76 | 0.73 |
Notes. The tabulated values indicate the probability of obtaining the observed distributions in the LAT and non-LAT detected sub-samples under the null hypothesis that they came from the same parent distribution.
aDuring the 3FGL time window.Download table as: ASCIITypeset image
3.2. Fermi Detection and Doppler Boosting Indicators
A main prediction of the external seed photon model for high-energy blazar emission is that the IC radiation should be more highly Doppler boosted than the synchrotron emission due to a blueshifting of the external photons in the rest frame of the jet electrons (Dermer 1995). The gamma-rays will also experience more effective boosting (via a k-correction) since their emission spectrum is much steeper than that of the flat-spectrum radio jet. There is already ample evidence that Fermi preferentially detects highly Doppler-boosted jets; the very small number of misaligned (low Doppler factor) jets in the 3LAC (only 2% of the catalog) is a prime example. Other studies showing this Fermi selection bias include those by Kovalev et al. (2009), Abdo et al. (2010d), and Savolainen et al. (2010).
The Doppler factors of AGN jets are difficult to measure accurately due to the featureless power-law nature of the jet emission and a lack of a good means with which to estimate the jet viewing angle. Some studies (e.g., Lähteenmäki & Valtaoja 1999; Jorstad et al. 2005; Hovatta et al. 2009) have used light-crossing time arguments and variability timescales of individual flares to derive Doppler factors, but only for a relatively small number of AGNs. However, the overall variability level of a blazar is also a good indicator of its Doppler factor since any intrinsic variability will be significantly shortened and increased in amplitude by Doppler boosting (e.g., Lister 2001). The OVRO monitoring program has published 15 GHz modulation indices for nearly 1500 blazars, covering the time period 2008 January 1–2011 December 31. These indices are estimates of the standard deviation of the flux density of a source divided by its mean (Richards et al. 2011).
The gamma-ray detected AGNs in the OVRO sample are significantly more radio variable than the non-detected ones (Richards et al. 2014), and we find this same trend for the 142 OVRO AGNs in our sample. Richards et al. (2014) also found the level of AGN radio variability to decrease with increasing synchrotron peak frequency, but their sample includes significant numbers of AGNs with observed synchrotron peaks above 1014 Hz, whereas there are only four such AGNs in our sample.
Another method of estimating the amount of relativistic boosting comes from measurements of apparent jet speeds. Although it is possible for a jet to have a low apparent speed if it is aligned exceedingly close to the line of sight (i.e., a viewing angle  , where Γ is the bulk Lorentz factor), for large flux-limited jet samples, the apparent speed will on average be well correlated with Lorentz factor (Lister et al. 2001). The MOJAVE program has published maximum apparent jet speeds for 133 AGNs in our sample (Lister et al. 2013) and is currently obtaining multi-epoch VLBA data on the remainder.
In an earlier study using the first three months of Fermi data, we showed that the gamma-ray detected AGNs in the original MOJAVE sample had higher apparent jet speeds (Lister et al. 2009a). This is also the case for our 1.5 Jy sample, at an even higher level of statistical confidence (Table 2). Taken together with the trend in modulation index, this indicates that the Doppler factor also plays an important role in determining which radio-loud blazars will be detected by Fermi.
3.3. Fermi Detection and Other Jet Properties
In addition to Doppler factor and synchrotron peak location, there are potentially other properties that can also influence the gamma-ray flux of a blazar. These include redshift, intrinsic jet luminosity, and the activity state of the jet during the 3FGL observation period. The latter is particularly important when considering the Fermi detection statistics of the 1.5 Jy sample, which was selected over a time period that only partially overlaps that of the 3FGL catalog.
We have compiled maximum and median 15 GHz VLBA flux densities of the 1.5 Jy AGNs during two time periods: (a) between the start of the 1.5 Jy sample selection window (1994 January 1) and the start of Fermi operations (2008 August 4), and (b) during the 3FGL observation window. We use the ratio of the maximum flux density in these two periods as a Fermi-era radio activity indicator, as was done by Kovalev et al. (2009) in their analysis of the Fermi LBAS list (Abdo et al. 2009). There were 51 AGNs with insufficiently sampled flux density data in the pre-Fermi era to determine a reliable activity index.
The OVRO program does not include any AGNs below declination  , and 10 other 1.5 Jy sample AGNs were only added to its monitoring list after the end of the 3FGL period. In all of these cases, we had at least four epochs of VLBA10
or UMRAO 14.5 GHz (Aller et al. 2014) observations during the 3FGL period with which to calculate maximum and median values.
, and 10 other 1.5 Jy sample AGNs were only added to its monitoring list after the end of the 3FGL period. In all of these cases, we had at least four epochs of VLBA10
or UMRAO 14.5 GHz (Aller et al. 2014) observations during the 3FGL period with which to calculate maximum and median values.
We find no statistically significant differences in the activity indices of the LAT and non-LAT sub-samples. This is also the case for the median radio flux density during the 3FGL time period. There is a mild indication that the maximum radio flux densities of the LAT-detected AGNs are higher on average than the non-detected ones. This is likely because the majority of the LAT-detected AGNs are highly variable in gamma-rays and were detectable by Fermi only during a small fraction of the 3FGL time window (Acero et al. 2015).
There is no significant dependence of AGN LAT detection on redshift, maximum 3FGL-era radio luminosity, or median 3FGL-era radio luminosity. Our sample, being selected on radio jet emission, is dominated by high-luminosity, high-redshift jets and contains only 11 AGNs located closer than redshift 0.1. Consequently, it does not uniformly sample a wide range of jet luminosity and is not ideally suited for probing the gamma-ray detection statistics of lower luminosity AGNs.
4. SUMMARY AND CONCLUSIONS
We have examined the Fermi-LAT detection statistics during the time period covered by the 3FGL catalog (2008 August 4 to 2012 July 31) of the MOJAVE 1.5 Jy complete, flux density-limited sample of radio-loud blazars with J2000 declination  and
and  . We conclude that 23% of these AGNs were not detected above 0.1 GeV by the Fermi-LAT in part due to an instrumental selection effect and partly due to lower relativistic boosting of their jet emission.
The LAT-detected blazars have significantly higher radio variability levels and apparent jet speeds than the non-detected ones. Both of these properties are positively correlated with the Doppler boosting factor of the radio emission. Since the effective amount of relativistic flux boosting is enhanced in gamma-rays (especially in the case of the external IC model), radio-selected blazars with lower than average Doppler factors are less likely to be detected by Fermi. In Figure 3, we plot apparent jet speed and modulation index, respectively, versus the rest-frame synchrotron peak frequency. In both scatterplots, there is a clear tendency for the non-LAT-detected AGNs to cluster in the lower left corner. In Figure 3, we have identified three AGNs (III Zw 2, PKS 0119+11, and 4C+69.21), which based on their locations in the plots, are likely candidates for future LAT detection. The LAT’s selection effects are clearly evident in the differences in the SED synchrotron peak locations of the detected and non-detected blazars in our sample. Bright radio-loud blazars with synchrotron peaks in their SEDs located below  Hz have high-energy peaks that lie well below the lower-energy cutoff of the LAT, resulting in a low gamma-ray flux. Future space telescopes such as Astro-H, which cover the hard X-ray/soft gamma-ray regime below 100 MeV, therefore offer great potential for detecting these blazars.
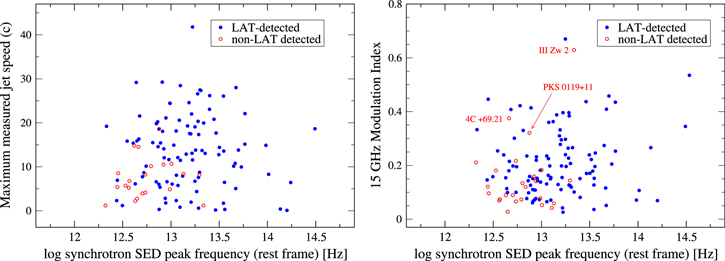
Figure 3. Left panel: plot of maximum measured jet speed vs. rest-frame synchrotron SED peak frequency. The blue filled circles represent LAT-detected AGNs, while the open red circles represent non-LAT-detected AGNs. Right panel: same as the left panel, but for 15 GHz OVRO modulation index.
Download figure:
Standard image High-resolution imageThe authors thank Ken Kellermann for helpful discussions. The MOJAVE program is supported under NASA-Fermi grant NNX12A087G. M.F.A. was supported by NASA-Fermi GI grants NNX09AU16G, NNX10AP16G, and NNX11AO13G and NSF grant AST-0607523. T.H. was supported by the Academy of Finland project number 267324. E.R. acknowledges support by the MINECO grant AYA-2012-38491-C02-01 and Generalitat Valenciana grant PROMETEOll/2014/057. The National Radio Astronomy Observatory is a facility of the National Science Foundation operated under cooperative agreement by Associated Universities, Inc. This work made use of the Swinburne University of Technology software correlator (Deller et al. 2011), developed as part of the Australian Major National Research Facilities Programme and operated under license.