Abstract
JWST is revolutionizing our understanding of the high-z Universe by expanding the black hole horizon, looking farther and to smaller masses, and revealing the stellar light of their hosts. By examining JWST galaxies at z = 4–7 that host Hα-detected black holes, we investigate (i) the high-zM•–M⋆ relation and (ii) the black hole mass distribution, especially in its low-mass range (M• ≲ 106.5M⊙). With a detailed statistical analysis, our findings conclusively reveal a high-zM•–M⋆ relation that deviates at >3σ confidence level from the local relation. The high-z relation is  . Black holes are overmassive by ∼10–100× compared to their low-z counterparts in galactic hosts of the same stellar mass. This fact is not due to a selection effect in surveys. Moreover, our analysis predicts the possibility of detecting in high-z JWST surveys 5–15× more black holes with M• ≲ 106.5M⊙, and 10–30× more with M• ≲ 108.5M⊙, compared to local relation’s predictions. The lighter black holes preferentially occupy galaxies with a stellar mass of ∼107.5–108M⊙. We have yet to detect these sources because (i) they may be inactive (duty cycles 1%–10%), (ii) the host overshines the active galactic nucleus (AGN), or (iii) the AGN is obscured and not immediately recognizable by line diagnostics. A search of low-mass black holes in existing JWST surveys will further test the M•–M⋆ relation. Current JWST fields represent a treasure trove of black hole systems at z = 4–7; their detection will provide crucial insights into their early evolution and coevolution with their galactic hosts.
Original content from this work may be used under the terms of the Creative Commons Attribution 4.0 licence. Any further distribution of this work must maintain attribution to the author(s) and the title of the work, journal citation and DOI.
1. Introduction
The James Webb Space Telescope (JWST) was designed to be “a giant leap forward in our quest to understand the Universe and our origins.” Faithful to its core mission, JWST shows us an unprecedented—and somewhat unexpected—view of the high-z Universe, particularly concerning early galaxy and black hole formation.
Before the advent of JWST observations, the “black hole horizon,” defined as the farthest redshift where a black hole can be detected, stood at z ∼ 7–8. The farthest supermassive black hole (SMBH), with mass M• = (1.6 ± 0.4) × 109 M⊙, was detected at z = 7.642 (Wang et al. 2021). In its first year of operation, JWST immensely expanded the black hole horizon and significantly decreased the detected black hole mass.
Currently, the farthest SMBH is observed spectroscopically in GN-z11, a galaxy at z = 10.6, with a mass of ∼1.6 × 10⁶ M⊙ (Maiolino et al. 2023b). This discovery came shortly after the ∼2σ detection of another quasar at z = 8.679, with a slightly heavier mass of ∼107 M⊙ (Larson et al. 2023).
These exceptional discoveries come on top of more numerous detections in the redshift range z = 4–7 (i.e., where the Hα line is effective in measuring masses) that is filling the 106–108 M⊙ black hole mass range (Carnall et al. 2023; Harikane et al. 2023a; Kocevski et al. 2023; Onoue et al. 2023; Übler et al. 2023). This redshift range is now filled with many galaxies hosting black holes, also of low mass, that allow some statistical inference.
The JWST is also revolutionizing the field in another aspect: revealing the starlight emitted by the hosts of SMBHs. Although we detected more than 200 quasars at z > 6 (Fan et al. 2023), these SMBHs are very massive, accrete at or near the Eddington luminosity, and typically outshine their host galaxy, with typical luminosities of >1046 erg s−1. Thus, detecting the host’s starlight of SMBHs during the reionization epoch has been elusive. With the photon-collecting power of JWST, we can now detect SMBHs that are smaller in mass, farther out, and characterized by lower luminosities (∼1044–1045 erg s−1). As they do not outshine their hosts, making estimates of their stellar mass is now achievable, with relative ease, in this redshift range (Ding et al. 2023).
What is the astrophysical picture that these observations provide us? Expanding the black hole horizon in redshift and decreasing the detected black hole mass enlighten us regarding two crucial astrophysical topics:
- 1.the formation of the first population of black holes, referred to as black hole seeds; and
- 2.the early coevolution of black holes and their galactic hosts.
Black hole seeds formed at z ∼ 20–30, or ∼200 Myr after the big bang (Barkana & Loeb 2001), when the first population of stars (Population III) were born. Seeds are typically categorized into light (M• ∼ 102 M⊙) and heavy (M• ∼ 105 M⊙) seeds (see, e.g., the reviews Woods et al. 2019; Inayoshi et al. 2020; Fan et al. 2023). By detecting black holes at progressively higher redshift, we automatically shrink the time frame between detection and formation, thus constraining more tightly the properties of early seeds (Pacucci & Loeb 2022; Fragione & Pacucci 2023).
The existence of a clear correlation, at least in the local Universe, between the mass of the central SMBH and some properties of its host indicates that these two crucial cosmic players coevolved (Magorrian et al. 1998; Ferrarese & Merritt 2000; Gebhardt et al. 2000; Kormendy & Ho 2013; Reines & Volonteri 2015; Shankar et al. 2019). These correlations (e.g., the M•–M⋆ between the SMBH mass and the host’s stellar mass) have been tested at low redshift and also scrutinized at higher redshift, although with more uncertain and scarce data (see, e.g., Volonteri & Reines 2016; and more recently with JWST data, e.g., Maiolino et al. 2023b; Kocevski et al. 2023; Kokorev et al. 2023; Larson et al. 2023; Stone et al. 2023; Yue et al. 2023). Crucially, Volonteri et al. (2023) posed the timely question of whether z > 9 galaxies recently discovered by JWST host a central black hole and what their masses might be.
At these redshifts, the validity of the M•–M⋆ is uncertain, while other relations, e.g., the M• − σ with the central stellar velocity dispersion and the M• − Mdyn with the dynamical mass of the host, seem to hold (Maiolino et al. 2023b). In this study, whenever we use the term “overmassive,” we refer to black holes that are too massive compared to what their stellar mass would dictate.
The aforementioned fundamental unknowns of the early cosmic epochs are connected. Several studies have shown that, in the high-z Universe, offsets from local relations may favor specific flavors of black hole seeds (see, e.g., Hirschmann et al. 2010; Pacucci et al. 2017, 2018; Visbal & Haiman 2018; Nguyen et al. 2019; Greene et al. 2020; King & Nealon 2021; Hu et al. 2022; Koudmani et al. 2022; Schneider et al. 2023; Scoggins & Haiman 2023; Scoggins et al. 2023). Hence, constraining the shape of the M•–M⋆ relation at high z, especially its low-mass end (i.e., with sources that are more common than quasars), will enlighten us on the seeding mechanisms during earlier epochs.
Using new JWST observations of galaxies hosting SMBHs at z = 4–7, we pose two fundamental questions: (i) What do current JWST observations imply regarding the high-z scaling relation between black hole and stellar mass? (ii) How many SMBHs do we expect to observe with JWST in current and future surveys, especially in the lower end of the mass distribution?
2. Data
We examine the following data set of SMBHs and their host galaxies:
- 1.Eight sources reported by Harikane et al. (2023a), obtained from the Early Release Observations (Pontoppidan et al. 2022), which targeted the SMACS 0723 field, the Early Release Science observations of GLASS (Treu et al. 2022), and the Cosmic Evolution Early Release Science Survey (CEERS; Finkelstein et al. 2023). From this sample, we included only sources that are not gravitationally lensed because lensed objects follow different detection limits. Note that this set already includes the two sources reported by Kocevski et al. (2023), with CEERS identification numbers 2782 and 746.
- 2.Twelve sources reported by Maiolino et al. (2023a) from the JWST Advanced Deep Extragalactic Survey (JADES; Eisenstein et al. 2023). Three of these 12 sources are indicated as candidate dual active galactic nuclei (AGNs), and the mass of the secondary SMBH is also provided. As these secondary SMBHs are candidates, we decided not to include them in this analysis.
- 3.One source reported by Übler et al. (2023) from the Galaxy Assembly with NIRSpec IFS survey (GA-NIFS).
We chose these sources because of two critical commonalities: they are all spectroscopically confirmed with NIRSpec, and their black hole masses are estimated with the Hα line (Greene & Ho 2005). Note that NIRSpec provides near-IR spectroscopy up to 5.3 μm; hence, this method can be applied to estimate SMBH masses up to z ∼ 7. All the sources investigated here are in the redshift range 4 < z < 7 and are characterized by an estimate of the hosts’ stellar mass, which is executed with a fitting of their UV to optical rest-frame spectral energy distributions.
As this work analyzes the possible bias introduced by observations, we exclude the two black holes at z > 8 (Larson et al. 2023; Maiolino et al. 2023b) whose masses are estimated with other optical lines and require a different analysis.
3. Methods
In this section, we describe the analytical and statistical tools used to analyze the data and infer the properties of the population of z = 4–7 galactic systems.
3.1. Local Scaling Relation
We consider the relation derived by Reines & Volonteri (2015) as our benchmark for the M•–M⋆ correlation in the local Universe. We adopted this relation because it was empirically estimated from a sample of bright AGNs hosted in galaxies with stellar masses comparable to those of our sample and because it also uses the broad Hα line to estimate black hole masses between 106 and 108 M⊙, which is compatible with the range investigated here. On the other hand, the standard relation (Kormendy & Ho 2013) was determined from local, massive, and quiescent galaxies hosting nonaccreting black holes at their centers. The Reines & Volonteri (2015) relation is the following:
where α = 7.45 ± 0.08 and β = 1.05 ± 0.11. This relation indicates that, at z ∼ 0, the black hole mass is typically 0.1% of the stellar mass contained in the bulge of its host.
Recent studies (e.g., Harikane et al. 2023a; Maiolino et al. 2023a, 2023b; Kocevski et al. 2023; Übler et al. 2023) have also used the relation in Reines & Volonteri (2015) to compare the behavior of their high-z systems with z ∼ 0 ones. They find indications that the black holes grow faster than the stellar content of their host galaxy at z > 4. Interestingly, Bogdan et al. (2023) reported the discovery of a gravitationally lensed quasar at z = 10.3, with an estimated black hole mass comparable to its stellar mass, and Natarajan et al. (2023) suggested its origin as a heavy black hole seed. However, the detection of overmassive black holes is not new, as it was already suggested by sporadic observations at z ∼ 6 in the pre-JWST era (see, e.g., Wang et al. 2010), and, recently, even more locally (see, e.g., Mezcua et al. 2023, up to z = 0.9).
3.2. JWST Sensitivity in Hα and Mass Limits
All SMBHs in our sample were detected, and their mass estimated, using the Hα line emission (see Section 2). To compare our analysis with the local M•–M⋆ relation derived by Reines & Volonteri (2015), we use the formula derived by Reines et al. (2013) to estimate the black hole mass:
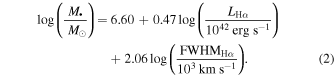
We recalculate the black hole masses in our sample that are not estimated by Equation (2) according to this relation for consistency. This procedure was also followed by Maiolino et al. (2023a). Note that LHα and the FWHM refer to the component associated with the broad-line region (BLR) of the AGN.
To determine the sensitivity limit of JWST, we require NIRSpec to perform a 3σ detection, or better, to positively identify a BLR and, thus, a black hole at the center of its host. For a medium JWST program (e.g., CEERS and JADES), the sensitivity for a resolution element of the spectrum is ∼10−19 erg s−1 cm−2. Considering a resolution element of ∼300 km s−1 and an FWHM of 1000 km s−1 (the minimum FWHM for a BLR identified in Harikane et al. 2023a), the sensitivity on an integrated line is ≈1.8 × 10⁻¹⁹ erg s−1 cm−2, or ≈5.5 × 10⁻¹⁹ erg s−1 cm−2 for a 3σ detection.
From this limiting flux, we compute the LHα luminosity (at different redshifts) and thus estimate the minimum black hole mass for which NIRSpec can execute a 3σ detection. We adopt the standard ΛCDM cosmology from Planck Collaboration et al. (2020) to find the luminosity distance dL (z). Additionally, NIRSpec must discern the Hα FWHM from the host’s emission to accurately estimate the black hole mass. Considering typical radii of z = 4–7 galaxies discovered by JWST and estimating their velocity dispersion from local galaxies, we calculated that the host’s dispersion does not affect the Hα sensitivity thus far calculated for galaxies with a stellar mass M⋆ < 1011 M⊙. Hence, our sensitivity estimates based on the Hα luminosity are correct in the mass range we consider.
Figure 1 shows the data set used, along with the limiting sensitivities for NIRSpec, calculated at z = 4, 5, 6, 7. All data points are above the limiting sensitivities at their respective detection redshift. The figure also highlights the difference between the M•–M⋆ relation by Reines & Volonteri (2015) and that by Greene et al. (2020). The latter is even more in tension with high-z JWST data than the former.
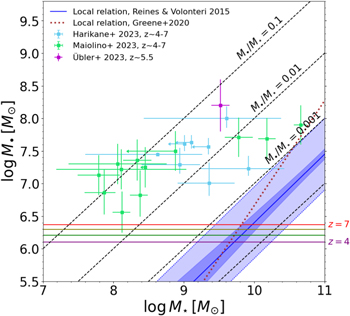
Figure 1. Overview of the data set used and the local M•–M⋆ relation from Reines & Volonteri (2015). The dark-shaded region denotes the 1σ uncertainty from the linear fit, and the light-shaded region denotes the 0.55 dex rms deviation of the local observations from the local relation. The black hole masses are estimated from the Hα virial relation from Reines et al. (2013), with the parameters chosen by Reines & Volonteri (2015). At four different redshifts (z = 4, 5, 6, 7), the horizontal lines show the limiting sensitivities for a 3σ detection of the Hα line with NIRSpec (see Section 3.2 for a detailed description). Error bars indicate the 1σ uncertainty in the stellar and black hole masses. As a comparison, the dotted brown line displays the M•–M⋆ relation by Greene et al. (2020).
Download figure:
Standard image High-resolution image3.3. High-z Galaxy Stellar Mass Function
Galaxies are not equally distributed in stellar mass. To estimate the likelihood of JWST detecting hosts at different stellar masses, we use the galaxy stellar mass function (SMF) in the range z = 4–8 by Song et al. (2016):

where the parameters M*, ϕ*, and α are calibrated for the different redshifts considered. This SMF is derived from the ultraviolet luminosity function based on observations in the CANDELS/GOODS and Hubble Ultra Deep fields (Song et al. 2016). The SMF is expressed in units of Mpc−3 dex−1; hence, to convert into a surface density (arcmin−2 dex−1) for different redshift bins of Δz = 1, we multiply the SMF by the volume enclosing a solid angle  within the redshift bin:

where VC (z) indicates the comoving volume at redshift z, assuming the Planck Collaboration et al. (2020) cosmology.
3.4. Likelihood Function and Estimate of the High-z M•–M⋆ Relation
To model the likelihood of the parameters of the high-z M•–M⋆ relation, given JWST data, we consider the following factors:
- 1.A two-dimensional Gaussian uncertainty distribution along the M•–M⋆ relation, derived from the correlated stellar and black hole mass measurement uncertainties of our sample (Section 2).
- 2.An intrinsic Gaussian scatter around the M•–M⋆ relation, with orthogonal variance ν as a free parameter. This scatter provides flexibility in fitting a linear relationship, considering the large uncertainties characterizing high-z sources.
- 3.The SMF (Equation (3)) at z = 5, the median redshift in our data set, which increases the statistical weight to sources at lower stellar masses, where the population is expected to be more numerous.
- 4.As we map the black hole mass function to the SMF, we are intrinsically assuming an occupation fraction of unity: all galaxies in our redshift range host an active black hole. Although much uncertainty remains, typical values for the AGN fraction in early galaxies range from 1% to 10% (Harikane et al. 2023a; Maiolino et al. 2023a; Matthee et al. 2023).
- 5.
- 6.The single JWST observations are assumed to be statistically independent.
Although the mass uncertainties are reported to be non-Gaussian (i.e., with different upper and lower error bars), we model them as Gaussian for simplicity, using the greater error bars as a conservative estimate of standard deviations. The two-dimensional uncertainty distribution and the intrinsic scatter around the M•–M⋆ relation are convoluted and projected orthogonally onto the relation, resulting in the following likelihood function for a sample of N observations (Hogg et al. 2010):
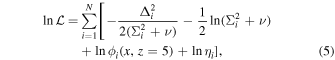
where


Here we provide only a short description of the terms involved; the interested reader is referred to Hogg et al. (2010) for a detailed explanation. In the formulae above, i denotes each observation in the sample. We define  and
and  in units of solar mass. Parameters m and b denote the slope and y-intercept of the M•–M⋆ relation, respectively. Parameter
  is the limiting black hole mass at the median redshift z = 5. Parameters σx
and σy
are the measurement uncertainties of M⋆ and M•, respectively. Parameter
σxy
is the covariance between the measurement uncertainties of M⋆ and M•. Parameter
is the limiting black hole mass at the median redshift z = 5. Parameters σx
and σy
are the measurement uncertainties of M⋆ and M•, respectively. Parameter
σxy
is the covariance between the measurement uncertainties of M⋆ and M•. Parameter  is the angle between the M•–M⋆ relation and the x-axis. F(t) is the cumulative distribution function of a Gaussian orthogonal to the relation, with mean 0 (i.e., no deviation from the relation) and variance Σ2 + ν. The key terms of Equation (5) and their statistical significance are the following:
- 1.Δi : the orthogonal displacement of a data point from the fit line.
- 2.
 : the orthogonal variance, calculated by projecting the uncertainty covariance matrix (representing the two-dimensional Gaussian uncertainty of a data point) down to the line.
 - 3.ϕi : adds extra weights to sources at lower stellar masses.
- 4.ηi : corrects the flux-limited bias of JWST for the Hα line.

Note that ϕi and ηi are modifications to the likelihood function in Hogg et al. (2010); we include them to address better the physical contexts we examine. The flux-limited bias correction term ηi is derived and discussed in Nguyen et al. (2023, in preparation). We only consider the likelihood function within the stellar mass range of our sample (7.79 < x < 10.66) and above the limiting black hole mass (see Section 3.2).
Using the likelihood function described above, the local M•–M⋆ relation parameters from Reines & Volonteri (2015) as priors for m and b, and a flat prior for ν (0 < ν < 1), we use the software package emcee (Foreman-Mackey et al. 2013) to run a Markov Chain Monte Carlo (MCMC) algorithm, as outlined in Goodman & Weare (2010). We parameterize the M•–M⋆ relation as
and sample the (b, m, ν) parameter space. We assessed convergence by considering the integrated autocorrelation time to quantify the effects of the sampling errors on the output, as suggested by Goodman & Weare (2010). The execution of the algorithm is halted once the autocorrelation time converges within 0.1%, which takes ∼10,000 steps. The first 1% of steps during the burn-in period are not considered to avoid bias from the initial position (the parameters of the local M•–M⋆ relation). Then, the posterior distributions calculated by the MCMC algorithm provide the median and 1σ uncertainty of the parameters, providing an estimated high-z M•–M⋆ relation inferred from JWST data. The uncertainty of the inferred high-z relation is assessed by sampling it 1000 times, with parameters chosen randomly within the 1σ three-dimensional contours of the fit parameters.
To conclude, we briefly explore the effect of the flux-limited bias correction term η in Equation (5). If an infinite sensitivity characterized JWST, the best-fit line would simply pass through the data points (assuming equal uncertainties). Instead, JWST is characterized by a finite sensitivity to detect Hα emission; hence, the distribution of observable sources is skewed toward higher black hole masses, as we neglect sources below the limiting mass, which are unobservable. Consequently, the best-fit line shifts lower because the limiting sensitivity increases the probability of sources with overmassive black holes. Parameter η ensures that the inferred best-fit line is not overestimated as we consider the sensitivity limit of JWST.
However, because the JWST limit in Hα is deep (≳1 dex lower in the mass scale; see Figure 1) compared to most black hole observations in our sample, η only shifts the inferred M•–M⋆ relation down by ∼0.2 dex. In this study, the influence of η is statistically insignificant compared to other uncertainty factors, typically on the order of ≳0.3 dex (e.g., the mass measurements, the intrinsic scatter, and the SMF). We also note that if the mass measurement uncertainties are underestimated, or the correlation between the uncertainties of M⋆ and M• is overestimated, then η would overestimate the inferred relation. A more detailed statistical analysis of the implications of JWST flux-limited bias for current and future high-z observations is included in Nguyen et al. (2023, in preparation).
3.5. Estimate of the Number of Sources Observable
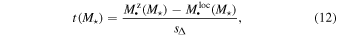
The z ∼ 0 observations show that the rms scatter around the local M•–M⋆ relation is ≈0.55 dex (Reines & Volonteri 2015). Thus, assuming the local relation, we model the conditional probability density of detecting galaxies with a certain central black hole mass given its stellar mass, i.e., p(M•∣M⋆), as a Gaussian distribution with a standard deviation of 0.55 dex around the M•–M⋆ relation. Once we derive the M•–M⋆ relation inferred from the z ∼ 4–7 observations by JWST (see Section 3.4), we can use the best-fit intrinsic scatter as the standard deviation around the relation to compute the expected number of observations.
Given the limiting black hole mass  at a certain redshift (see Section 3.2), the probability of detecting a source with
  , assuming M⋆, is
Hence, the surface density of sources with  , at redshift z, is

Thus, the expected number of sources with  observable by JWST with the Hα line, at redshift z, is

where  and
and  represent the minimum and maximum stellar mass, respectively, in our considered sample. We limit our analysis within this stellar mass range to avoid overestimation bias from the lower stellar mass end. While more galaxies are distributed at lower stellar masses, they are dimmer and less likely to be observed by JWST, so it is reasonable to keep our estimates within the stellar mass range observed so far.
4. Results
In this section, we use the framework detailed in Section 3 to address two fundamental questions: (i) What can we infer with current JWST data regarding the M•–M⋆ relation at z = 4–7? (ii) What are the properties and observational perspectives of the population of black holes at z = 4–7, especially in the low-mass range (M• ≲ 106.5 M⊙)?
4.1. The High-z M•–M⋆ Relation from JWST data
We use JWST data described in Section 2 and our theoretical framework detailed in Section 3 to infer the M•–M⋆ relation in the z = 4–7 redshift range with an MCMC approach.
We seek a relation of the form  , where both the black hole mass and the stellar mass are expressed in solar units. For our calculation, we consider the JWST sensitivity limit for the Hα line at z = 5 (median redshift of our data), the SMF, and the local M•–M⋆ relation as a prior.
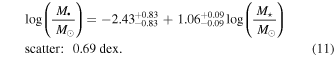
Figure 2 shows our results. We find a high-z M•–M⋆ relation that is visually very different from the local relation by Reines & Volonteri (2015). In particular, the high-z relation indicates black holes + host systems where black holes are ∼10–100 × overmassive with respect to stellar content of their low-z counterparts.
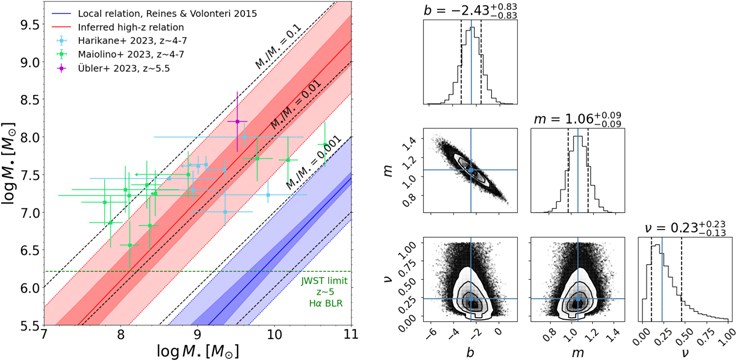
Figure 2. Left panel: in red, the high-z
M•–M⋆ relation derived from JWST data at z = 4–7. The dark-shaded 1σ uncertainty region is derived from sampling n = 1000 M•–M⋆ relations randomly chosen within the 1σ three-dimensional contour of the fit parameters. The red dotted lines and light-shaded region represent the best-fit intrinsic scatter of 0.69 dex (defined as  ; see Section 3.4). Right panel: the posterior distribution of the parameters defining the M•–M⋆. The solid blue line and black dashed lines of the one-dimensional distributions denote the median and 1σ uncertainties of the fit parameters, respectively. The solid contour lines in the two-dimensional distributions denote the 1σ, 2σ, and 3σ joint uncertainties.
Download figure:
Standard image High-resolution imageOur MCMC analysis yields the following values for the parameters:  ,
,  ,
,  , where ν is the orthogonal variance of the best-fit intrinsic scatter. The standard scatter is
  dex, where θ is the angle between the M•–M⋆ relation and the x-axis. Note that the standard scatter in the high-z relation is larger than that of the local relation by Reines & Volonteri (2015). The right panel of Figure 2 shows the posterior distributions. The fact that the slope m is consistent with unity indicates that the proportion between the black hole and stellar mass does not change with the size of the galaxy. In summary, we derive, with high confidence, the following high-z
M•–M⋆ relation from JWST data:
dex, where θ is the angle between the M•–M⋆ relation and the x-axis. Note that the standard scatter in the high-z relation is larger than that of the local relation by Reines & Volonteri (2015). The right panel of Figure 2 shows the posterior distributions. The fact that the slope m is consistent with unity indicates that the proportion between the black hole and stellar mass does not change with the size of the galaxy. In summary, we derive, with high confidence, the following high-z
M•–M⋆ relation from JWST data:
To test whether the local and the MCMC-inferred high-z relations are statistically different, we perform a Welch’s t-test. The Welch’s t-test, contrary to the Student’s t-test, does not assume that the two statistical populations have the same variance. For each value of the stellar mass M⋆, we ask whether the two values of the black hole mass M• predicted by the local and the high-z relations are statistically compatible, considering their uncertainties expressed in terms of (corrected) standard deviations. To perform this test, we use the statistics:
where  is the black hole mass inferred in the high-z relation and
  is the black hole mass for the local relation. Furthermore,
 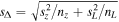 , where sz
and sL
are the corrected standard deviations computed for the high-z and the local relation, respectively. The error samplings for the local and the high-z relations are obtained with sample numbers of nL
= 244 and nz
= 21, respectively.
, where sz
and sL
are the corrected standard deviations computed for the high-z and the local relation, respectively. The error samplings for the local and the high-z relations are obtained with sample numbers of nL
= 244 and nz
= 21, respectively.
Backed by this test, we conclude that the high-z M•–M⋆ relation is statistically different from the local one at >3σ. Such a substantial deviation from the local M•–M⋆ relation is not due to the JWST sensitivity limit. In fact, the MCMC relations inferred by taking or not taking the JWST sensitivity limit into account are only shifted by ∼0.2 dex vertically from each other.
Several data points lay outside the standard scatter, which is expected. The scatter characterizes the intrinsic astrophysical processes that cause the deviation from the relation. These deviations cannot be properly accounted for by inference-derived uncertainties (see also the equivalent plot in Reines & Volonteri 2015).
Although the black holes in our sample span a mass range  , our inferred high-z relation is visually steeper than the general distribution of data points. A combination of two arguments can explain this fact. First, the algorithm we used assigns more statistical weight to lower values of M⋆. Galaxies with a lower stellar mass are intrinsically more numerous and thus more representative of the general population. Hence, the larger M⋆ data points, which are lower than the fit, have less influence in flattening the inferred relation. Second, the data points at smaller M⋆ are closer to the JWST mass limit; hence, the algorithm improves their likelihood of hosting overmassive black holes. In principle, without a sensitivity limit, we might observe lower-mass black holes; this effect makes the slope of the inferred relation steeper than the distribution of data.
The offset between the local and the high-z relations may partly be due to an underestimation of the stellar masses of the hosts (Maiolino et al. 2023a). A significant underestimation, sufficient to bring the systems back on the local relation, is, nonetheless, excluded for the following two reasons: (i) even considering all the continuum emission in these systems to be produced by stars, they are still located many sigmas above the local M•–M⋆ relation (Maiolino et al. 2023a); and (ii) significant deviations are not seen if these systems are compared with other local relations, such as the M•–σ and the M• − Mdyn (see Section 1), i.e., observational biases should not play a significant role.
Hence, we conclude that the departure from the local M•–M⋆ relation in the high-z Universe is real, i.e., not due to a selection effect in flux-limited surveys. In other words, the high-z galactic systems that JWST is detecting belong to a population of sources statistically different from the population from which the local M•–M⋆ relation was derived. Black holes are significantly overmassive with respect to the stellar content of their host galaxies in the high-z Universe.
4.2. Systematic Uncertainties
We have shown that the empirically determined, high-z M•–M⋆ relation significantly differs from the local relation by ∼2 orders of magnitude. Of course, this empirical determination is only as good as the underlying measurements of black hole mass, stellar mass, and their associated uncertainties.
Based on current data, we have no reason to believe that systematic uncertainties drive our findings. Typical uncertainties in the estimate of the black hole mass are of the order of ∼0.5 dex (Reines et al. 2013; Reines & Volonteri 2015; Maiolino et al. 2023a). Even if all the black hole masses were consistently overestimated by 0.5 dex, the inferred relation would still be located above the local one in a statistically significant way. A typical source of systematic error in black hole mass estimates derives from the use of different Hα virial relations calibrated on different data sets. For instance, the mass estimated by Reines & Volonteri (2015) is ∼0.3 dex above the relation by Greene & Ho (2004). However, since we compare the high-z data with the Reines & Volonteri (2015) relation, we eliminate this source of systematic error by recalculating all black hole masses using, consistently, that relation.
The black hole mass is estimated with the Reines et al. (2013) calibration, which uses the width and luminosity of Hα. The authors show a strong correlation between the luminosity of broad Hα components and the continuum luminosity of the AGN, allowing the use of the Hα luminosity to derive the radius of the BLR. While this method is less reliable than using the AGN continuum directly and is not yet calibrated for high-z objects, it is the only black hole mass estimate available using current data.
Stellar masses derived from templates fitted to the spectra are more uncertain. For example, in the Maiolino et al. (2023a) sample, the most significant uncertainties associated with the stellar masses are ∼1 dex, with most of them being significantly smaller. While some stellar masses may be underestimated, we argue that this cannot fully account for the departure of ∼2 orders of magnitude from the local relation. As commented by Maiolino et al. (2023a), even the stellar masses computed without accounting for the AGN in the continuum modeling are still significantly above the local relation.
4.3. Exploring the Low-mass Range of the Black Hole Distribution at z = 4–7 with JWST
JWST’s strength resides not only in expanding the redshift horizon of black holes but also in peering below the tip of their mass distribution, discovering a potentially numerous population of lower-mass objects. How low in black hole mass can we reach with JWST, given the inferred M•–M⋆ relation at high redshift?
In Figure 3, we show the expected surface density of sources with a mass lighter than the smallest black hole detected so far in the redshift range considered, i.e., JADES 62309 with a mass of ≈106.56 M⊙ at z = 5.17 (Maiolino et al. 2023a). Note that we exclude the lighter components of the candidate dual AGN in Maiolino et al. (2023a). The calculation is performed at three different redshifts representative of our sample, assuming the local (left panel) and inferred high-z (right panel) M•–M⋆ relations.
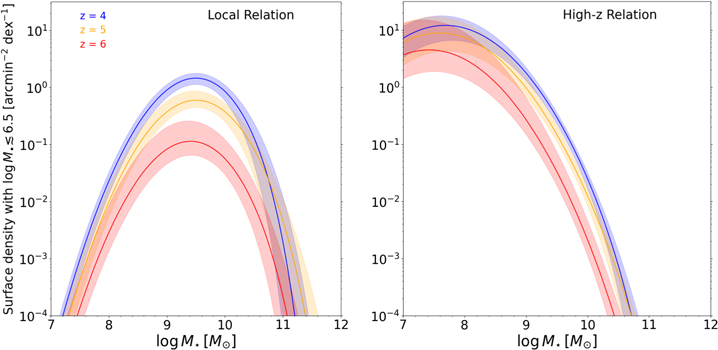
Figure 3. Left panel: expected surface density of sources with a mass M• ≲ 106.5 M⊙, i.e., lighter than the smallest SMBH in our data set: JADES 62309 (Maiolino et al. 2023a), assuming the local M•–M⋆ relation. The shaded regions account for uncertainties in the black hole mass measurement using the Hα line (Equation (2)) and the SMF (Equation (3)). The expected surface density is provided for different redshifts z ∼ 4, 5, 6, with a redshift binning of Δz = 1. Right panel: same as the left panel, but using our inferred high-z relation. The peaks of the distributions are shifted to hosts with lower stellar masses, and the surface density of observable light-mass black holes is higher.
Download figure:
Standard image High-resolution imageConsidering the local M•–M⋆ relation, all three redshift distributions peak at a host stellar mass of 109.5 M⊙: it is more likely to detect small black holes in hosts of this stellar mass.
On the contrary, the inferred high-z M•–M⋆ relation predicts that the distribution of smaller SMBHs peaks at a host stellar mass of ∼107.5 − 108 M⊙ for redshifts z = 4, 5, 6.
Since the high-z relation indicates that the black holes are ∼10−100 × overmassive compared to the stellar content of their low-z counterparts (see Section 4.1), black holes hosted by galaxies at lower stellar masses are massive enough to be detectable by JWST. In fact, recent JWST observations reported in Maiolino et al. (2023a) are distributed toward stellar masses of ∼108 M⊙. Our inferred high-z relation suggests that JWST might be able to observe galaxies with even lighter stellar and black hole masses than sources detected so far. Expanding our observations toward the low-mass region of the M•–M⋆ space will provide stronger constraints on the M•–M⋆ relation and an experimental test of our inferred relation.
Table 1 reports the number of SMBHs with mass ≲106.5
M⊙ predicted in JADES ( ) and CEERS (
 ) as a function of the three redshifts considered. Note that this calculation assumes an AGN fraction equal to unity, i.e., there is a 1-to-1 mapping between galaxies and black holes. As such, these numbers need to be considered as upper limits and include both type 1 and type 2 AGNs. We perform the calculation for the local (Reines & Volonteri 2015) and the inferred high-z
M•–M⋆ relations. We predict that current JWST surveys contain many more black holes lighter than ∼106.5
M⊙, especially at z ∼ 4. Remarkably, Maiolino et al. (2023a) report a black hole with mass ∼4 × 10⁵
M⊙, although this is part of a candidate dual AGN. This tentative detection implies that light black holes are within reach.
) as a function of the three redshifts considered. Note that this calculation assumes an AGN fraction equal to unity, i.e., there is a 1-to-1 mapping between galaxies and black holes. As such, these numbers need to be considered as upper limits and include both type 1 and type 2 AGNs. We perform the calculation for the local (Reines & Volonteri 2015) and the inferred high-z
M•–M⋆ relations. We predict that current JWST surveys contain many more black holes lighter than ∼106.5
M⊙, especially at z ∼ 4. Remarkably, Maiolino et al. (2023a) report a black hole with mass ∼4 × 10⁵
M⊙, although this is part of a candidate dual AGN. This tentative detection implies that light black holes are within reach.
Table 1. Expected Number of Observable Black Holes with Mass M• ≲ 106.5 (i.e., Lighter Than JADES 62309, the Lightest Black Hole of the Data Set; See Maiolino et al. 2023a), in JADES and CEERS, for Three Redshift Values
| Redshift | ||||
|---|---|---|---|---|
| Survey | Relation | z ∼ 4 | z ∼ 5 | z ∼ 6 |
| JADES | Local |

|

|

|
| High-z |

|

|

| |
| CEERS | Local |

|

|

|
| High-z |

|

|

| |
Note. We assume the local M•–M⋆ relation and the inferred high-z relation. The redshift binning is Δz = 1.
Download table as: ASCIITypeset image
Our inferred high-z M•–M⋆ relation yields a higher value of detectable black holes with mass M• ≲ 106.5 M⊙, compared to the local relation, at all redshifts: we predict boosting factors of 5 × at z = 4, 7 × at z = 5, and 15 × at z = 6. The difference is more evident at z ∼ 6: a search of low-mass black holes in existing JWST surveys will convey a robust test of our M•–M⋆ relation.
4.4. General Mass Distribution of Black Holes
Instead of searching for light black holes (M• < 106.5 M⊙), we now investigate the general distribution in mass for black holes detectable by JWST with M• < 108.5 M⊙. Figure 4 displays the expected surface density of sources, assuming the local (left panel) and the inferred high-z (right panel) M•–M⋆ relations.
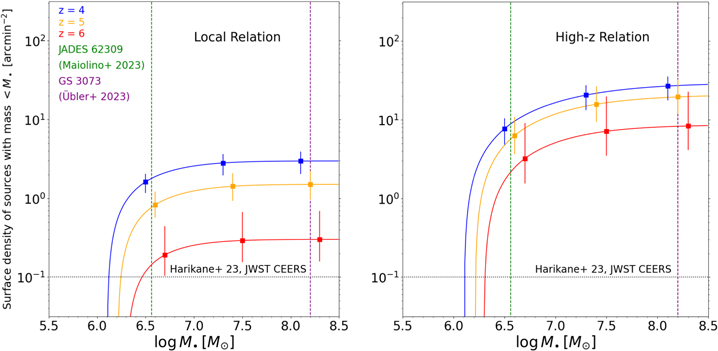
Figure 4. Left panel: expected surface density of sources with a mass <M•, for z = 4, 5, 6, assuming the local M•–M⋆ relation. The two vertical lines indicate the lightest (JADES 62309; Maiolino et al. 2023a) and heaviest (GS 3073; Übler et al. 2023) black holes included in the data set. The horizontal line indicates the surface density of sources identified by Harikane et al. (2023a) in CEERS (eight sources in  ). The 1σ error bars account for uncertainties in the black hole mass measurement using the Hα line (Equation (2)) and the SMF (Equation (3)). Right panel: same as the left panel, but using the inferred high-z relation. Again, the surface density of observable black holes is higher for all redshifts.
Download figure:
Standard image High-resolution imageFirst, we note that the current searches in JWST surveys have likely found only a fraction of the SMBHs that are detectable; to visualize this fact, we show with a horizontal dashed line the surface density of black holes detected by Harikane et al. (2023a) in CEERS (eight sources in  ). This result is independent of the assumption regarding the M•–M⋆ relation.
For the general distribution of black holes, i.e., objects with a mass M• < 108.5 M⊙, our inferred high-z relation predicts a boosting factor of 10 × at z = 4, 15 × at z = 5, and 30 × at z = 6, compared to the local relation.
The fact that current JWST surveys are predicted to contain ∼10–100 × more black holes than the ones currently detected is remarkable. Possible explanations include the following:
- 1.Accretion at a lower Eddington ratio, which makes these AGNs not easily detectable. The inferred accretion duty cycle would be 1%–10% (see, e.g., Maiolino et al. 2023a, where they estimate it as 10%).
- 2.A host galaxy that overshines the AGN, which makes them more challenging to detect (Schneider et al. 2023).
- 3.Obscuration of the central AGN, which makes them hard to identify with standard narrow-line diagnostics. In fact, high-z AGN diagnostics overlap with the local ones.
Our predictions can also be compared with results from semianalytical models. For example, Trinca et al. (2023) estimate the number of black holes detectable in JADES and CEERS within the mass range 104–108 M⊙. In particular, that study predicts that the black hole mass peaks in the mass range 106–108 M⊙, which agrees with our general mass distribution using both the local and the inferred high-z relation. However, Trinca et al. (2023) predict that the galaxy stellar mass distribution of observable sources peaks in the mass range 108–1010, which is similar to what we predict assuming the local relation.
5. Discussion and Conclusions
We used active 21 galaxies discovered at z = 4–7 by JWST in the JADES, CEERS, and GA-NIFS fields, hosting central SMBHs with Hα-determined masses, to investigate, with an MCMC approach, the high-z M•–M⋆ relation and the mass distribution of black holes, especially its low-mass end.
Our main findings are summarized as follows:
- 1.The inferred high-z M•–M⋆ relation deviates significantly (>3σ) from the local relation. This fact is not due to selection effects in a flux-limited survey. We showed that the low-z and the high-z galactic populations are statistically different.
- 2.Black holes are overmassive, by a factor ∼10–100, when compared to z ∼ 0 systems of similar stellar mass.
- 3.Our inferred high-z relation predicts, at 4 < z < 6, 5–15 × more black holes of mass ≲106.5 M⊙, and 10–30 × more with ≲108.5 M⊙, compared to the local relation. The low-mass black holes will be preferentially found in hosts of ∼107.5–108 M⊙ in stellar mass.
- 4.Searching for low-mass (≲106.5 M⊙) black holes in existing JWST fields can be a robust test of our M•–M⋆ relation.
Discoveries of single, high-z sources containing black holes, such as GN-z11 (Maiolino et al. 2023b), are outstanding and prove the power of JWST in bringing the early Universe to light. The uncovering of populations of high-z systems hosting black holes is now starting to allow more thorough investigations into their general properties and to compare them with the reality of the local Universe.
In the local Universe, past the cosmic noon, galactic systems follow, with some scatter, all the standard relations: the M•–M⋆, the M• − σ, and the M• − Mdyn. The high-z Universe offers a different view. JWST is discovering galactic systems that follow the M• − σ and the M• − Mdyn relations, but whose black holes are very overmassive with respect to the stellar content of their hosts, thus departing significantly from the M•–M⋆ relation. Velocity dispersion and dynamical mass are, thus, better tracers of black hole growth because they directly depend on the central gravitational well. Black hole growth outpaces stellar growth at first. Then, possibly with the help of galactic mergers, the stellar mass catches up, and the systems end up on the M•–M⋆ relation at low redshift. The only way to test this hypothesis is to further expand the black hole horizon.
Figure 5 offers a pictorial representation of the current black hole horizon, defined as the farthest redshift at which JWST can detect a black hole of a given mass, using the Hα broad emission line. For this qualitative estimate, we use a bolometric correction for the broad component of the Hα of 1/130 (Stern & Laor 2012; Maiolino et al. 2023a). The blue points represent the sources we used in this study, together with GN-z11 (in red), the farthest black hole with a spectroscopic confirmation (Maiolino et al. 2023b).

Figure 5. Qualitative representation of the current horizon within which black holes are detectable with JWST/NIRSpec. The galaxy + black hole systems used in this work are shown in blue. The farthest galaxy hosting an SMBH detected, GN-z11, is shown in red. The contours indicate typical heavy and light seeding distributions at z > 10. Some growth lines are also shown from the center of the seed distributions and assume several Eddington ratios (as indicated). The general distribution of lower-redshift quasars is displayed as a reference (Lyke et al. 2020; Fan et al. 2023).
Download figure:
Standard image High-resolution imageWhile the general population of quasars stacks up on the “southeast” of this chart (i.e., large black holes at lower redshift), JWST allows us to reach farther in redshift and lower in mass than ever. Because the SMBHs observed by JWST are less massive, they do not outshine their host galaxy. Hence, we can estimate most of these systems’ stellar mass.
Figure 5 also shows a qualitative representation of the mass–redshift distribution of light and heavy seeds (see, e.g., Volonteri 2010; Ferrara et al. 2014). GN-z11 can be interpreted as the evolution at a constant Eddington accretion rate of a typical heavy seed (Maiolino et al. 2023b). Additionally, the current population of JWST sources analyzed in this work can result from the evolution, at a rate between 20% Eddington and 80% Eddington, of the population of heavy seeds formed at z ∼ 20–30 (Barkana & Loeb 2000). Alternatively, it can result from the evolution close to, or slightly above, Eddington of the population of light seeds.
Unfortunately, observations at even higher redshifts of massive black holes will be needed to pinpoint the mass distribution of the early seeds (Pacucci & Loeb 2022; Fragione & Pacucci 2023). Alternatively, the shape of the high-z M•–M⋆ relation can inform us of the main formation channel of seeds (Pacucci et al. 2018; Visbal & Haiman 2018; Greene et al. 2020; King & Nealon 2021; Hu et al. 2022; Koudmani et al. 2022; Schneider et al. 2023; Scoggins & Haiman 2023). For example, recent simulations have shown that heavy seeds, with a typical mass of 105 M⊙, can initially have a mass similar to or even larger than their hosts (Scoggins et al. 2023). These systems remain overmassive, i.e., M•/M⋆ ≫ 10−4, until they merge with significantly more massive halos at z ≈ 8. In the redshift range z = 4–7 investigated in this study, we might be witnessing the slow but steady progress of these initially overmassive systems, formed from heavy seeds, toward the local M•–M⋆ relation.
We argued that the search in already-existing JWST fields for low-mass black holes with M• ∼ 106 M⊙ provides crucial insights into the shape of the scaling relations at high z. Hence, not only is JWST expanding the horizon at which we can detect black holes, but, in doing so, it is also enlarging our knowledge of the very early Universe.
Acknowledgments
F.P. acknowledges support from a Clay Fellowship administered by the Smithsonian Astrophysical Observatory. This work was also supported by the Black Hole Initiative at Harvard University, which is funded by grants from the John Templeton Foundation and the Gordon and Betty Moore Foundation. B.N. acknowledges support from an NSF Partnerships for International Research and Education (PIRE) grant OISE-1743747 and the Institute for Theory and Computation at the Harvard College Observatory. S.C. is funded by the European Union (ERC, WINGS, 101040227).
Software: Astropy (Astropy Collaboration et al. 2013, 2018, 2022); emcee (Foreman-Mackey et al. 2013).