Abstract
We present a catalog of hard X-ray serendipitous sources detected in the first 80 months of observations by the Nuclear Spectroscopic Telescope Array (NuSTAR). The NuSTAR serendipitous survey 80 month (NSS80) catalog has an unprecedented ∼62 Ms of effective exposure time over 894 unique fields (a factor of 3 increase over the 40 month catalog, NSS40), with an areal coverage of ∼36 deg2, larger than all NuSTAR extragalactic surveys. NSS80 provides 1274 hard X-ray sources in the 3−24 keV band (822 new detections compared to the previous NSS40). Approximately 76% of the NuSTAR sources have lower-energy (<10 keV) X-ray counterparts from Chandra, XMM-Newton, and Swift-XRT. We have undertaken an extensive campaign of ground-based spectroscopic follow-up to obtain new source redshifts and classifications for 427 sources. Combining these with existing archival spectroscopy provides redshifts for 550 NSS80 sources, of which 547 are classified. The sample is primarily composed of active galactic nuclei (AGNs), detected over a large range in redshift (z = 0.012–3.43), but also includes 58 spectroscopically confirmed Galactic sources. In addition, five AGN–galaxy pairs, one dual AGN system, one BL Lac candidate, and a hotspot of 4C 74.26 (radio quasar) have been identified. The median rest-frame 10−40 keV luminosity and redshift of NSS80 are 〈L10−40 keV〉 = 1.2 × 1044 erg s−1 and 〈z〉 = 0.56. We investigate the optical properties and construct composite optical spectra to search for subtle signatures not present in the individual spectra, finding an excess of redder BL AGNs compared to optical quasar surveys, predominantly due to the presence of the host galaxy and, at least in part, due to dust obscuration.
Original content from this work may be used under the terms of the Creative Commons Attribution 4.0 licence. Any further distribution of this work must maintain attribution to the author(s) and the title of the work, journal citation and DOI.
1. Introduction
A major focus of X-ray surveys over the last few decades has been understanding the origin of the cosmic X-ray background (CXB). The CXB was first discovered in the early 1960s (see Giacconi et al. 1962), several years before the identification of the cosmic microwave background (CMB; Dicke et al. 1965; Penzias & Wilson 1965;). Unlike the CMB, which is truly diffuse in origin, the CXB is found to be dominated by the emission from high-energy distant point sources (Brandt & Alexander 2015; Brandt & Yang 2021): active galactic nuclei (AGNs), the observed manifestation of the accretion of gas and dust onto a supermassive black hole (see Lynden-Bell 1969). Therefore, the CXB essentially provides a fossil record of mass accretion onto supermassive black holes throughout cosmic time. Consequently, ever since the discovery of the CXB over five decades ago, a key objective of high-energy astrophysics has been to measure the properties and evolution of AGNs throughout cosmic time using sensitive X-ray observations.
Huge progress in the resolution of the CXB has been made using X-ray telescopes at low energies (≲10 keV). The most sensitive X-ray surveys with Chandra (e.g., Hickox & Markevitch 2007; Cappelluti et al. 2017; Luo et al. 2017) and XMM-Newton (e.g., Moretti et al. 2003; De Luca & Molendi 2004; Worsley et al. 2005) have resolved ≈70%–90% of the CXB at low energies into AGNs at z < 5–6. However, the energy flux density of the CXB peaks at 20–30 keV (see, e.g., Figure 2 of Ananna et al. 2020) and, until recently, observatories in this energy range (e.g., Swift’s Burst Alert Telescope, BAT, and INTEGRAL) had only resolved ≈1%–2% of the CXB at these energies (e.g., Burlon et al. 2011). The great breakthrough in resolving the peak of the CXB came from the Nuclear Spectroscopic Telescope Array (NuSTAR; Harrison et al. 2013). NuSTAR is the first orbiting observatory with focusing optics and significant collecting area at >10 keV, allowing for a ≈2 orders of magnitude improvement in sensitivity and an order of magnitude improvement in angular resolution over previous nonfocusing hard X-ray missions. Importantly, the high-energy coverage at 3−79 keV means that NuSTAR selects AGNs almost irrespective of the absorbing column as it peels back the curtain of gas and dust, missing only the most heavily obscured systems (with line-of-sight column densities of NH ≥ 1023 cm−2). This has opened up the possibility to study large, cleanly selected samples of high-energy emitting AGNs in the distant Universe.
The NuSTAR extragalactic survey is the largest scientific project undertaken to date with NuSTAR (Harrison et al. 2013, 2016). It has resolved ≈35% of the CXB at 8−24 keV (Harrison et al. 2016), provided the first measurements of the >10 keV AGN luminosity function at z > 0.1 (Aird et al. 2015), and identified heavily obscured AGNs (e.g., Civano et al. 2015; Lansbury et al. 2017a; Masini et al. 2018). There are two main components to the NuSTAR extragalactic survey: (i) dedicated surveys of well-studied blank fields (≈3 deg2) including COSMOS (Civano et al. 2015), ECDFS (Mullaney et al. 2015), Extended Groth Strip (EGS; J. Aird et al. 2024, in preparation), GOODS-N (J. Aird et al. 2024, in preparation), and Ultra Deep Survey (UDS; Masini et al. 2018); and (ii) a wide-area “serendipitous survey” performed by searching archival NuSTAR observations for background X-ray sources (Alexander et al. 2013; Lansbury et al. 2017b, hereafter L17). The serendipitous survey is the largest component of the extragalactic survey program, providing the majority (≈75%–80%) of NuSTAR-detected sources. 42 It provides a combination of deep and shallow wide-area coverage, which fills out the LX–z plane and identifies rare CXB source populations not detected in the smaller-area dedicated NuSTAR surveys. For example, our first full catalog, the 40 month serendipitous survey catalog (hereafter NSS40; Lansbury et al. 2017b) contained 497 sources over 13 deg2, already a factor >4 larger volume than the dedicated surveys.
Here we provide an update to L17 with the 80 month serendipitous survey catalog (hereafter NSS80). Due to an increase in the fraction of General Observer (GO) observations compared to NSS40, the areal coverage (∼36 deg2), integrated exposure (∼62 Ms), number of fields (894), and number of sources (1274) in NSS80 are a factor ≈3 larger than those presented in L17. The most natural comparison survey to NSS80 is the Swift-BAT survey (Baumgartner et al. 2013; Oh et al. 2018), which has identified ≈1600 sources at >10 keV in 105 months of observations over the entire sky. Comparable serendipitous X-ray surveys have also been undertaken and regularly updated with Chandra (Evans et al. 2010, 2019), XMM-Newton (Webb et al. 2020), and Swift’s X-Ray Telescope (XRT; Evans et al. 2014, 2020), but at lower X-ray energies. A substantially greater number of X-ray sources are detected in these surveys (≈200,000–550,000) due to their larger areal coverage and/or greater relative X-ray sensitivity than NSS80 at <10 keV. These catalogs, both individually and in combination, provide a wealth of resources to the X-ray astronomy community, greatly improving the range of possible studies. The NuSTAR serendipitous survey (higher energy than Chandra, XMM-Newton, and Swift-XRT; more sensitive and higher resolution than Swift-BAT) is an important member of that lineup.
Our aim in this paper is to present an update to the NuSTAR serendipitous survey catalog, including salient information on the reduction of the NuSTAR data and construction of the catalog, the identification of multiwavelength counterparts, spectroscopic follow-up observations and identifications, in addition to some brief scientific analyses to motivate further in-depth studies with NSS80. This approach is consistent with our previous NuSTAR survey work (e.g., Alexander et al. 2013; Civano et al. 2015; Harrison et al. 2016; Lansbury et al. 2017b; Masini et al. 2018). In Section 2, we detail the NuSTAR observations, data reduction, and source detection to construct NSS80. We search for counterparts at lower X-ray energies from Chandra, XMM-Newton, and Swift-XRT, described in Section 3.1, and utilize a probabilistic approach with Nway to reliably crossmatch to infrared (IR) and optical counterparts, described in Section 3.2. 43 To obtain spectroscopic identifications for the NSS80 sources (redshifts and classifications), we undertake an extensive follow-up campaign with ground-based optical telescopes at multiple latitudes (Section 3.3). To characterize the properties of the NSS80 sources, we use X-ray, multiwavelength photometry, and optical spectroscopy in Section 4. The basic X-ray properties of the extragalactic NSS80 sample are given in Section 4.1, the mid-IR (MIR) properties of the sources are examined in Section 4.2, and in Section 4.3 we explore the optical properties of the AGNs, with a particular focus on red quasars and the utilization of composite spectra to determine the origin of their observed optical colors. Finally, in Section 5 we draw conclusions and summarize our results. We assume a concordance flat Λ cosmology with H0 =70 km s−1 Mpc−1 , ΩM = 0.3, and ΩΛ = 0.7.
2. The NuSTAR Data
The NuSTAR observatory (Harrison et al. 2013) was launched in 2012 and consists of two grazing-incidence telescopes that focus X-rays onto two focal-plane modules (FPMA and FPMB) which cover a coaligned field of view of  . NuSTAR is sensitive to photons across the 3−79 keV energy range and achieves an angular resolution of 18″ FWHM and a half-power diameter of 58″, which enables 2 orders of magnitude improvement in sensitivity over previous X-ray missions with sensitivity to hard (≳10 keV) energies. In this work, we present our analysis and results for the 3−8 keV (soft band), 8−24 keV (hard band), and 3−24 keV (full band) energy bands (following the energy bands adopted in previous NuSTAR survey work; see Alexander et al. 2013; Luo et al. 2014; Aird et al. 2015; Lansbury et al. 2015, 2017b; Harrison et al. 2016), with the 3−24 keV band being our main focus since it provides the best sensitivity for the detection of relatively faint sources in the NuSTAR extragalactic surveys.
44
. NuSTAR is sensitive to photons across the 3−79 keV energy range and achieves an angular resolution of 18″ FWHM and a half-power diameter of 58″, which enables 2 orders of magnitude improvement in sensitivity over previous X-ray missions with sensitivity to hard (≳10 keV) energies. In this work, we present our analysis and results for the 3−8 keV (soft band), 8−24 keV (hard band), and 3−24 keV (full band) energy bands (following the energy bands adopted in previous NuSTAR survey work; see Alexander et al. 2013; Luo et al. 2014; Aird et al. 2015; Lansbury et al. 2015, 2017b; Harrison et al. 2016), with the 3−24 keV band being our main focus since it provides the best sensitivity for the detection of relatively faint sources in the NuSTAR extragalactic surveys.
44
In the following subsections, we outline the selection of the NuSTAR observations utilized in NSS80 (Section 2.1), describe the data-processing and source-detection approaches (Section 2.2), summarize the properties of the serendipitous survey source catalog (Section 2.3), and highlight key changes between the NSS40 and NSS80 catalogs (Section 2.4).
2.1. The Serendipitous Survey Observations
The NSS80 comprises observations taken by NuSTAR over the period from 2012 July to 2019 March and provides a significant update over the NSS40 reported in L17 (2012 July–2015 November).
The NuSTAR serendipitous survey is constructed by searching the background regions for sources that are not associated with the original science target in almost every NuSTAR pointing that is not associated with a dedicated survey field. Following L17, we excluded observations from the following:
- 1.
- 2.
- 3.The Norma Arm survey (Fornasini et al. 2017).
- 4.Fields where the total counts exceed 106 within 120″ of the on-axis position due to a bright science target.
In addition, prior to processing the data, we also excluded solar system fields (i.e., solar, lunar, and planetary observations), nebular fields (e.g., supernova remnants), galaxy clusters, and fields of nearby galaxy nuclei (e.g., M31). We further excluded fields found to have bad exposure maps (i.e., bad/hot pixels in exposure maps) or if more than two-thirds of the field is contaminated by excess background emission (see Section 2.2 and Figure 3).
Table 1 provides a summary of the NuSTAR serendipitous survey information. Overall, NSS80 comprises 1457 individual NuSTAR exposures, performed over 894 unique fields, the majority of which come from post-NSS40 observations. These fields yield an overall sky coverage of 36 deg2 and a cumulative exposure time of 62.0 Ms, both a factor of ∼3 increase over NSS40 as shown in Table 1. Figure 1 shows how the number of fields included in the NSS samples has gradually increased over time, while the average exposure per pointing has remained roughly constant, driving this overall increase in both the sky coverage and total exposure time. A key contribution to the increase in the number of fields with time is the larger number of GO versus Legacy observations, since the dedicated Legacy survey fields (described above) are excluded from the serendipitous survey. A further contribution to the increased area of NSS80 can be attributed to the Swift-BAT snapshot survey (e.g., Oh et al. 2018), which is a Legacy survey comprising multiple short exposures. Furthermore, two distinctive spikes in the number of fields are evident: spike 1 (bin 2) includes 128 exposures before GO observations were undertaken with NuSTAR during the period 2013 January–August, and spike 2 (bin 10) includes 193 Cycle 3 GO observations performed during the period 2017 August–2018 February. These spikes coincide with a decrease in the average exposure time, indicating that more shallow observations were scheduled in these periods.
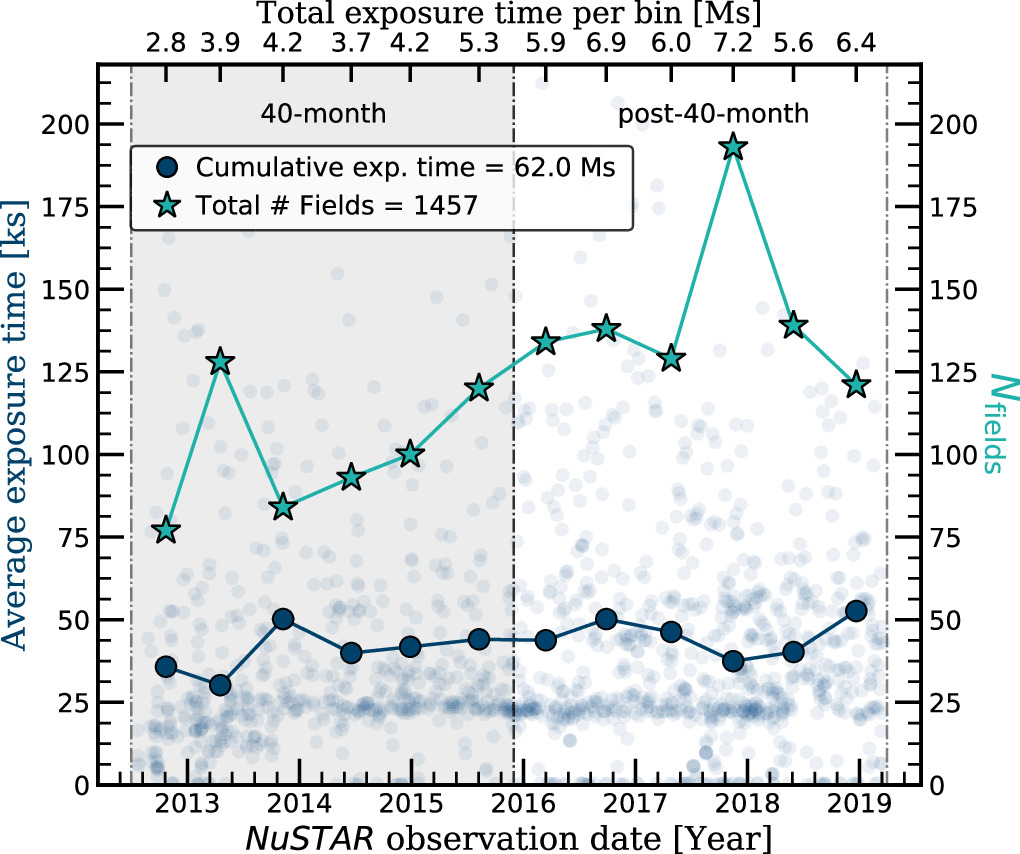
Figure 1. The average exposure time (blue circles) and the number of NuSTAR exposures (green stars) roughly per semester over the full 80 month period. In general, the average exposure time shows little variation between the 40 month (shaded gray area) and post-40 month observations, while we see an increase in the number of exposures from the 40 month to the post-40 month survey, resulting in an increase in the total exposure time per semester which can be utilized for the NuSTAR serendipitous survey. In total, the 80 month serendipitous survey includes 1457 individual exposures with a cumulative exposure time of 62 Ms.
Download figure:
Standard image High-resolution imageTable 1. Comparison of Included Observations in the NSS40 and NSS80 Surveys
| NSS40 | Post-NSS40 | NSS80 | ||
|---|---|---|---|---|
| (L17) | ||||
| (1) | Obs. start date | 2012/08 | 2015/12 | 2012/08 |
| (2) | Obs. end date | 2015/11 | 2019/04 | 2019/04 |
| (3) | Individual exposures | 510 | 947 | 1457 |
| (4) | Unique fields | 331 | 563 | 894 |
| (5) | Cumulative exp. time | 20.4 Ms | 41.6 Ms | 62.0 Ms |
| (6) | Sky coverage | 13 deg2 | 22 deg2 | 36 deg2 |
Note. Rows (1) and (2): observation date range for specific survey. Row (3): number of individual exposures. Row (4): number of unique fields, each with contiguous coverage comprised of one or more NuSTAR exposures. Row (5): cumulative exposure time in megaseconds. Row (6): total sky area coverage in deg2.
Download table as: ASCIITypeset image
Table 2 lists the individual exposures in alphabetical order for the first five unique fields (i.e., comprising nonoverlapping pointings) in NSS80 (the full table is made available online) and provides details including the number of observations and the number of serendipitous sources detected in each unique field. For 28% (247/894) of the fields there are multiple NuSTAR exposures, ranging between two and 15 observations, which are combined together into a single mosaic (see Section 2.2 and Figure 3). The serendipitous survey fields have a median exposure time of 34 ks but cover a wide range in individual exposure times (from ∼100 s to 1 Ms).
Table 2. Details of the Individual NSS80 NuSTAR Observations for the First Five Unique Fields
| ID | Science Target | NSS40 | Nobs | Obs. ID | Obs. Start Date | R.A. | Decl. | b |

| Nserendips |
|---|---|---|---|---|---|---|---|---|---|---|
| (deg) | (deg) | (deg) | (ks) | |||||||
| (1) | (2) | (3) | (4) | (5) | (6) | (7) | (8) | (9) | (10) | (11) |
| 1 | 1A_0535p262_SADA_18360 | ... | 2 | ... | ... | 82.00 | 26.00 | −4.87 | 0.9 | 0 |
| 1a | ... | ... | ... | 90401371001 | 2018 Dec 26 | ... | ... | ... | 0.2 | ... |
| 1b | ... | ... | ... | 90401371002 | 2018 Dec 27 | ... | ... | ... | 0.7 | ... |
| 2 | 1E1048d1m5937 | ... | 5 | ... | ... | 162.53 | −59.89 | −0.52 | 397.9 | 9 |
| 2a | ... | ... | ... | 30001024003 | 2013 Jul 17 | ... | ... | ... | 25.7 | ... |
| 2b | ... | ... | ... | 30001024002 | 2013 Jul 17 | ... | ... | ... | 26.6 | ... |
| 2 c | ... | ... | ... | 30001024005 | 2013 Jul 19 | ... | ... | ... | 167.7 | ... |
| 2d | ... | ... | ... | 30001024007 | 2013 Jul 25 | ... | ... | ... | 119.1 | ... |
| 2e | ... | ... | ... | 90202032002 | 2016 Aug 05 | ... | ... | ... | 58.9 | ... |
| 3 | 1E1530m085 | 303 | 1 | 60061265002 | 2015 Aug 07 | 233.34 | −8.70 | 36.88 | 23.1 | 0 |
| 4 | 1E161348m5055 | ... | 3 | ... | ... | 244.37 | −50.92 | −0.27 | 283.2 | 3 |
| 4a | ... | ... | ... | 90201028002 | 2016 Jun 25 | ... | ... | ... | 70.7 | ... |
| 4b | ... | ... | ... | 30301017002 | 2017 Jun 02 | ... | ... | ... | 70.3 | ... |
| 4 c | ... | ... | ... | 30301013002 | 2018 Apr 29 | ... | ... | ... | 142.3 | ... |
| 5 | 1E1841m045 | ... | 6 | ... | ... | 280.33 | −4.94 | −0.01 | 346.3 | 7 |
| 5a | ... | 29a | ... | 30001025002 | 2012 Nov 09 | ... | ... | ... | 52.4 | ... |
| 5b | ... | 29b | ... | 30001025004 | 2013 Sep 05 | ... | ... | ... | 37.8 | ... |
| 5 c | ... | 29 c | ... | 30001025006 | 2013 Sep 07 | ... | ... | ... | 70.9 | ... |
| 5d | ... | 29d | ... | 30001025008 | 2013 Sep 12 | ... | ... | ... | 41.6 | ... |
| 5e | ... | 29e | ... | 30001025010 | 2013 Sep 14 | ... | ... | ... | 35.4 | ... |
| 5f | ... | 29f | ... | 30001025012 | 2013 Sep 21 | ... | ... | ... | 108.2 | ... |
Notes. Columns: (1): ID assigned to each field. For fields with multiple NuSTAR exposures (i.e., Nobs > 1), each individual component exposure is listed with a letter suffixed to the field ID (e.g., 1a and 1b). (2): object name for the primary science target of the NuSTAR observation(s). (3): ID assigned to each field in the NSS40 (L17). (4): the number of individual NuSTAR exposures for a given field. (5): NuSTAR observation ID. (6): observation start date. (7) and (8): R.A. and decl. (J2000) coordinates for the aim point, in decimal degrees. (9): the IAU Galactic latitude for the aim point, in decimal degrees (Blaauw et al. 1960). (10): exposure time (“ONTIME” in the NuSTAR image header, in kiloseconds), for a single FPM (i.e., averaged over FPMA and FPMB). For multiple exposures the total exposure time is recorded. (11): the number of serendipitous NuSTAR sources detected in a given field.
Only a portion of this table is shown here to demonstrate its form and content. A machine-readable version of the full table is available.
Download table as: Machine-readable (MRT)Typeset image
In Figure 2, we show an all-sky map of the 894 unique NuSTAR fields, color coded by average exposure time. The white filled circles represent NSS40, whereas the post-NSS40 fields are shown with filled circles. Both the NSS40 and the post-NSS40 fields comprise pointings across the whole sky, with the latter having a higher density of observations, as also shown in Figure 1. In comparison to NSS40, the number of post-NSS40 fields has increased by ≈50% for a given amount of serendipitous sources per field, e.g., 169 NSS40 fields have 1–2 detected sources, whereas 255 post-NSS40 fields have 1–2 serendipitous detections (see Section 2.2 for further information on source-detection procedures). The zoom-in panel shows the Galactic plane fields with ∣b∣ ≤ 10°: 174 of the 894 NSS80 fields (19%) lie within the Galactic plane, also a factor of ∼3 increase over that of NSS40.
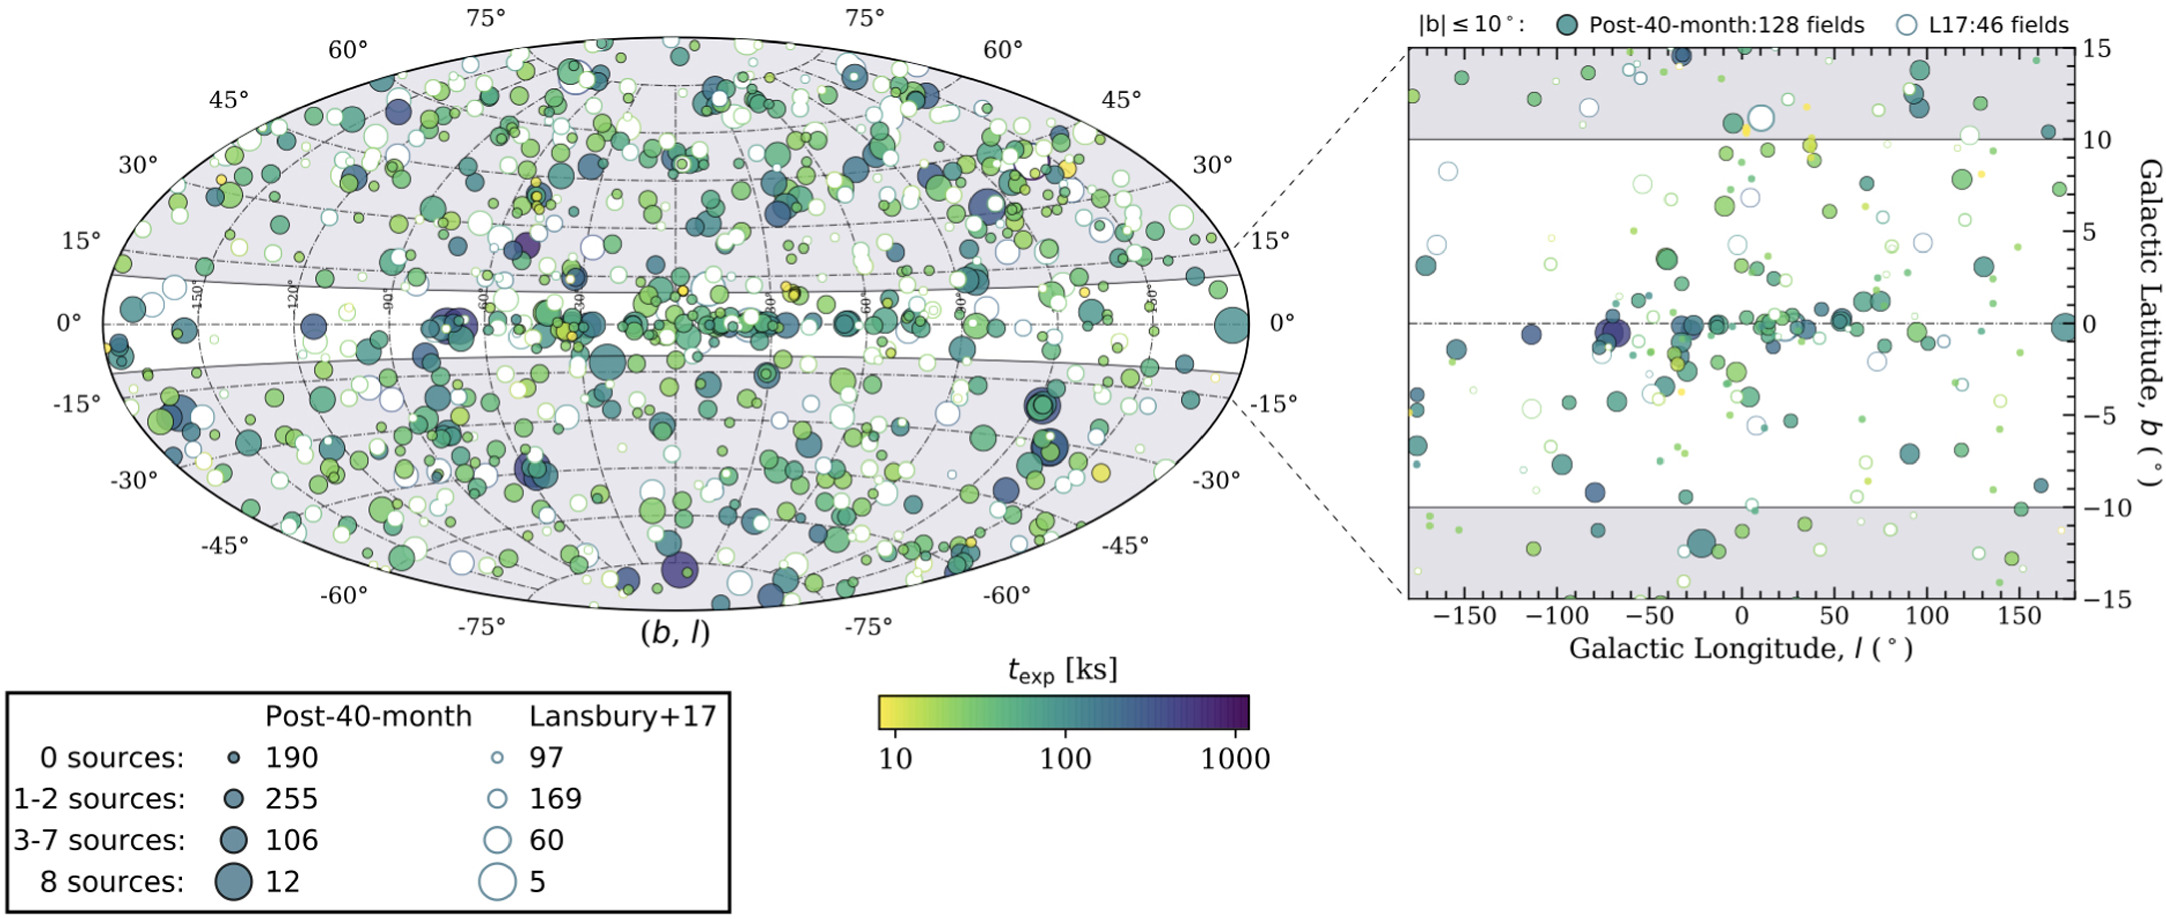
Figure 2. Aitoff projection showing the distribution of the NuSTAR serendipitous survey fields on the sky, in Galactic coordinates. The white and color-filled circles show the NSS40 and the post-NSS40 data, respectively. The circle sizes correspond to the number of sources detected in a given field, and the colors correspond to the cumulative exposure time (per FPM) for a given field. The white area highlights the region ±10° of the Galactic plane.
Download figure:
Standard image High-resolution image2.2. Data Processing and Source Detection
The reduction of the new (i.e., post-40 months) NuSTAR serendipitous fields followed the custom pipeline procedure described by L17, which is broadly consistent with the approach adopted in our previous NuSTAR survey studies (Aird et al. 2015; Mullaney et al. 2015; Harrison et al. 2016). An overview of the NuSTAR data-reduction steps is shown in Figure 3 and described briefly here, highlighting updates to the L17 procedure (see Section 2.4 below for further discussion of the differences between the final NSS80 and the prior NSS40 catalogs).
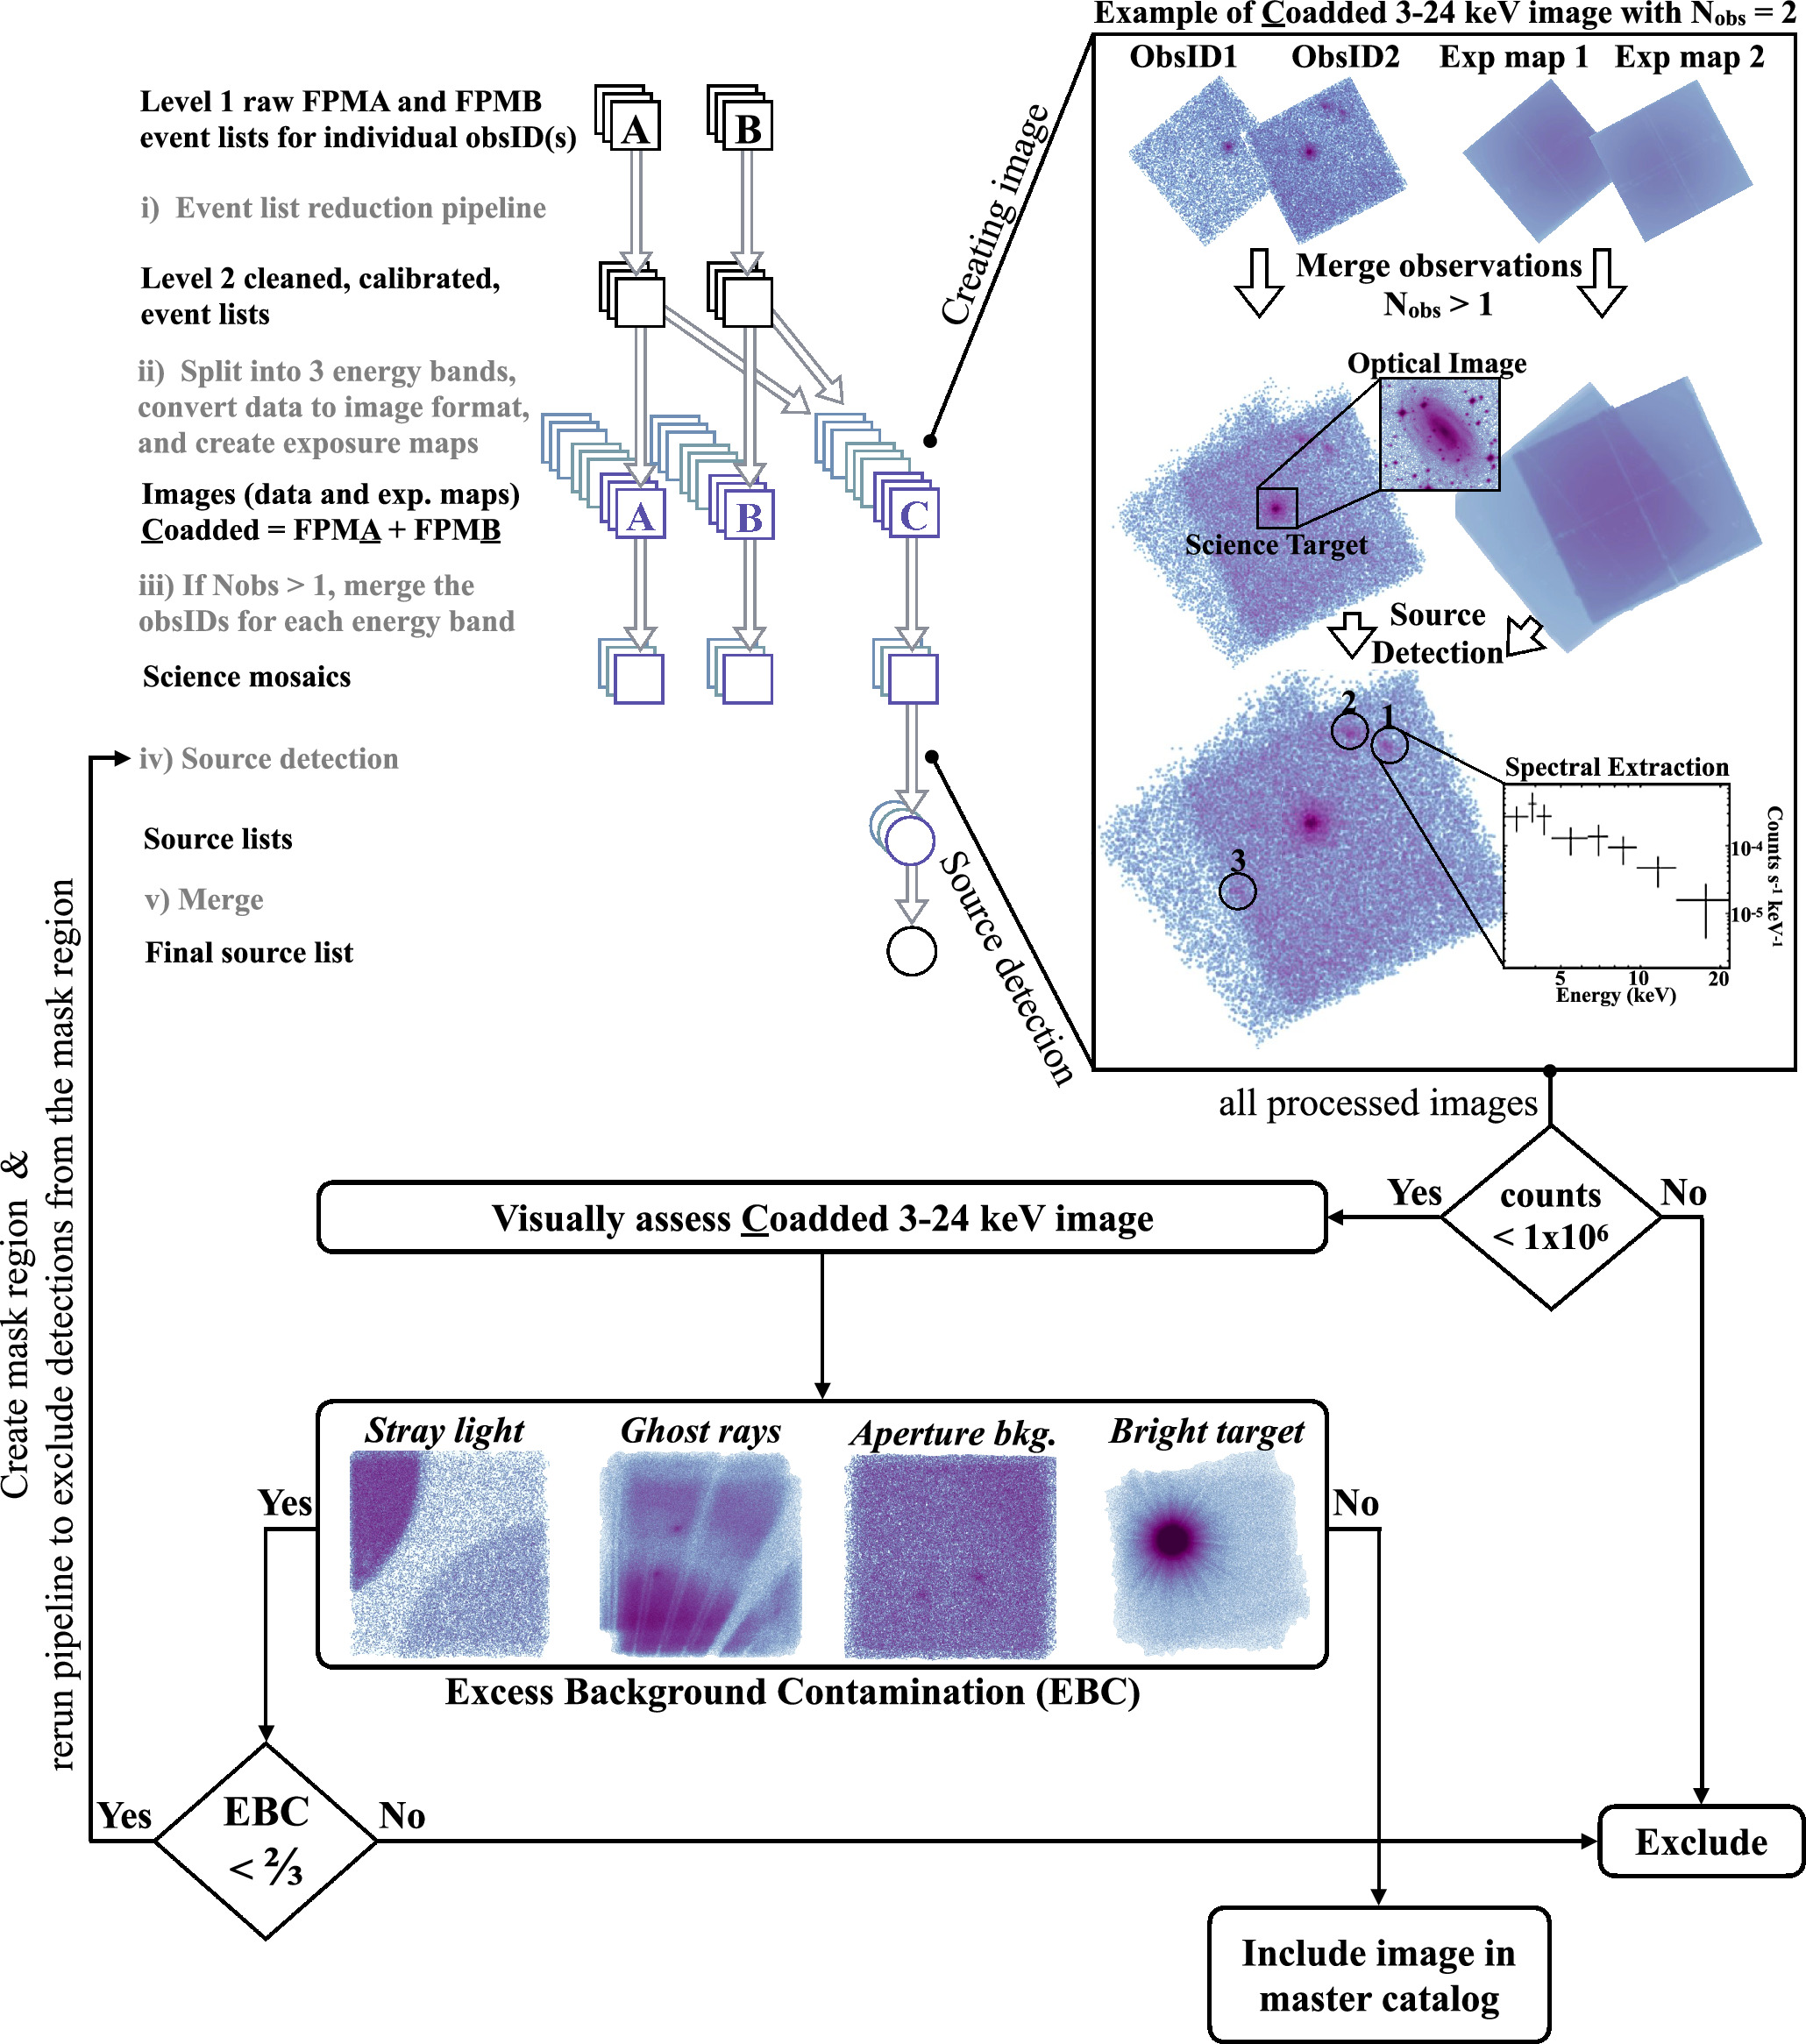
Figure 3. Upper left: flowchart schematic illustrating the NuSTAR data-processing steps undertaken to reduce individual fields for the serendipitous survey. A field can comprise multiple exposures (obsIDs) mosaicked into a single counts image, as illustrated on the right. Data from the two telescopes, FPMA and FPMB, and the coadded FPMA+B are indicated as “A”, “B,” and “C”, respectively, and the three energy bands are indicated in different colors (3−8 keV, 8−24 keV, and 3−24 keV). Upper right: example of real counts images and exposure maps associated with stages (iii)–(v) for one of the included processed fields, i.e., IC 2560. The data shown are for the coadded images and the 3−24 keV energy band only. This illustrates the mosaicking of two exposures with different exposure times and orientations. Information from both the image and the exposure map mosaics is used to perform source detection (step (iv)). In this example, three serendipitous sources (circled) are detected. Lower: each image mosaic with counts <1 × 10⁶ is visually assessed to identify regions with excess background contamination (EBC), which includes stray light, ghost rays, aperture background, and bright science target. If less than two-thirds of the image is contaminated by excess background, a mask region is created and used to mask detections from the final source list. Images with counts >1 × 10⁶ or with EBC covering more than two-thirds of the image are excluded from the catalog (38 exposures were removed in this way).
Download figure:
Standard image High-resolution imageBriefly, the raw event files were processed using the nupipeline procedure from the NuSTAR Data Analysis Software (NuSTARDAS) v1.9.2 (incorporated within the HEASoft v6.24 software suite) and CIAO v4.7.0 to produce calibrated event files.
45
These event files were used to produce counts images for each individual NuSTAR exposure (obsID), which comprises FPMA and FPMB data in the full, soft, and hard energy bands; we note the pixel size is 246. We produced exposure maps that account for the vignetting across the field of view for each energy band (at fixed representative energies of 9.88 keV, 5.42 keV, and 13.02 keV for the full, soft, and hard bands, respectively) as well as a single exposure map that does not include vignetting effects (used to estimate the background count rate at each pixel; see below).
To optimize the depth of our data sets, we coadded the images and exposure maps from the FPMA and FPMB detectors. This resulted in a total of nine images and nine exposure maps per field (three energy bands for FPMA, FPMB, and FPMA+B). 46 We produced single mosaics for each energy band by combining observations covering the same sky region within 12’ of the aim point for each obsID (step (iii) in Figure 3). There are 54 observations previously included in NSS40 which were coadded with more recent observations and reanalyzed for NSS80. We note that this can lead to small changes in the resulting source lists, including the detection of fainter sources or the loss of sources close to the detection limit (see further details in Section 2.3).
Source detection (see step (iv) in Figure 3) was performed as described in L17. To summarize, we first produced a “false-probability” map for each energy band, which gives the probability that the observed counts within a circular aperture of 20″ radius (justified by the tight core of the NuSTAR point-spread function, PSF; see Civano et al. 2015; Mullaney et al. 2015) were produced purely by a fluctuation of the background. 47 The expected background is estimated by convolving the image counts with an annular aperture of inner radius 45″ and outer radius 90″ and rescaling to the 20″ source-detection region. These background estimates incorporate counts from any bright target which will impact the sensitivity to faint serendipitous sources. Finally, we created source lists by identifying distinct regions where the false probability is less than 10−6 (equivalent to ∼5σ; see Mullaney et al. 2015, for full details) using the SExtractor software (Bertin & Arnouts 1996). To produce a master source list, we merged the source lists for the three individual energy bands and removed any sources within a 90″ radius of the science target position; see L17 and references therein for a full description. 48
Once the master source list was created, we visually inspected all the postprocessed fields (lower panel in Figure 3) to identify and mask out extended areas that exhibit a high background rate due to stray light, ghost rays, aperture background, and/or emission from the science target (illustrated in the lower panel of Figure 3). 49 These custom-made masks were then applied to both the background estimate and source-detection procedures, to produce the final source list. We excluded fields from our analysis when the excess background contamination exceeded two-thirds of the field (based on a visual estimation), resulting in the removal of 38 fields. In addition to masking excess background contamination, L17 also created custom-made regions to mask out sky areas which are clearly overlapping with extended optical/IR counterparts associated with the NuSTAR science target. However, for NSS80 we included this as a later postprocessing step to obtain an X-ray catalog independent of optical/IR information (see Section 2.3). To be consistent in the construction of NSS80, we therefore removed the masked regions for 31 of the 40 month fields with highly extended optical hosts and reprocessed the data. For further details, see Section 2.3.
Following L17, we measured count rates, fluxes, net source counts and its errors for each detected source, and estimated upper limits for sources undetected in a given band using the Bayesian approach from Kraft et al. (1991). We also applied the deblending procedure described in Section 2.3.2 of Mullaney et al. (2015), which increases the background estimates for a given source due to the contribution of any other nearby serendipitously detected sources that will not be accounted for in our smoothly varying background maps. We then reassessed the false probability of these sources using the updated background estimates and excluded sources that no longer met our false-probability detection threshold in at least one of the energy bands. This process assumes that the sources are all not capable of being resolved by NuSTAR and are considered effectively pointlike.
To determine the sensitivity curve for a given background and exposure map, we calculated the flux limit at the detection threshold for every point in the NuSTAR image, with the exclusion of the peripheral regions and any regions that are masked due to high background as described above or corresponding to extended optical galaxies and nearby galaxy clusters (see Section 2.3 below). We then summed the sensitivity curves of the 894 unique fields for each of the three energy bands to obtain the total areal coverage of the NSS80, which results in a factor ∼3 increase in sky coverage compared to NSS40 (see Figure 4). In Figure 5, we also compare NSS40 and NSS80 to the dedicated NuSTAR deep-field surveys collectively and the NuSTAR survey of the north ecliptic pole region (Zhao et al. 2021b). The NSS80 catalog has the largest areal coverage at all fluxes but is most comparable to the deep-field surveys near the low-flux tail. Consequently, the combination of NSS80 with the deep-field surveys allows for a factor ∼2 improvement in analyses of the faint end of the hard X-ray source population, in addition to an order of magnitude increase at brighter fluxes.
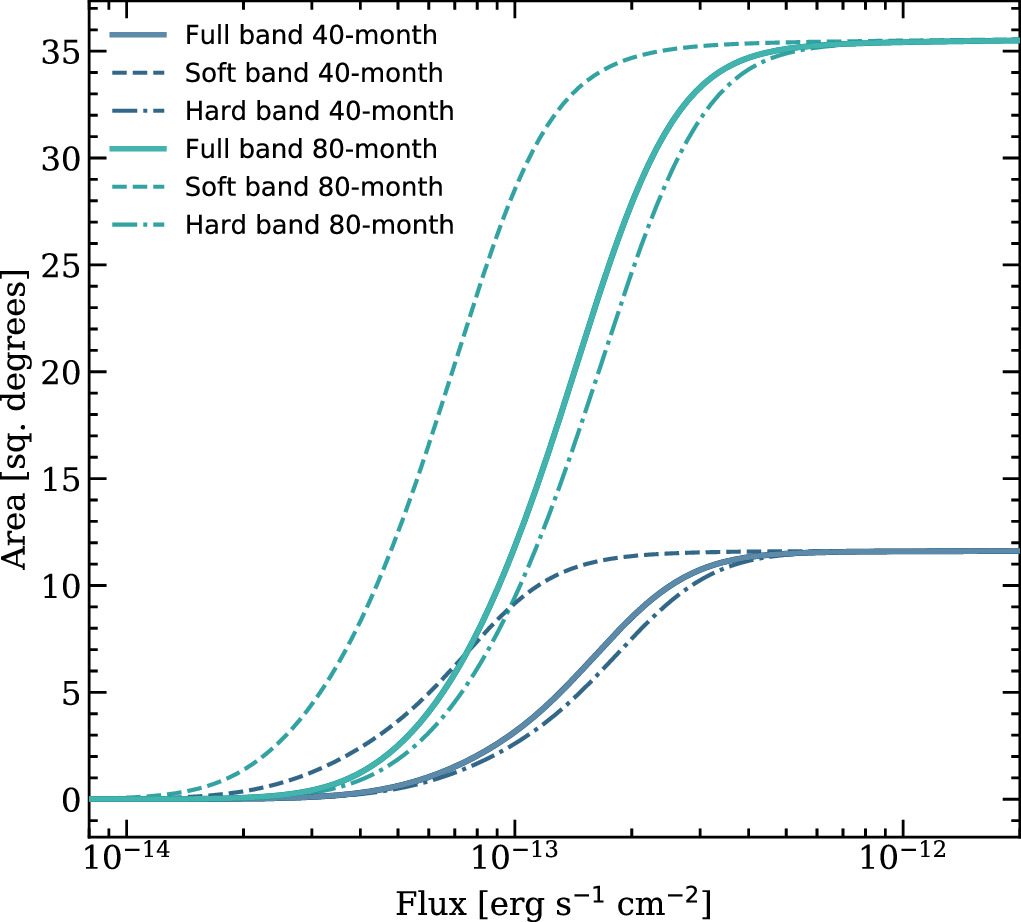
Figure 4. Sky coverage (solid angle) of the NSS40 (blue) and NSS80 (green) surveys as a function of aperture-corrected flux sensitivity, for the three main energy bands, i.e., full (3−24 keV), soft (3−8 keV), and hard (8−24 keV). Note the factor of ∼3 increase in the sky coverage with NuSTAR between the 40 month and 80 month catalogs. The sensitivity curves include fields at all Galactic latitudes for both NSS40 and NSS80 (see the curves shown in L17 for both the full survey and the subset of fields that lie outside the Galactic plane, ∣b∣ > 10°).
Download figure:
Standard image High-resolution image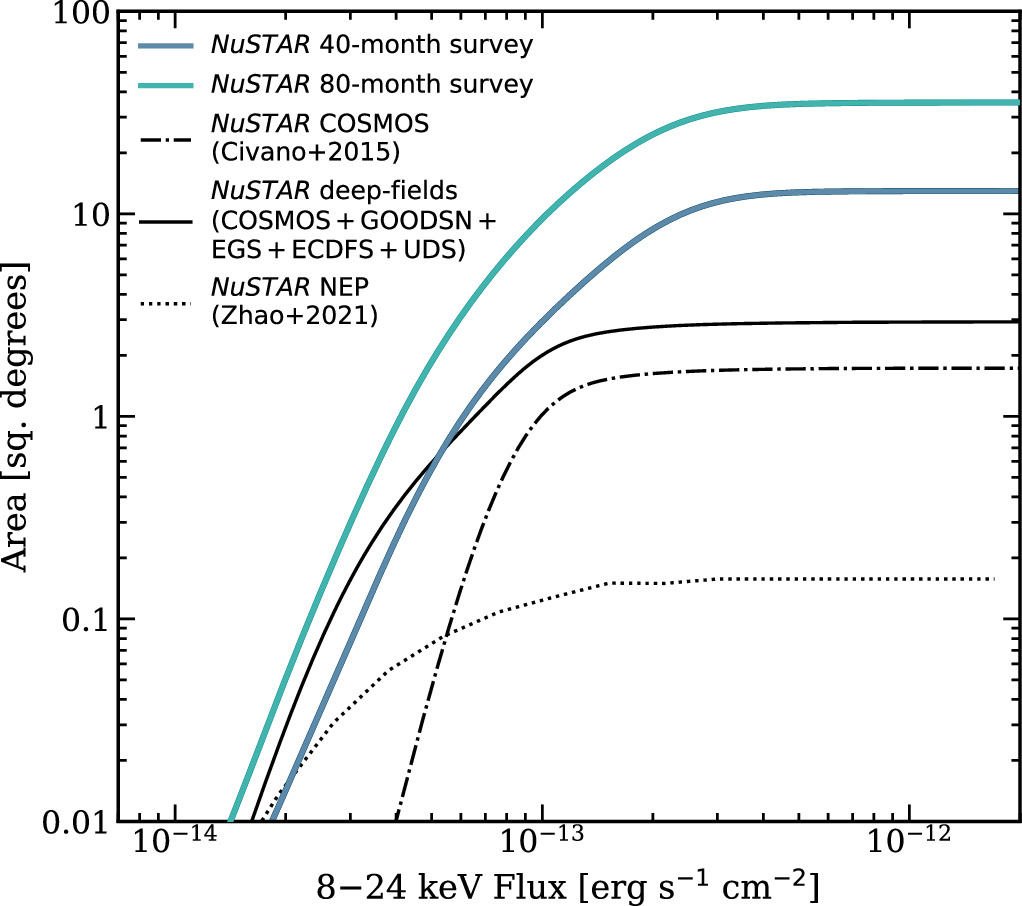
Figure 5. Sky coverage of the NSS40 and NSS80 surveys as a function of flux sensitivity, for the hard (8−24 keV) energy band. The green and blue solid lines show the area curves for the overall NSS40 and NSS80 surveys, respectively. We compare with the other completed components of the NuSTAR extragalactic surveys program, which include the following dedicated deep-field surveys: COSMOS (dashed–dotted black line), ECDFS, EGS, GOODS-N, and UDS. The total area for these deep-field surveys is shown as a black solid line. We also compare to Cycle 5 of the NuSTAR extragalactic survey of the JWST north ecliptic pole (NEP) time-domain field, shown as a dotted black line (Zhao et al. 2021b).
Download figure:
Standard image High-resolution imageWith the total area coverage, we can estimate the number of spurious X-ray detections in NSS80 due to background fluctuations. Our 36 deg2 survey corresponds to ≈370,000 independent 20″ radius regions, which with our strict (i.e., low) false-probability threshold of 10−6 (see the higher thresholds adopted in Mullaney et al. 2015 and Civano et al. 2015) corresponds to an expectation of 0.37 spurious sources in a given band (Nandra et al. 2005). We thus expect 1.11 spurious X-ray sources due to performing source detection independently over three bands, although we note that this number is conservative as the 3–24 keV band overlaps with the other energy bands and is thus not completely independent.
2.3. The Serendipitous Survey Source Catalog
The master source list comprises 1488 serendipitous NuSTAR sources that are significantly detected in at least one energy band, independently of any prior multiwavelength information. Based on findings in L17, the majority of the X-ray-detected sources in NSS80 are expected to be AGNs which should reside in background field galaxies that are not associated with the science target. However, due to the high sensitivity of NuSTAR and the large areal coverage of NSS80, a small and nonnegligible fraction are X-ray emitting sources within nearby highly extended galaxies associated with the science target (e.g., X-ray binaries and ultra-luminous X-ray sources), X-ray AGNs residing in nearby galaxy clusters, or X-ray emitting sources within the Galaxy. In NSS80, we therefore distinguish between X-ray-detected sources lying within highly extended optical galaxies and nearby galaxy clusters from those hosted in fainter field galaxies. To enable easy and efficient use of NSS80, all NuSTAR sources residing in highly extended optical galaxies and galaxy clusters are placed in a secondary catalog to complement the primary catalog that is dominated by AGNs in field galaxies. To identify NuSTAR sources in highly extended optical galaxies or nearby galaxy clusters, we selected sources that lay within
- 1.the isophotal radius (D25) of RC3 galaxies (Third Reference Catalog of Bright Galaxies; de Vaucouleurs et al. 1995) where the R-band surface brightness μR = 25 mag arcsec−2, including the SMC and LMC; or
- 2.the radii of Abell clusters obtained from Abell (1958) or, if unavailable, a median value of 0
5 as a radius; or
- 3.the 2 × half-mass–radius of Galactic globular clusters (Harris 1996).
In addition, source detections from fields covering the Eta Carinae nebula (e.g., 1E1048d1m5934 and ASASSN_18fv) are also reported in the secondary catalog. Figure 6 shows example cutouts of identified fields with highly extended optical hosts. The flagged secondary serendipitous sources are marked with blue circles (the primary and L17 sources are indicated with white circles and green diamonds; refer to Figure 7) and the respective optical catalog is flagged in the left corner. We found 214 sources to be associated with highly extended galaxies, galaxy clusters, or globular clusters, and we refer to the overall catalog of these sources as the secondary NSS80 catalog; 22/214 secondary NSS80 sources were included in NSS40. By comparison, the primary serendipitous survey source catalog contains 1274 sources; hereafter, all statistics reported for NSS80 refer to the primary source catalog.
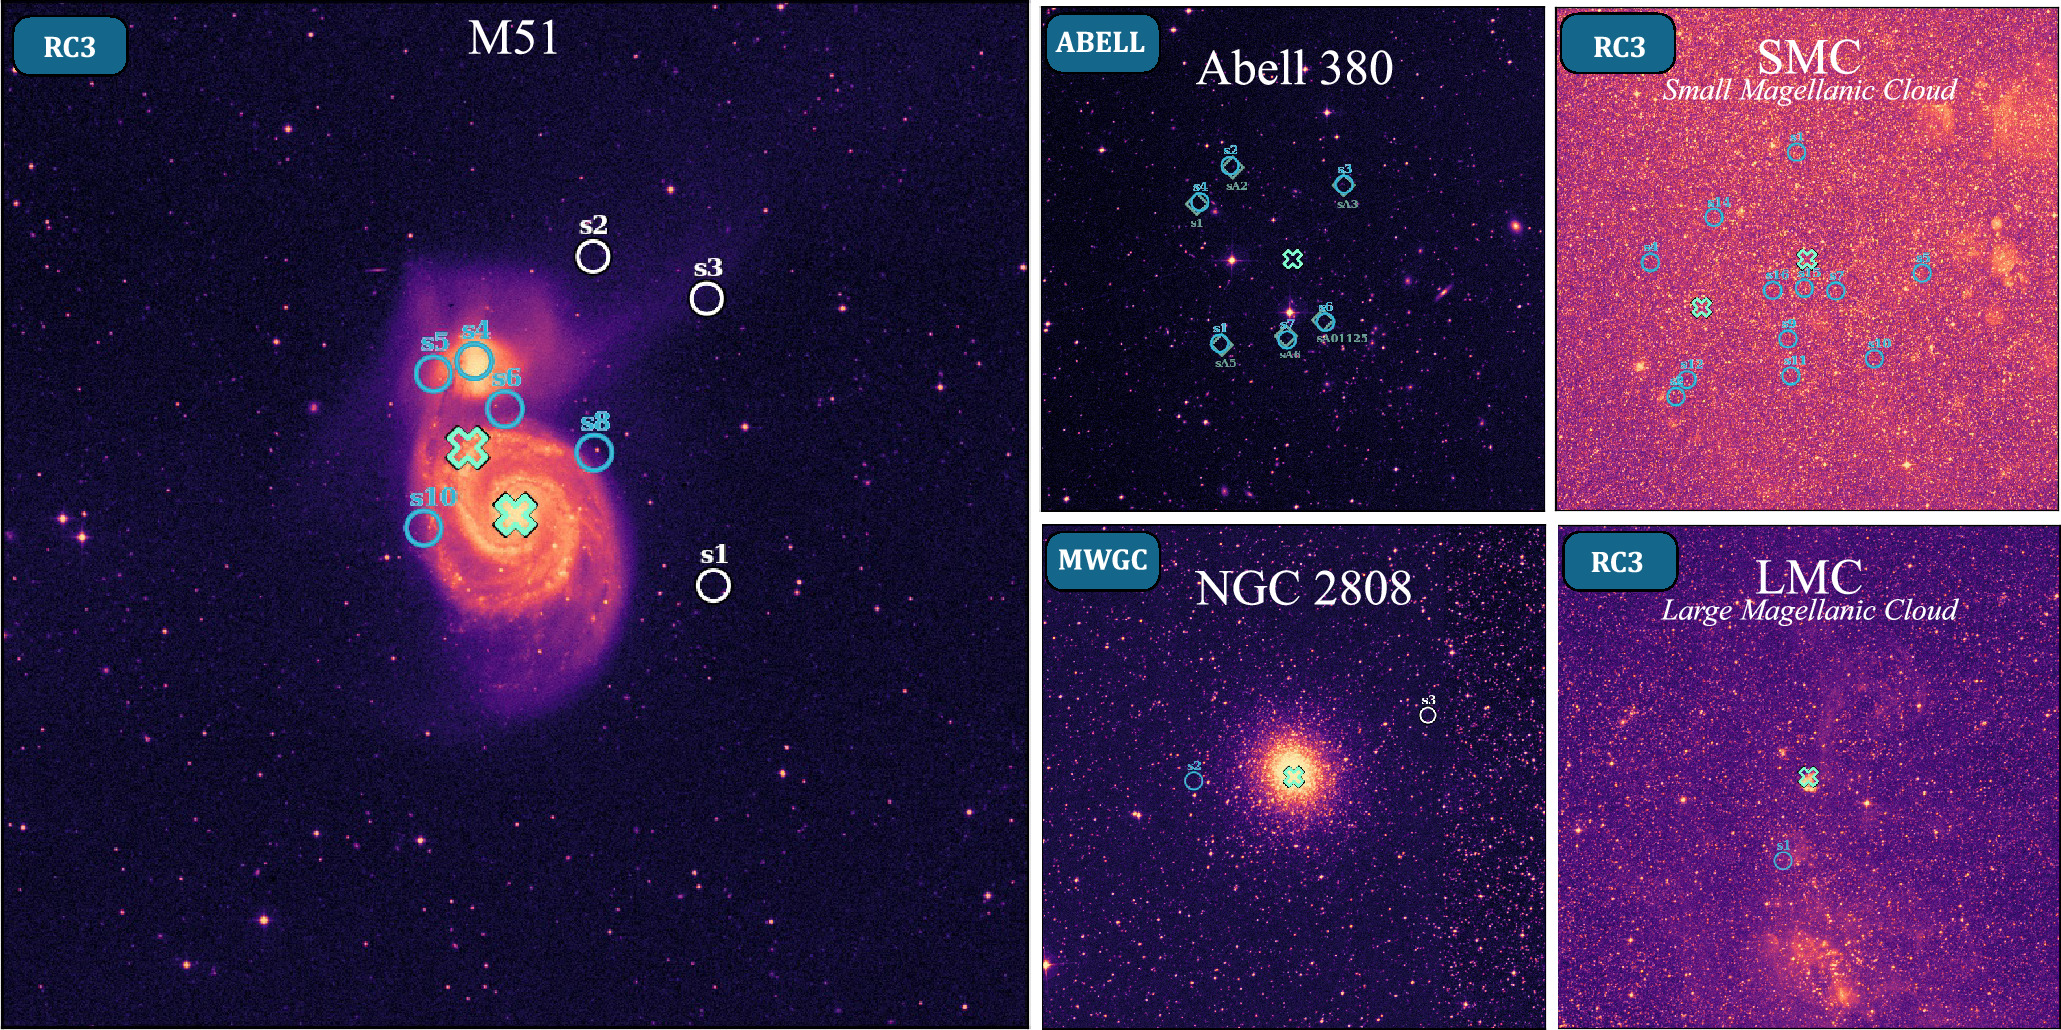
Figure 6. Example DSS R-band cutouts centered on the NuSTAR aim point for a given observation (green cross). Sources within the radius of RC3 galaxies (Third Reference Catalog of Bright Galaxies; de Vaucouleurs et al. 1995), Milky Way (Galactic) globular clusters (MWGC), or Abell clusters are flagged as secondary sources and indicated with blue circles. The white circles and the teal-green diamonds mark primary and L17 serendipitous sources, respectively (see Figure 7 for further details).
Download figure:
Standard image High-resolution image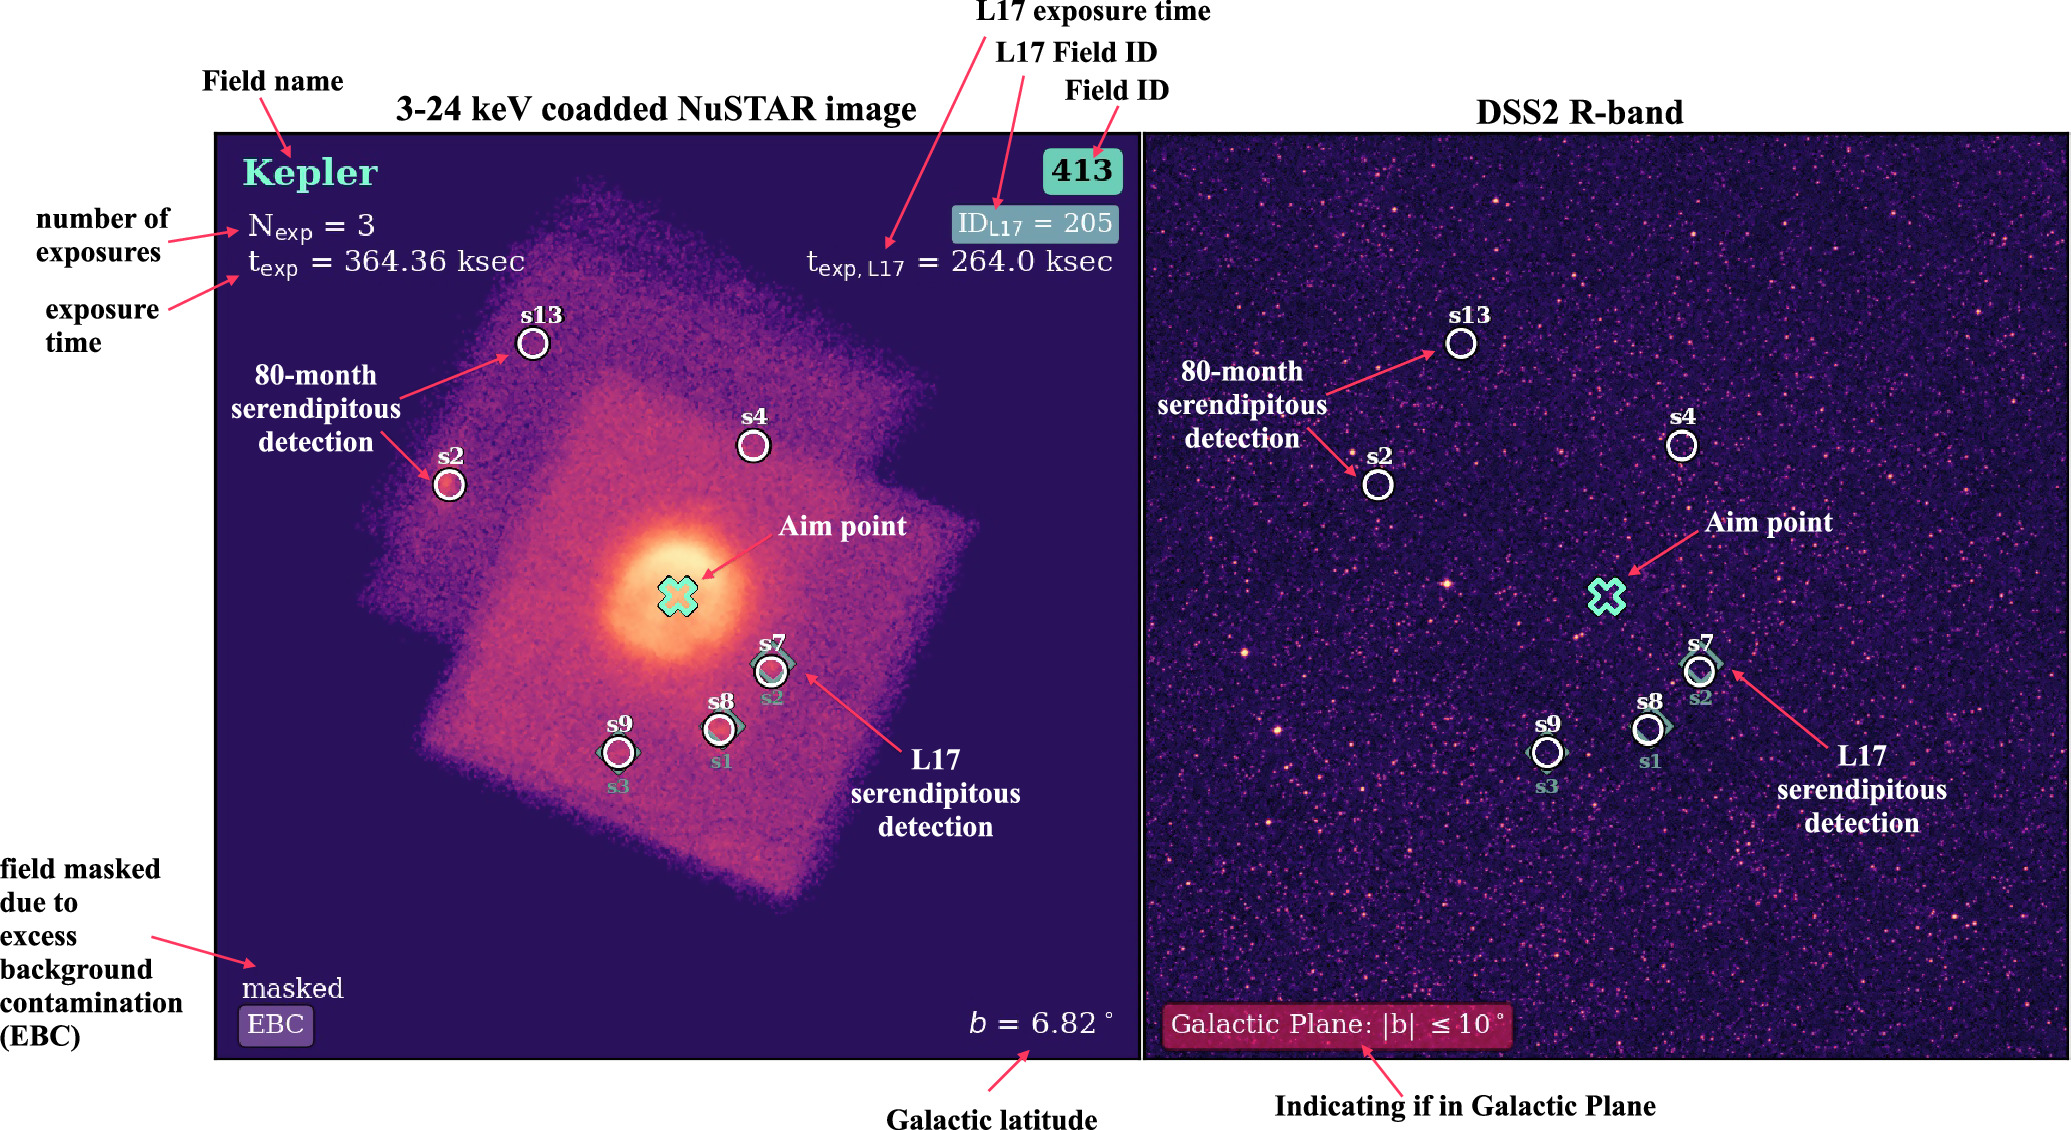
Figure 7. Example image of the NSS80 survey library. The online library will be accessible at https://www.nustar.caltech.edu/page/59. Left cutout: the 3−24 keV coadded NuSTAR image of one of the 894 NSS80 unique fields, Kepler (field ID 413);  individual exposures (each 12’ × 12’) are combined with a total exposure time of
  ks. For comparison, the NSS40 field ID and total exposure time is recorded in the top-right corner. NSS80 detections are marked with white circles and the corresponding serendip number and NSS40 detections are shown with teal-green diamonds—three additional NuSTAR serendipitous sources are detected in the new post-NSS40 data. The science target is marked with a green cross at the center of each field (aim point). Fields which are masked postprocessing due to excess background contamination (e.g., stray light, ghost rays, bright science target) are flagged in the bottom-left corner, and the Galactic latitude of the science target is shown in the bottom-right corner. Right cutout: DSS2 R-band image centered on the NuSTAR science target position. The same labeling as on the left is used to indicate NSS40 and NSS80 serendipitous sources. Galactic plane fields with latitudes ∣b∣ < 10° are flagged in the bottom-left corner.
Download figure:
Standard image High-resolution imageTable 3 provides the numbers of sources in the primary NSS80 catalog that are detected in different energy bands as well as statistics regarding optical counterparts, spectroscopic follow-up, and successful redshift measurements. The total numbers detected in the full, soft, and hard bands are 1078 (85%), 706 (55%), and 406 (32%), respectively. In total, we have obtained redshifts for 550 NSS80 sources, of which 547 can be spectroscopically classified; see Figure 16 and Section 3.3 below.
Table 3. Source Statistics for the Primary NSS80 Catalog
| Band | N | Nspec | Nz | Nz,failed |

| Nr < 22 |
|---|---|---|---|---|---|---|
| (1) | (2) | (3) | (4) | (5) | (6) | (7) |
| Any band | 1274 | 594 | 550 | 44 | 1015 | 765 |
| F+S+H | 257 | 174 | 165 | 9 | 221 | 190 |
| F+S only | 315 | 170 | 157 | 13 | 275 | 212 |
| F+H only | 81 | 35 | 32 | 3 | 68 | 46 |
| F only | 422 | 166 | 153 | 13 | 326 | 233 |
| S only | 131 | 39 | 35 | 4 | 88 | 59 |
| H only | 68 | 10 | 8 | 2 | 37 | 25 |
Notes. Columns: (1): “F,” “S,” and “H” refer to sources detected in the full (3–24 keV), soft (3–8 keV), and hard (8–24 keV) energy bands, respectively. “F + H,” for example, refers to sources detected in the full and hard bands only, but not in the soft band, and “S only” refers to sources detected exclusively in the soft band. (2): the number of sources detected post-deblending for a given band or set of bands. (3): the number of sources for which (ground-based) optical spectroscopic observations were undertaken. (4): the number of sources with spectroscopic redshift measurements and the associated percentage (including robust and uncertain counterpart associations based on our Nway analysis; see Sections 3.2 and 3.3). (5): the number of sources for which spectroscopic observations were undertaken, but which lack a reliable redshift measurement (the majority of which have faint, red continuum spectra); see Table 14 and Figure E5. (6): the number of sources with an associated optical counterpart detected in the r band; magnitudes are obtained from SDSS, Pan-STARRS, USNOB1, and the NOAO Source Catalog (NSC). (7): the number of sources with an associated optical counterpart brighter than r = 22 (detectable with current ground-based telescopes).
Download table as: ASCIITypeset image
Both the primary and secondary source catalogs are provided as machine-readable tables. In Appendix A, we give a detailed description of the columns that are provided in the catalog. In addition, we also created an online library of the 894 unique fields to allow for quick and easy verification of the X-ray and optical counterpart information for each of the NuSTAR fields. The online library will be accessible online, and in Figure 7 we show an example of one of these fields. 50 In Table 4, we give a summary of the subsets of this primary catalog, as discussed in future sections.
Table 4. Summary of the Primary Catalog Subsets and Selection Flags
| Subset | Number | Selection Flag | Section | Description |
|---|---|---|---|---|
| (1) | (2) | (3) | (4) | (5) |
| Primary (all) | 1285 | ⋯ | 2.1 | The full catalog, excluding sources within highly extended optical galaxies and clusters |
| Unique | 1274 | MainCAT | 2.1 | All unique NuSTAR detections, i.e., excluding objects with multiple optical counterpart candidates |
| Reliable | 962 | NWAY_RFlag | 3.2 | Sources with a high-probability Nway match in either CatWISE20 or PS1-DR2 |
| Spectroscopic | 594 | SpecCAT | 3.3 | Sources with spectroscopic observations |
| BL | 287 | Classification is “BL” or “BL?” | 3.3.3 | Sources with broad permitted emission-line widths (FWHM ≥ 1000 km s−1) |
| NL | 198 | Classification is “NL” or “NL?” | 3.3.3 | Sources with narrow permitted emission-line widths |
| Extragalactic | 492 | SpecCAT, zQuality!=“F” or “C” and zspec > 0 | 3.3.3 | Sources with spectroscopic redshifts indicating extragalactic origin |
Download table as: ASCIITypeset image
2.4. Key Changes in NSS80 with Respect to NSS40
As discussed in Section 2.2, when constructing the NSS80 sample we mainly adopted the same underlying methodology and data-processing procedures as in NSS40 to be consistent between the two NuSTAR serendipitous surveys. Nevertheless, there are several significant changes and updates with respect to NSS40. The key differences are summarized below:
- 1.NSS40 combined individual exposures of the same science target to increase the sensitivity. In NSS80, we extend this approach to coadd all exposures performed over the 80 month period within a 12’ search radius of the aim point (i.e., all overlapping sky regions were automatically identified and coadded), providing improved sensitivity in fields with multiple overlapping observations.
- 2.NSS40 excluded obsIDs with exposure times < 1 ks from the analysis. NSS80 now coadds all of the data (which satisfied our criteria mentioned in Section 2.1), including any low-exposure-time data.
- 3.Preceding source detection, serendipitous detections which could be associated with highly extended optical/IR hosts were manually masked and removed in NSS40. NSS80 retains these in a secondary catalog, based on a later postprocessing step; see Section 2.3.
To quantify how many serendipitous sources were added/removed due to the aforementioned alterations, we assessed overlapping fields between the NSS40 and NSS80 catalogs. Of the 331 NSS40 unique fields, we reprocessed 50 fields—six which include only NSS40 observations, while 44 include post-NSS40 observations as well. For these 50 fields, we detected an additional 111 sources: 89 sources arise from the deeper or wider data and 22 by including highly extended optical host mask regions originally excluded. Thirty-six NSS40 sources were not detected in our coadded fields; we summarize potential reasons to explain these undetected sources in Table 13. Thirty-two of the 36 undetected NSS40 sources have updated false probabilities, based on the deeper coadded data, that no longer satisfy our detection threshold, indicating that they were likely spurious detections in the NSS40 sample. This is particularly noticeable for NSS40 sources with detections in a single energy band only. Of the remaining four undetected NSS40 sources, one lies in an excess background region and three sources are on the peripheries of coadded fields.
Overall, 444/497 NSS40 sources are included in the primary NSS80 catalog, 17/497 are included in the secondary NSS80 catalog, and 36/497 sources are excluded. Additionally, L17 constructed a secondary catalog, of which 8/64 are included in the primary NSS80 and 5/64 in the secondary NSS80 catalog. Hence, in total, 452 and 22 NSS40 sources are included in the primary and secondary NSS80 catalogs, respectively.
3. The Multiwavelength Data
The compiled NSS80 catalog presented in this work is independent of prior multiwavelength information. To further explore the source properties, such as luminosities and source classifications, we require multiwavelength information to draw a more complete picture of the properties and nature of individual sources. Since our primary focus for NSS80 is extragalactic sources, we also require optical counterparts to establish redshift measurements, from which a range of other properties can be inferred. However, since the positional accuracy of NuSTAR ranges between ≈8″ and ≈20″ for bright to faint sources (90% confidence; see, e.g., Lansbury et al. 2017b), it is desirable to have more accurate X-ray positions to search for reliable optical/IR counterparts. To achieve this, we first searched for lower-energy (soft) X-ray counterparts with more accurate source positions (see Section 3.1) and, subsequently, searched for IR/optical counterparts to the X-ray sources (see Section 3.2), which were then used in our spectroscopic follow-up campaign (see Section 3.3).
3.1. Lower-energy X-Ray Counterparts
To search for lower-energy (soft) X-ray counterparts, we used Chandra, XMM-Newton, and Swift-XRT observations. We crossmatched the NuSTAR sources to (i) the Chandra Source Catalog Release 2.0 (CSC2.0; Evans et al. 2019), (ii) the Fourth XMM-Newton Serendipitous Source Catalog, Tenth Data Release (4XMM-DR10; Webb et al. 2020) and its stacked version (4XMM-DR10s; Traulsen et al. 2020), and (3) the Swift-XRT Point Source Catalog (2SXPS; Evans et al. 2020), using a search radius of 30″ for each NuSTAR source position (consistent with L17). There is a trade-off between completeness and the number of false associations when crossmatching between different surveys, and thus here and in Section 3.2 we select crossmatching radii carefully with this balance in mind. As discussed in L17, the uncertainty in the NuSTAR positions dominates the errors in the source matching. We would expect to exclude a true match in a very small fraction of cases (<0.5%) and for ∼7% of the associations to be false (L17).
We identified lower-energy X-ray counterparts for 956 NuSTAR sources between the four lower-energy X-ray catalogs. In addition, we manually identified a potential lower-energy X-ray counterpart for a further eight sources which have faint lower-energy X-ray emission (yet not statistically significant) in the vicinity of the NuSTAR position (one Chandra, four XMM-Newton, and three Swift-XRT; see Appendix A), leaving a total of 964 NSS80 sources (76%) with an identified lower-energy X-ray counterpart. Accordingly, we were unable to identify lower-energy X-ray counterparts for 310 NSS80 sources, of which 94.5% (293/310) have lower-energy X-ray coverage with either one of the lower-energy X-ray observatories: 34.8% with Chandra (ACIS), 51.3% with XMM-Newton, and 92.9% with Swift-XRT; these sources are flagged in the catalog (see Appendix A). The reason for the nondetections could be that the observations were too shallow to detect faint sources, or it could be attributed to variability given that the observations are noncontemporaneous, or it could be the result of absorption of lower-energy X-ray photons along the line of sight. Only ∼1% (17/1274) lack any form of coverage from all of these three lower-energy X-ray observatories (flagged as flag_softx_cov = null in the catalog).
Of the 964 NuSTAR sources with lower-energy X-ray counterparts, 142 sources have been detected with more than one of the lower-energy X-ray observatories: 22 from Chandra+XMM-Newton, 32 from Chandra+Swift-XRT, 51 from XMM-Newton+Swift-XRT, and 37 from all three lower-energy X-ray observatories. For these sources, we adopted the position with the highest accuracy as the “best” lower-energy X-ray counterpart, which are in the following order: CSC2.0, 4XMM-DR10s, 4XMM-DR10, and 2SXPS. Hence, of the 964 lower-energy X-ray counterparts, we have adopted the positions for 300 from CSC2.0, 317 from 4XMM-DR10s, 168 from 4XMM-DR10, 171 from 2SXPS, and eight manually measured positions using lower-energy X-ray imaging, i.e., one position from Chandra, four from XMM-Newton, and three from Swift-XRT; see row 4 in Table 5. 51
Table 5. The Number of NuSTAR Serendipitous Sources with Lower-energy X-Ray Counterparts
| CSC2.0 | 4XMM-DR10s | 4XMM-DR10 | 2SXPS | Any | ||
|---|---|---|---|---|---|---|
| (1) | NTotal/NCoverage | 300/408 | 492/651 | 394/553 | 661/949 | 956/1249 |
| (2) | NSingle | 211 | 382 | 349 | 617 | 907 |
| (3) | NMultiple | 89 | 110 | 45 | 44 | 214 |
| (4) | NBest | 300 | 317 | 168 | 171 | 956 a |
| (5) | 〈Δ R.A. 
| −0 | 0 | 0 | −0 | … |
| (6) | 〈Δdecl.〉 | 0 | −0 | 0 | 0 | … |
| (7) | 〈θ〉 | 10 | 11 | 12 | 10 | … |
Notes. Row (1): the total number of NuSTAR sources in the primary catalog with a lower-energy X-ray counterpart within a search radius of 30″ (NTotal) compared to the total number of primary NuSTAR sources with Chandra, XMM-Newton, and/or Swift-XRT coverage (NCoverage); the coverage was determined by matching sources without a soft X-ray counterpart with observations within the default radius on HEASARC, and then checking the exposure maps for nonzero exposure times at the NuSTAR coordinates. The final column enumerates the number of unique NuSTAR sources with a match in any catalog. Row (2): the number of NuSTAR sources with a single match within 30″ to the specific lower-energy X-ray catalog. Row (3): the number of NuSTAR sources with multiple matches within 30″ to the specific lower-energy X-ray catalog. Row (4): the number of NuSTAR sources where the position from a given lower-energy X-ray catalog is taken to be the most reliable (i.e., the best), and consequently the adopted, lower-energy X-ray position. The order of preference is Chandra, XMM-Newton, and then Swift-XRT. Rows (5) and (6): the mean positional offsets in R.A. (5) and decl. (6) of the NuSTAR position relative to the lower-energy X-ray counterpart (see Figure 8, top panel). Row (7): the mean angular offset between the NuSTAR and lower-energy X-ray positions in arcseconds. These values are computed for all CSC2.0, 4XMM-DR10/s, and 2SXPS matches.
a In addition to the 956 unique sources with automatically matched counterparts described in the table, a further eight sources (one Chandra, four XMM-Newton, and three Swift-XRT) were manually identified, resulting in a total of 964 NSS80 sources with a lower-energy X-ray counterpart.Download table as: ASCIITypeset image
Approximately 23% (288/1274) of the NuSTAR sources have multiple CSC2.0, 4XMM-DR10/s, or 2SXPS matches within our search radius. To identify the best counterpart for these cases, we made the assumption that the lower-energy X-ray source with the brightest flux in the highest available energy band (Chandra: 2–7 keV; XMM-Newton: 4.5–12 keV; Swift-XRT: 2–10 keV) is likely to be the correct counterpart. We note that in some cases we stand the risk of ignoring heavily obscured sources which are faint in lower energies. Three NuSTAR sources (one Chandra and two XMM-Newton) were undetected in solely the highest-energy band of the low-energy instrument, for which we used their full-band fluxes.
The results from the lower-energy X-ray crossmatching of the primary NSS80 sources are summarized in Table 5. We provide the positions, the angular separation between the lower-energy X-ray counterpart and the NuSTAR source, and the number of sources with matches in each catalog.
We show the positional offsets between the NuSTAR sources and their (a) Chandra, (b) XMM-Newton, and (c) Swift-XRT counterparts in the top panel of Figure 8, and list the mean positional offsets for all CSC2.0, 4XMM-DR10/s, and 2SXPS matches in rows (5)–(6) of Table 5 (as well as the mean angular offset between the NuSTAR and lower-energy X-ray positions; see row (7)). The sources are plotted in color, coded by the source-detection significance (the minimum false probability), and the dashed circles illustrate different search radii: 10″ (inner), 20″ (middle), and 30″ (outer). Evidently, the majority of sources for each lower-energy X-ray observatory lie within a 20″ separation radius (i.e., 94%, 84%, 90%, and 90% for CSC2.0, 4XMM-DR10s, 4XMM-DR10, and 2SXPS, respectively), particularly those with more significant detections (i.e., lower  values). The lack of significant positional offsets (i.e., see the median astrometric offsets for each sample in Figure 8) are indicative of consistent astrometry between the X-ray observatories.
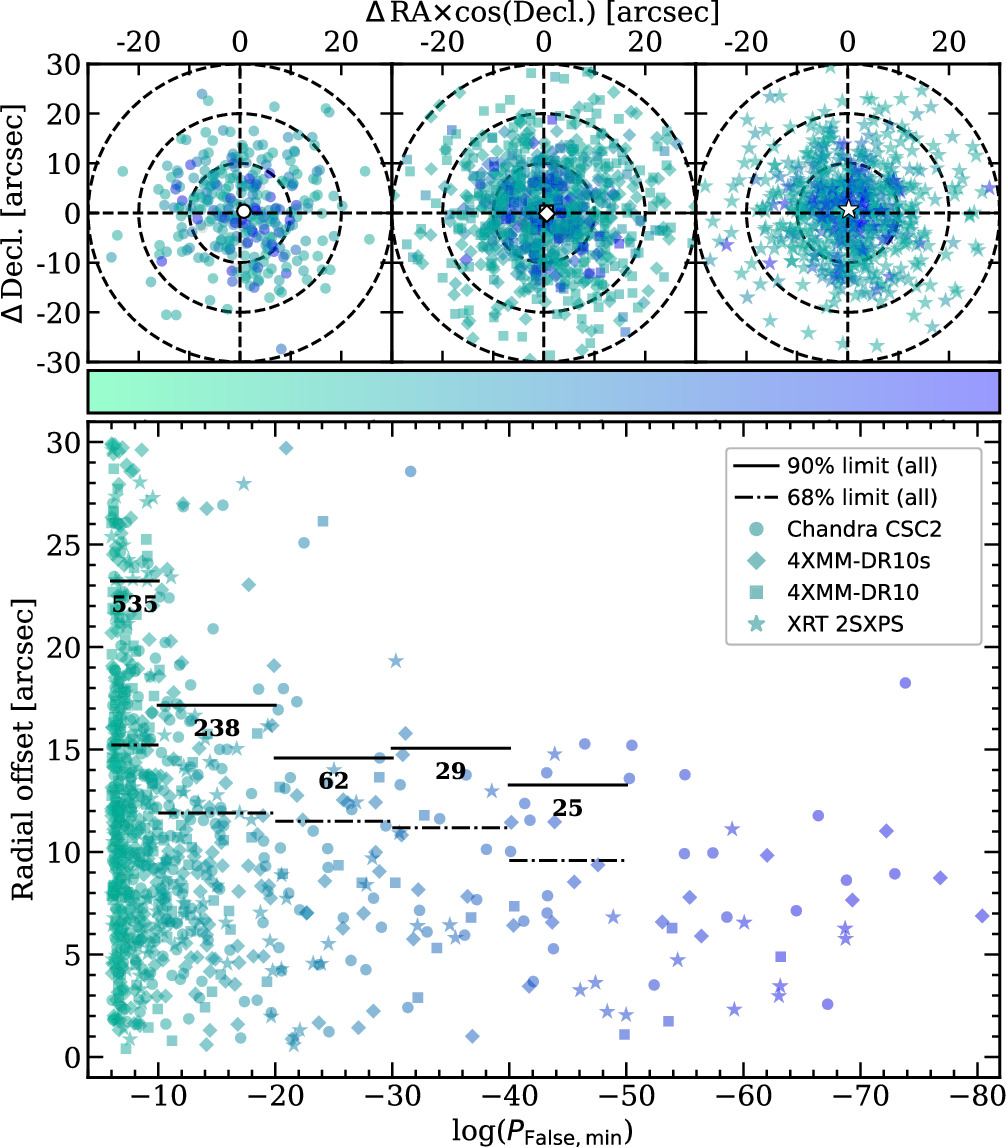
Figure 8. The positional accuracy of NuSTAR as a function of source-detection significance for the 956 NSS80 sources with lower-energy counterparts in pointed archival observations; all matched lower-energy counterparts are plotted. Top: astrometric offsets between the NuSTAR source and its matched lower-energy X-ray counterpart coordinates from (a) Chandra/CSC2.0 (circles), (b) XMM-Newton/4XMM-DR10/s (squares and diamonds), and (c) Swift-XRT/2SXPS (stars), color coded by source-detection significance. The negligible mean positional offsets are shown with white markers. Bottom: the radial offset between the NuSTAR source and its best lower-energy X-ray counterpart as a function of the minimum source-detection significance ( ) which increases toward the right (color coded from green to purple). The solid and dashed–dotted black lines indicate the 90% and 68% confidence limits, respectively, on the NuSTAR positional uncertainty for bin sizes of
  . The number of sources that each bin contains is given above the solid lines. Since the number of sources becomes small toward high
  values, we only plot bins for
  .
.
Download figure:
Standard image High-resolution imageThe bottom panel of Figure 8 shows the positional accuracy of NuSTAR as a function of the detection significance, i.e., the angular separation between the NuSTAR position and its best-identified lower-energy X-ray counterpart (having a higher likelihood of being correctly matched) versus the minimum false probability of a given source. By assuming zero uncertainty in the lower-energy X-ray position and that NSS80 sources with lower-energy counterparts are representative of the overall population, we determine the 90% and 68% confidence limits on the NuSTAR positional uncertainty in bin sizes of  , as indicated with solid and dashed–dotted horizontal black lines, respectively. From this analysis, we find that the 90% confidence limit on the NuSTAR positional uncertainty varies from 23″ to 13″ between the least-significant and the most-significant detections.
We estimated the observed-frame 3−8 keV flux (Fsoft) for the lower-energy X-ray counterparts following the methodology in L17. For CSC2.0, 4XMM-DR10/s, and 2SXPS sources, we converted to the 3−8 keV flux from the 2−7 keV, 4.5−12 keV, and 2−10 keV flux using a conversion factor of 0.83, 0.92, and 0.62, respectively. 52 , 53 We show these fluxes relative to the NuSTAR-measured fluxes for the best-identified lower-energy X-ray counterparts in Figure 9. It should be noted that 21/300 CSC2.0 counterparts are undetected in the 2−7 keV (ACIS) energy band: 1/21 source are detected in the 0.5−7.0 keV broad band (NuSTARJ184449+7212.1), 2/21 sources (NuSTARJ095712+6904.8 & NuSTARJ121425+2936.1) only have upper limits in the 0.5−7 keV broad band, while the remaining 18/21 sources only have constrained fluxes in the 0.1−10 keV HRC wide band. 54 For these sources, we used the respective bands in which they are detected to calculate the 3−8 keV fluxes. We see a reasonable agreement in the flux measurements between observatories, with the majority of the sources (80% CSC2.0, 90% 4XMM-DR10/s, and 93% 2SXPS) lying within a factor of 3 of the 1:1 relation (see Figure 9). At least a component of the observed scatter is likely to be attributed to intrinsic source variability due to the noncontemporaneous NuSTAR and lower-energy X-ray observations. In addition, Civano et al. (2015), Mullaney et al. (2015), and Fornasini et al. (2017) have shown that Eddington bias affects the lower NuSTAR fluxes, increasing the spread as the flux limit is approached. Sources at the very lowest fluxes are not commonly detected, contributing to the apparent bias with larger numbers of sources at the lowest X-ray fluxes that are above the 3:1 relation.
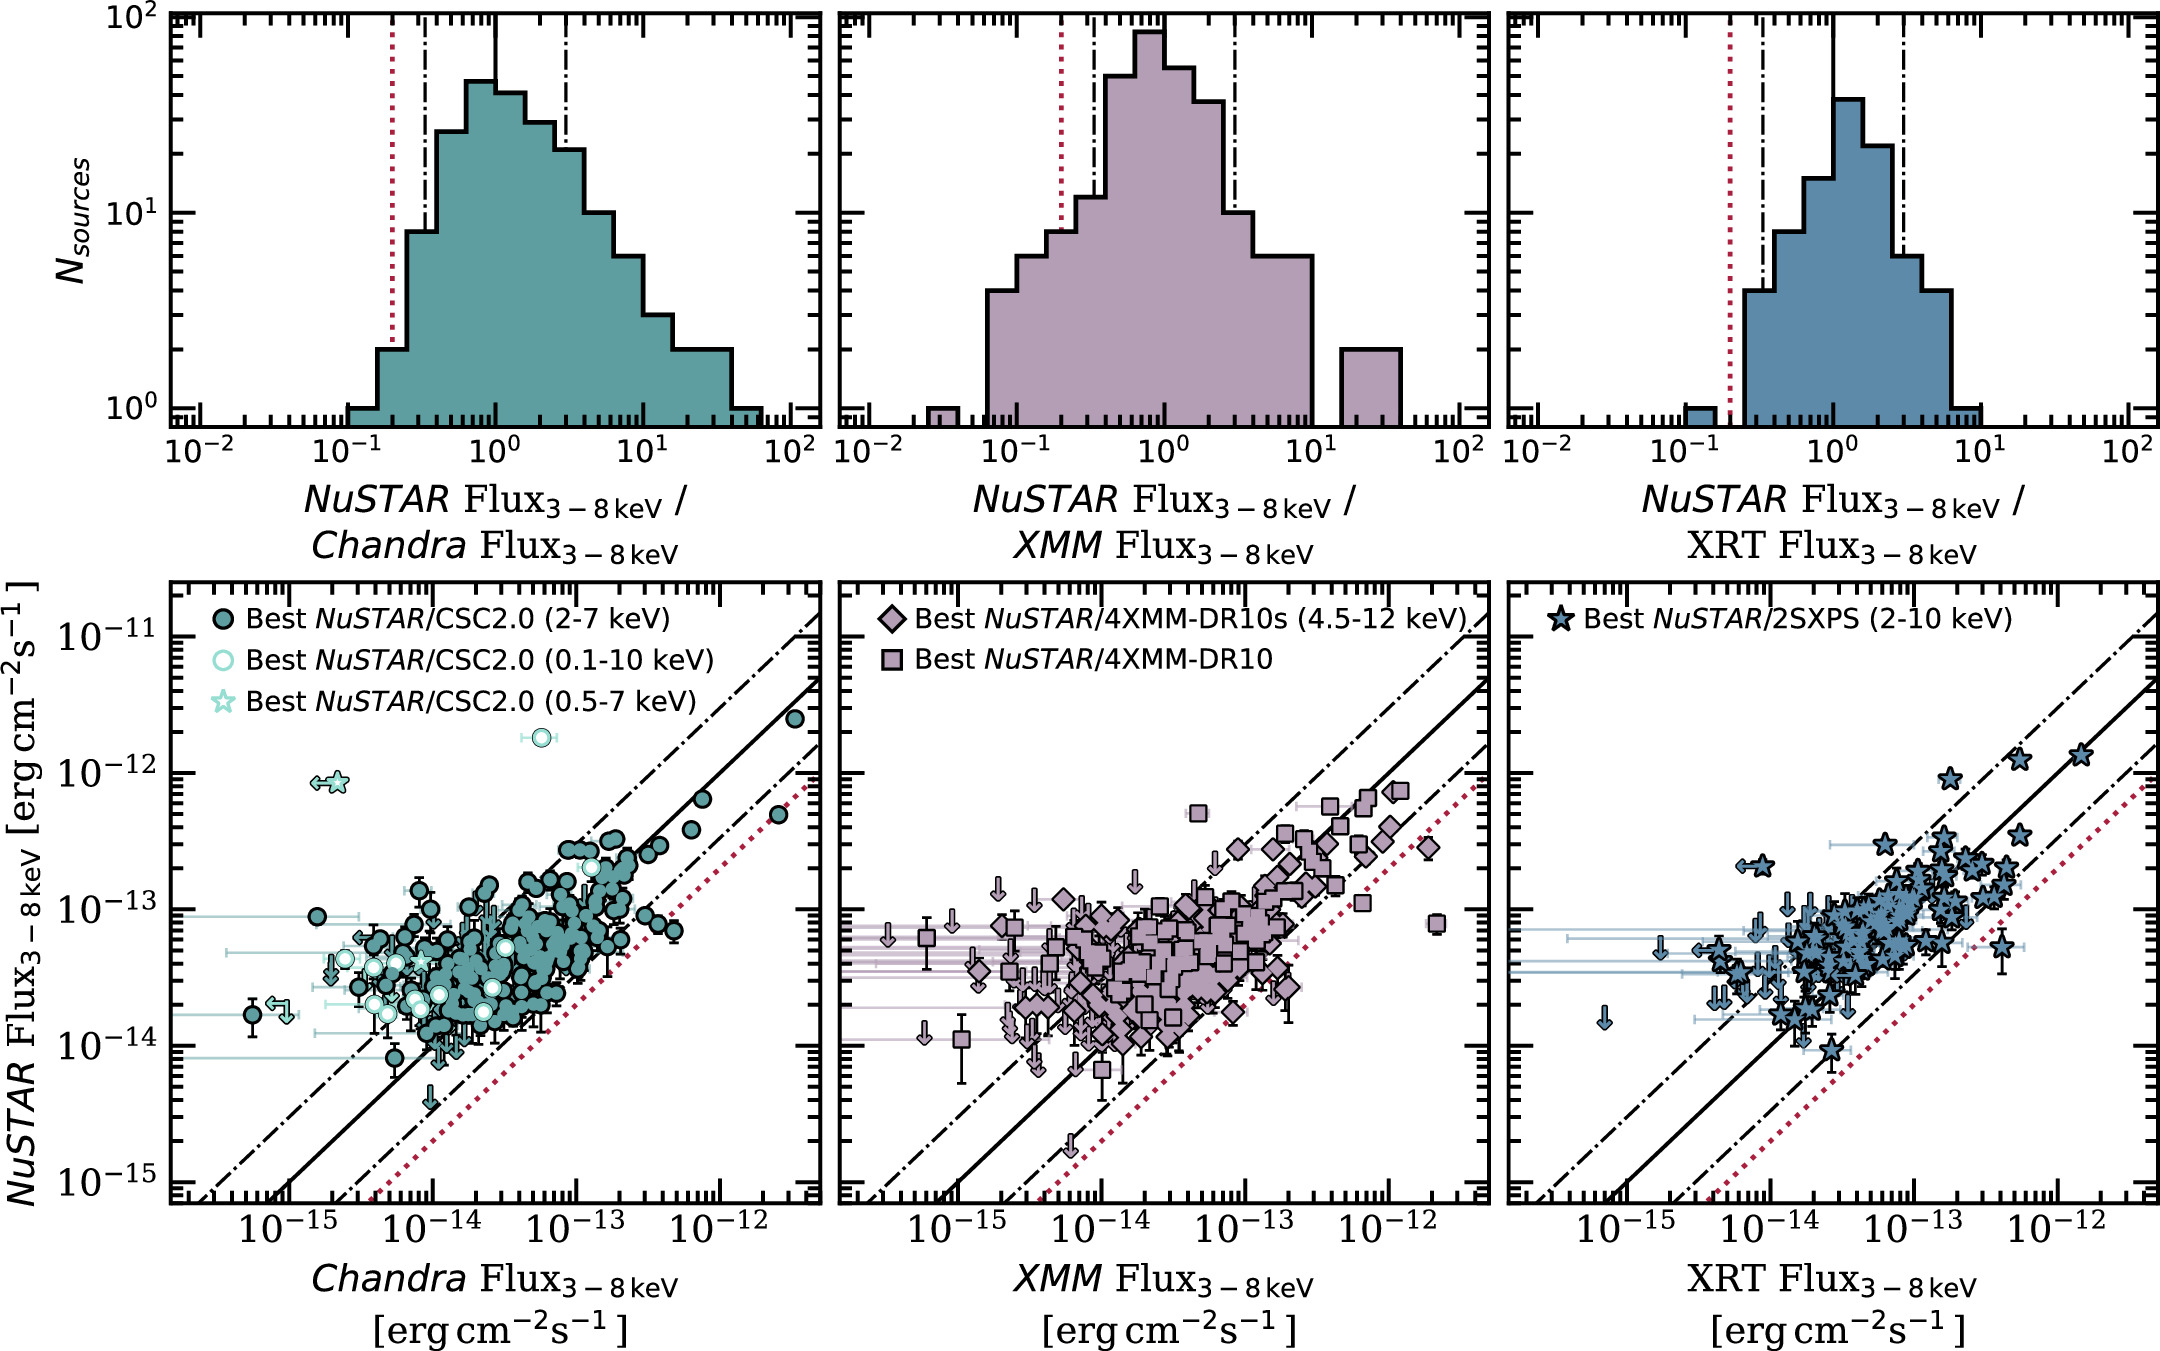
Figure 9. Bottom: Comparison of the 3−8 keV NuSTAR and <10 keV X-ray mission fluxes (Fsoft) for the best Chandra/CSC2.0 (green circles), XMM-Newton/4XMM-DR10/s, (purple squares and diamonds, respectively), or Swift-XRT/2SXPS (blue stars) counterpart matched to the primary NSS80. The different energy bands used to calculate the 3−8 keV fluxes for the CSC2.0 are indicated with different symbols, i.e., 2−7 keV (solid green circles), 0.1−10 keV (white filled, green-edged circles), and 0.5−7 keV (white filled, green-edged stars). Top: distribution of NuSTAR to <10 keV X-ray mission fluxes for each instrument. In both panels, the black solid line shows the 1:1 relation, the black dashed–dotted lines show a factor of 3 from this relation, and the red dotted line indicates a factor of 5 below the 1:1 relation. Ten sources have NuSTAR 3−8 keV flux measurements below the 1:5 relation.
Download figure:
Standard image High-resolution imageFinally, we assessed the flux contribution from all of the Chandra, XMM-Newton, and Swift-XRT sources within a radius of 30″ from the NuSTAR source by determining their total combined 3−8 keV flux ( see Appendix A). This allows us to compare (a) Fsoft measured by NuSTAR (Fsoft,NuSTAR), in order to assess whether a significant amount of NuSTAR flux is coming from other sources, and (b) Fsoft from the best lower-energy counterpart (Fsoft,LE), to assess the contamination of low-energy flux from other sources, less affected by variation and inter-instrument differences. Overall, 6.9% of the NSS80 sources with lower-energy X-ray counterparts have
  , and 4.9% have
  . Only 21 sources have combined fluxes that exceed Fsoft,NuSTAR by a factor of 2. Therefore, we are confident that the NuSTAR source is generally dominated by the emission from the brightest lower-energy X-ray counterpart.
3.2. Finding IR and Optical Counterparts Using Nway
Obtaining redshifts for the NuSTAR sources requires the identification of the correct optical counterpart. The comparatively large positional uncertainty of NuSTAR sources often leads to multiple potential optical counterparts. Consequently, we require an approach to distinguish between true and unrelated optical counterparts, particularly in the absence of more reliable lower-energy X-ray positions. As discussed further in Section 4.2, MIR emission provides a robust identification of AGN activity, particularly for hidden luminous quasars, since the dusty AGN torus radiates predominantly at these wavelengths, while star formation from the host galaxy peaks at far-IR (FIR) wavelengths and is comparatively weak at MIR wavelengths. Therefore, we should not consider star-forming galaxies a major source of contaminants in the MIR distributions found in Figure 11. The all-sky WISE survey therefore provides an excellent complement to NuSTAR: The positional uncertainty of WISE sources, particularly in the shorter-wavelength W1 and W2 bands, is sufficient to be able to reliably identify optical counterparts. Identifying WISE counterparts for hard-X-ray-selected sources can therefore pave the way to locating the correct optical counterpart even for NuSTAR sources without a lower-energy X-ray counterpart. This section describes the process of matching MIR and optical counterparts to NuSTAR sources both with and without lower-energy X-ray counterparts.
L17 adopted a relatively simple closest-neighbor approach to identify multiwavelength counterparts, using the more reliable positions from lower-energy X-ray counterparts, where available, and the distinctive characteristics of AGNs with respect to galaxies in the MIR band (as traced using WISE). Here we adopt a more sophisticated probabilistic approach using Nway (v4.4.2; Salvato et al. 2018) to identify IR and optical counterparts for the NSS80 sources. Nway uses Bayesian methods to probabilistically match multiwavelength counterparts to X-ray sources by simultaneously matching N catalogs in a multidimensional parameter space, e.g., astronomical sky coordinates and positional uncertainties, magnitude and color distributions, source density and morphology, etc. Therefore, Nway is a powerful tool for our task of identifying the correct optical and IR counterparts for NuSTAR-detected sources, which can include both Galactic populations, such as stars, and extragalactic objects, such as AGNs. For our Nway matching, we use CatWISE20 (Marocco et al. 2021), which is a MIR all-sky catalog selected from WISE and NEOWISE at 3.4 and 4.6 μm (i.e., W1 and W2). In addition, we use Pan-STARRS Data Release 2 (PS1-DR2; Flewelling 2018), which provides coverage at decl. ≳ −30° with a single-epoch 5σ depth of r < 21.8. 55
In what follows we summarize the main steps of our Nway-matching approach to obtain IR/optical counterparts for our spectroscopic follow-up campaign, as outlined in Figures 10(a) and (b). We begin by constructing color and magnitude priors that are approximately representative of the population by performing a photometrically unbiased crossmatch between the NSS80 sources, MIR, and optical catalogs, and then restricting the results from this to secure counterparts only (i.e., high-probability matches). With these expected distributions of magnitude and color in hand, we can apply them as priors to a round of crossmatching that includes all possible counterparts (i.e., those that had low probabilities in the first crossmatch, as well as the high-probability matches) and improve the final crossmatch probabilities that inform our selection of principal counterparts.
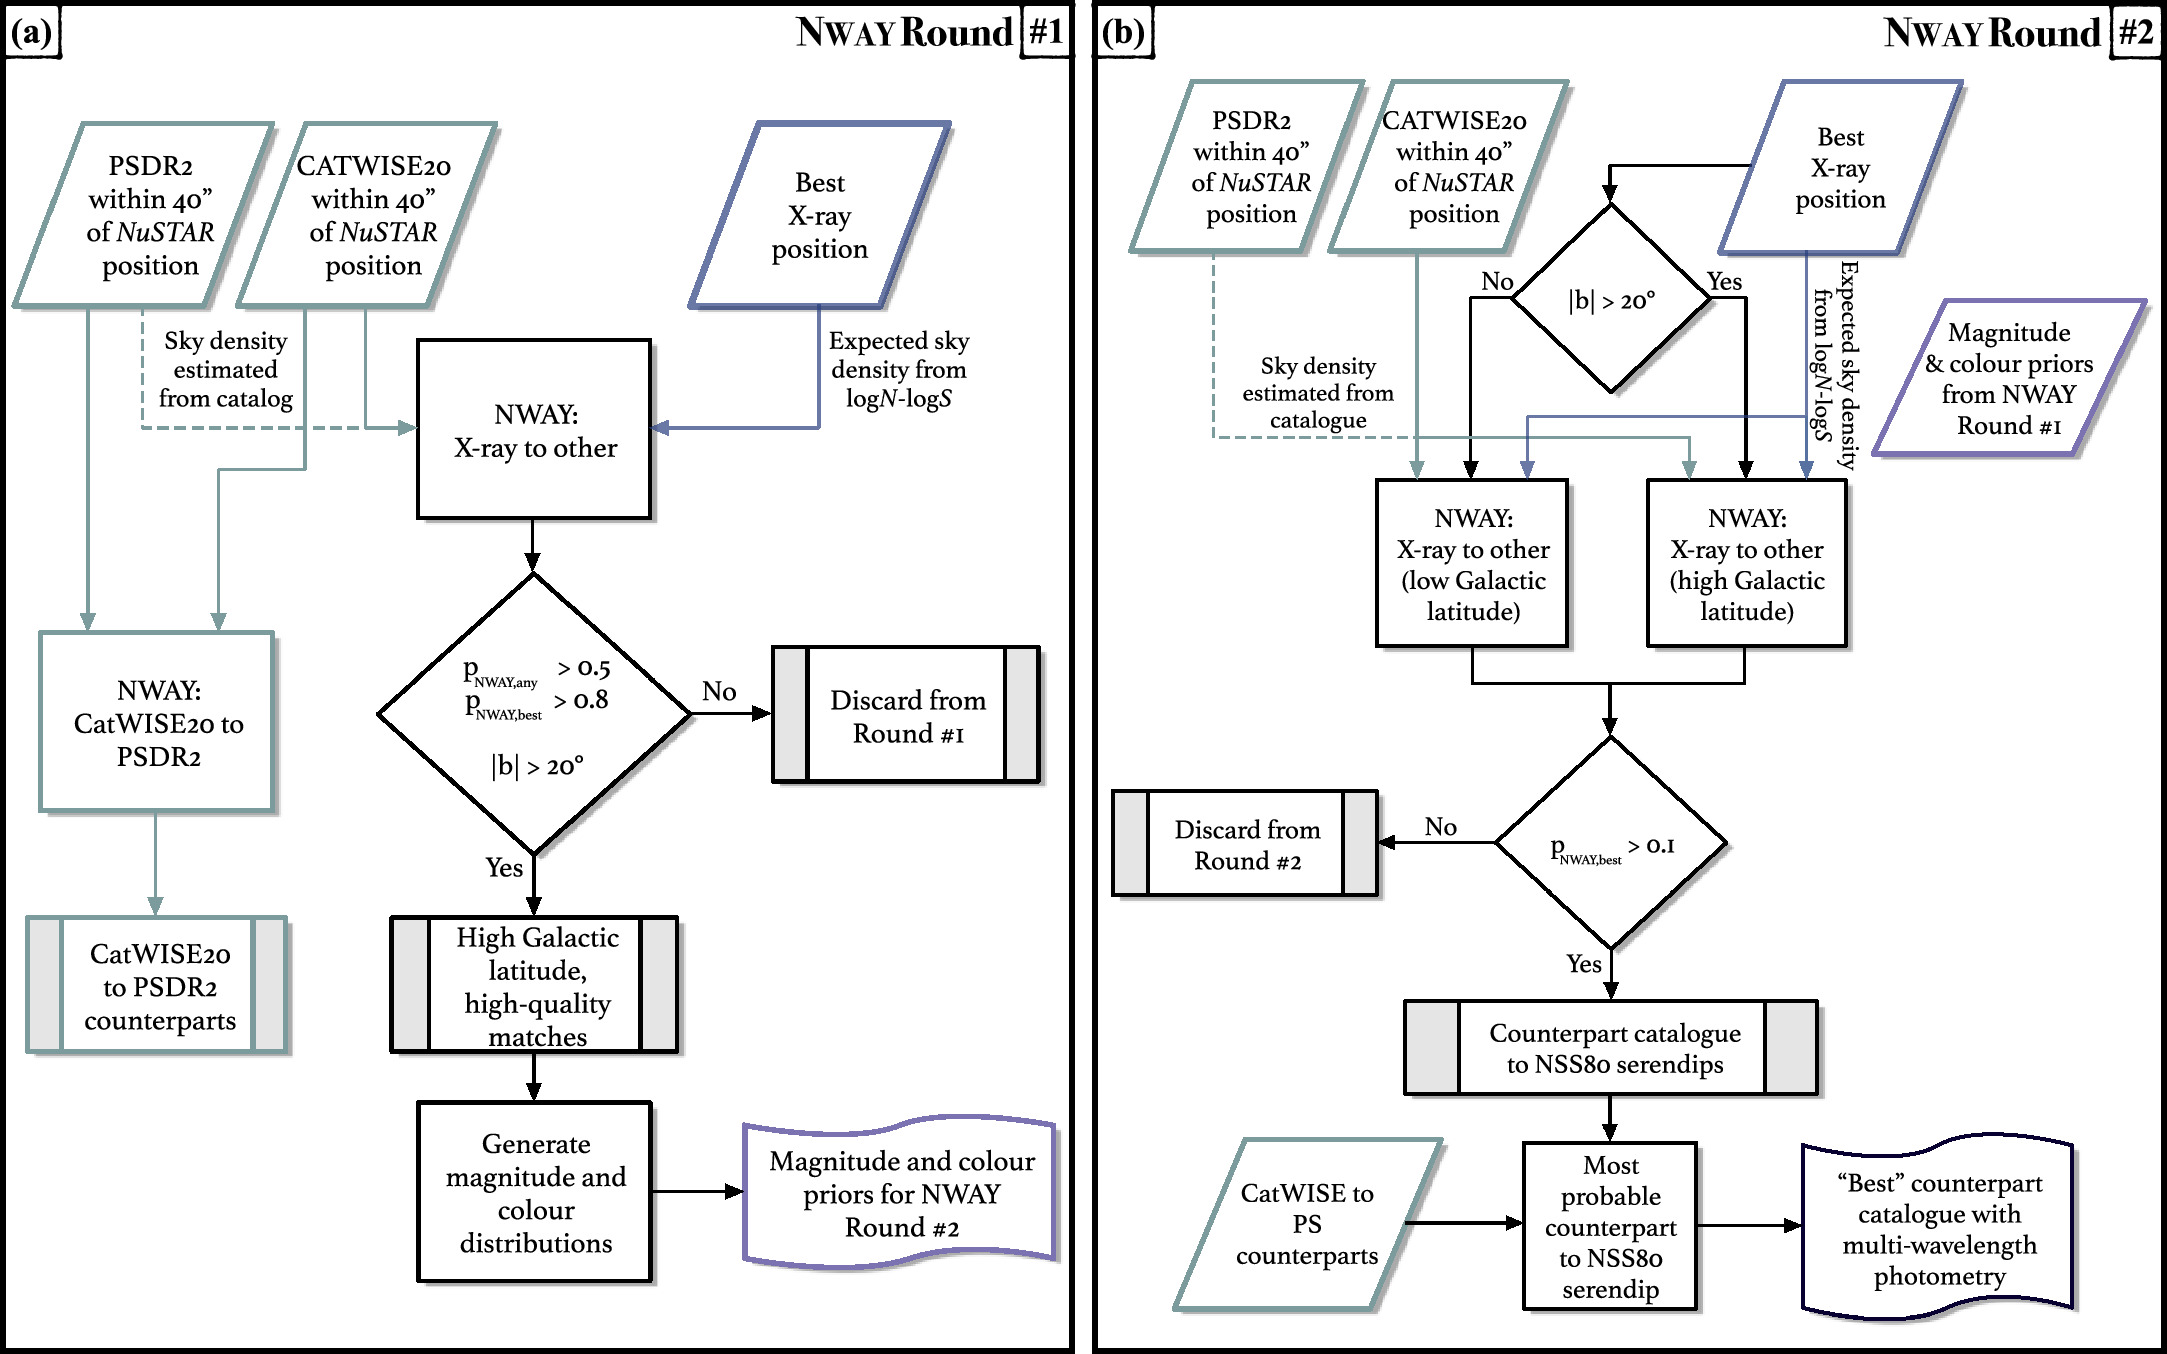
Figure 10. Flowchart illustrating our Nway-matching strategy, which we used to identify CatWISE20 and PS1-DR2 counterparts to the NSS80 sources. (a) Round #1 entails the generation of the magnitude and color priors required for Round #2 (magenta outlined box; see Figure 10(b)), by using astrometric information including source positions and their associated uncertainties, and the sky density as a function of magnitude (green outlined boxes) to identify counterparts to the best X-ray position (blue outlined box). Lines are dashed or shown in different colors purely for clarity. (b) Round #2 of Nway that utilizes the priors (magenta) from the matching to lower-energy X-ray counterparts (blue) with ∣b∣ > 20° in Round #1 and flat priors for sources with ∣b∣ < 20°. All matches with probabilities >10% are stored in the final postprocessed catalog, which includes X-ray information, multiband positions and photometry, and key Nway information such as the Bayesian match probabilities.
Download figure:
Standard image High-resolution imageThis process and the resulting principal optical counterparts should be understood with some basic information in mind. In general, we prioritize counterparts from the X-ray–MIR matching, as AGNs are more robustly distinguished in the MIR (see distributions in Figure 11). Selection of optical counterparts follows using a well-defined branching procedure, with the aim of producing the most likely counterpart candidates for the population as a whole. The intention of this is to provide an overview of the properties of counterparts to hard-X-ray-selected sources (see Sections 4.2 and 4.3). The matches are therefore also manually checked, and in a small minority of cases this overrides the automatic procedure (see red branch, “VI corrected,” in Figure 12 and Round #2 part (v)). Users are advised to consider their specific use cases and the appropriate choice of optical counterpart for their application.
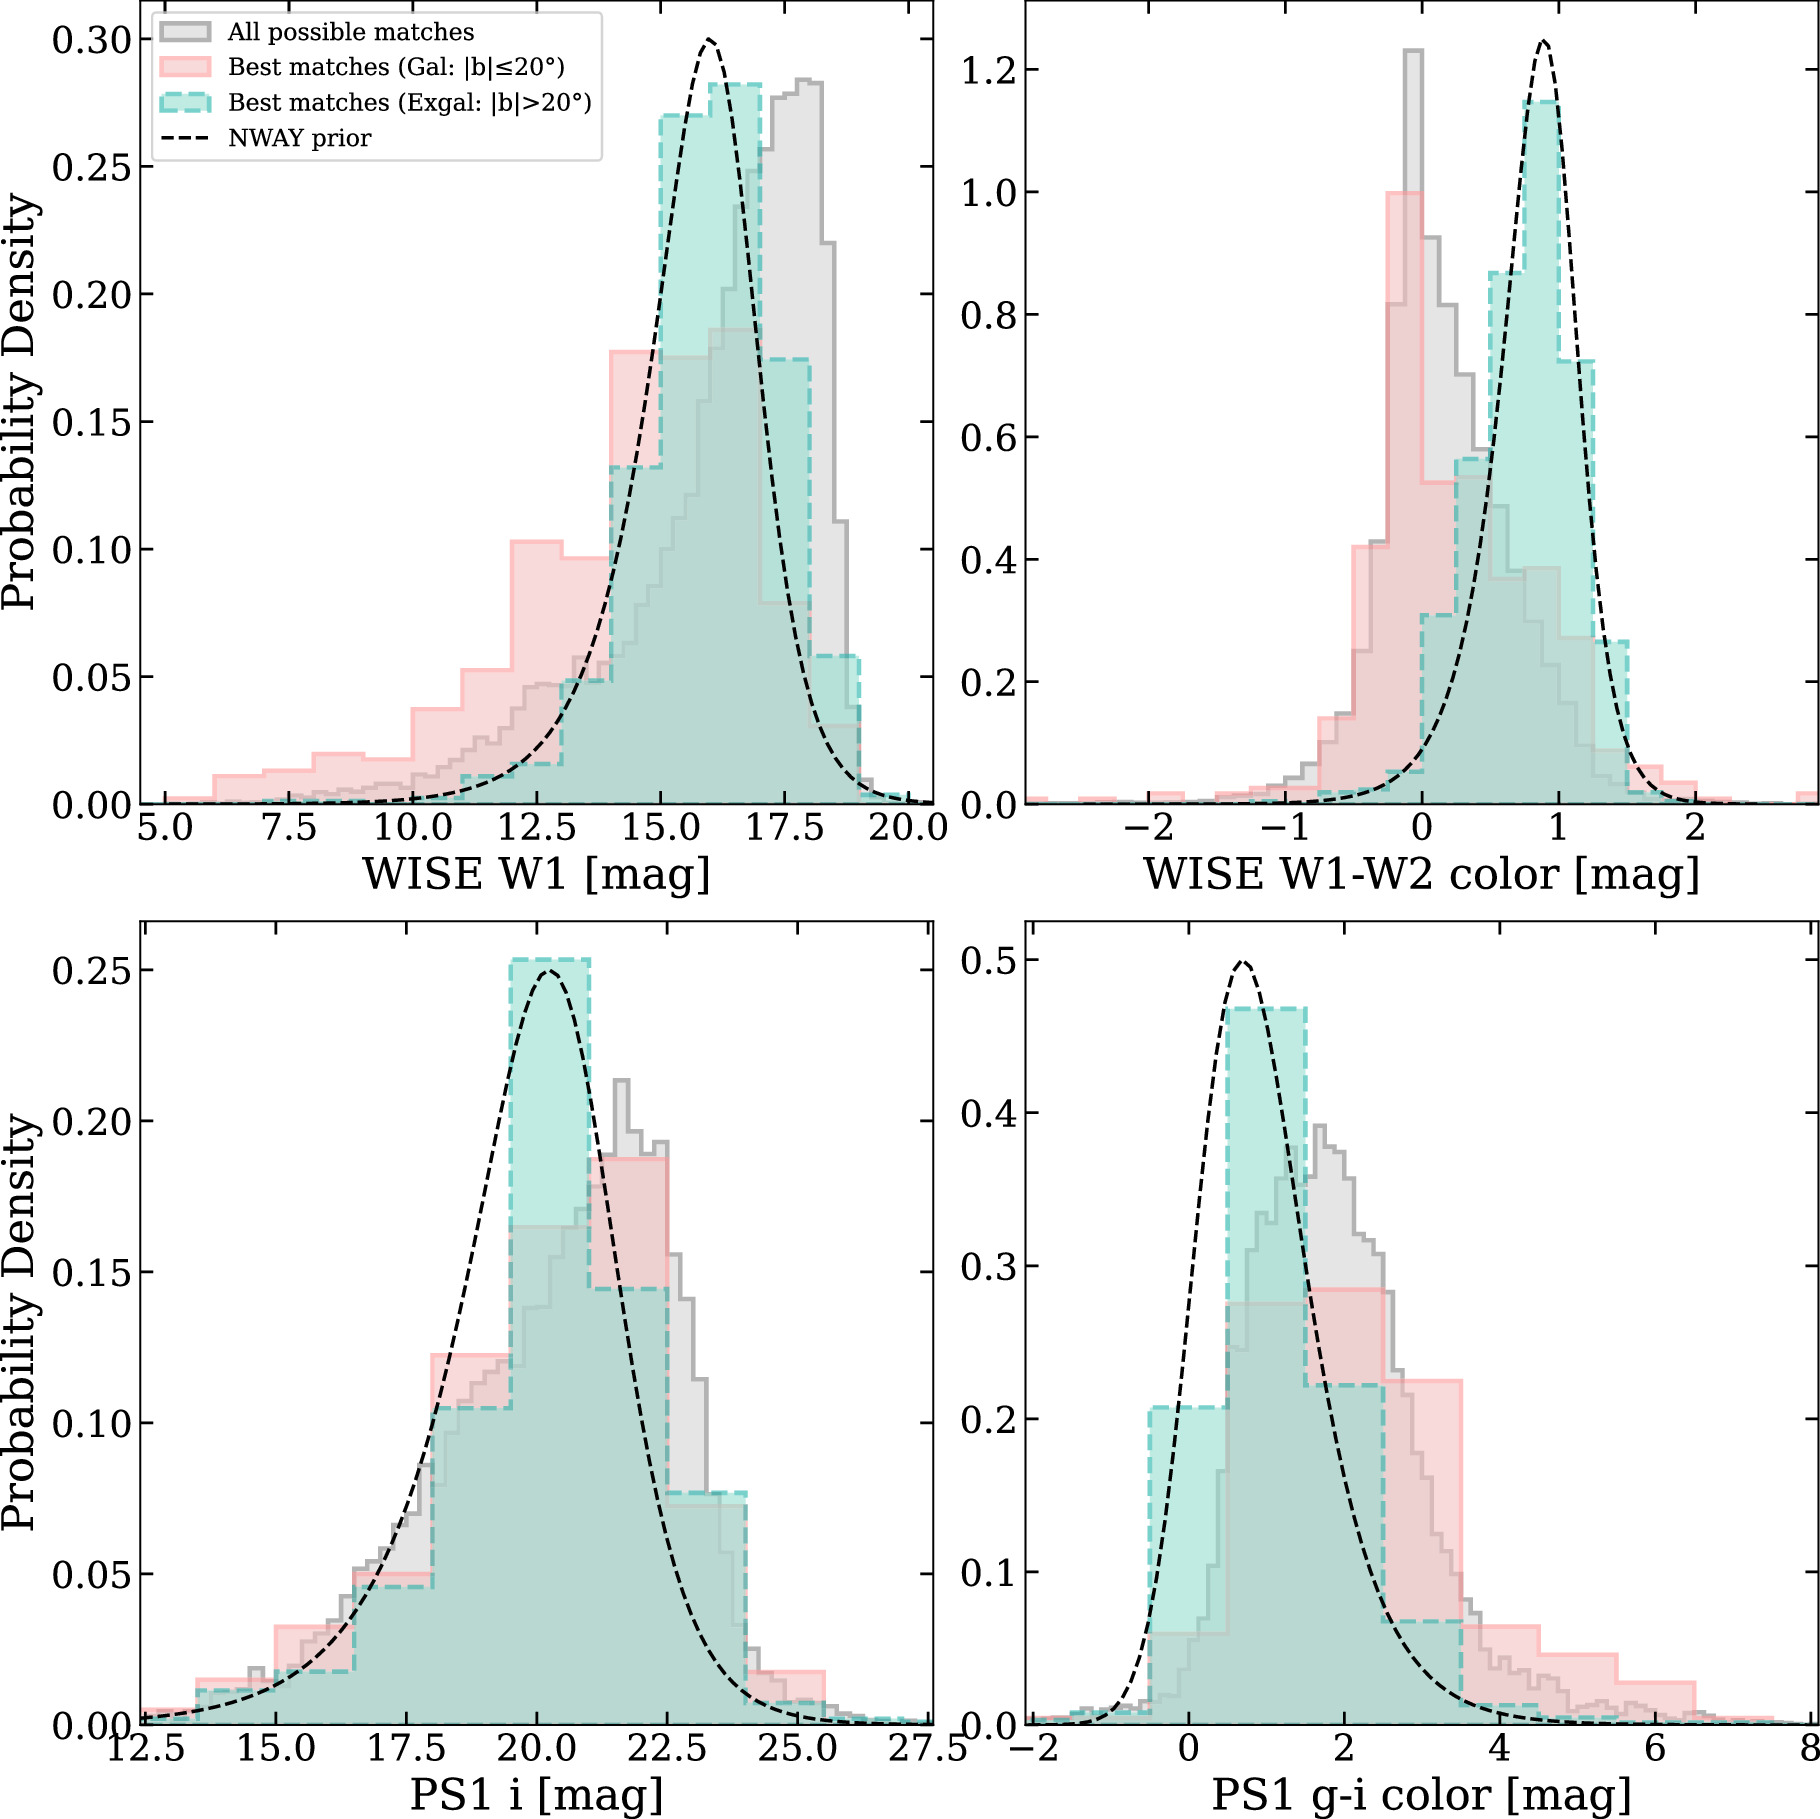
Figure 11. Magnitude and color distributions (integrated to unity) of the CatWISE20 (top) and Pan-STARRS (bottom) matched samples from Round #1, which are used to evaluate priors in Round #2 to identify the “best” IR counterpart for each NuSTAR serendipitous source. WISE magnitudes are Vega and optical magnitudes are AB. Top left: the W1-magnitude distribution for the best matches vs. all sources (gray shaded area), splitting the former by Galactic latitude; high-Galactic-latitude sources (∣b∣ > 20°) in red and low-Galactic-latitude sources (∣b∣ < 20°) in blue. The black line is a generalized logistic distribution fit to the data of the high-Galactic-latitude sources. The W1 distribution of the low-Galactic-latitude sources follows a similar shape to that of the high-Galactic-latitude sources, with a slightly brighter W1 tail. Top right: the W1 – W2 color distribution following the same color code as in the first panel. Here the WISE color of the high-Galactic-latitude sources, driven by the presence of AGNs, is distinct from the low-Galactic-latitude sources. Moreover, the peak of the distribution is around W1 – W2 ≈ 0.8, which is the Stern et al. (2012) criterion for selecting MIR AGNs. Therefore, the W1 – W2 color distribution can be used as a prior to identifying AGN candidates for optical/IR follow-up spectroscopy. Bottom left: the i-magnitude distribution following the same color code as in the previous panels. The distribution of the low-Galactic-latitude sources follows a similar shape to that of the high-Galactic-latitude sources, peaking at a slightly less bright magnitude. Bottom right: the g–i color distribution following the same color code as in the previous panels.
Download figure:
Standard image High-resolution image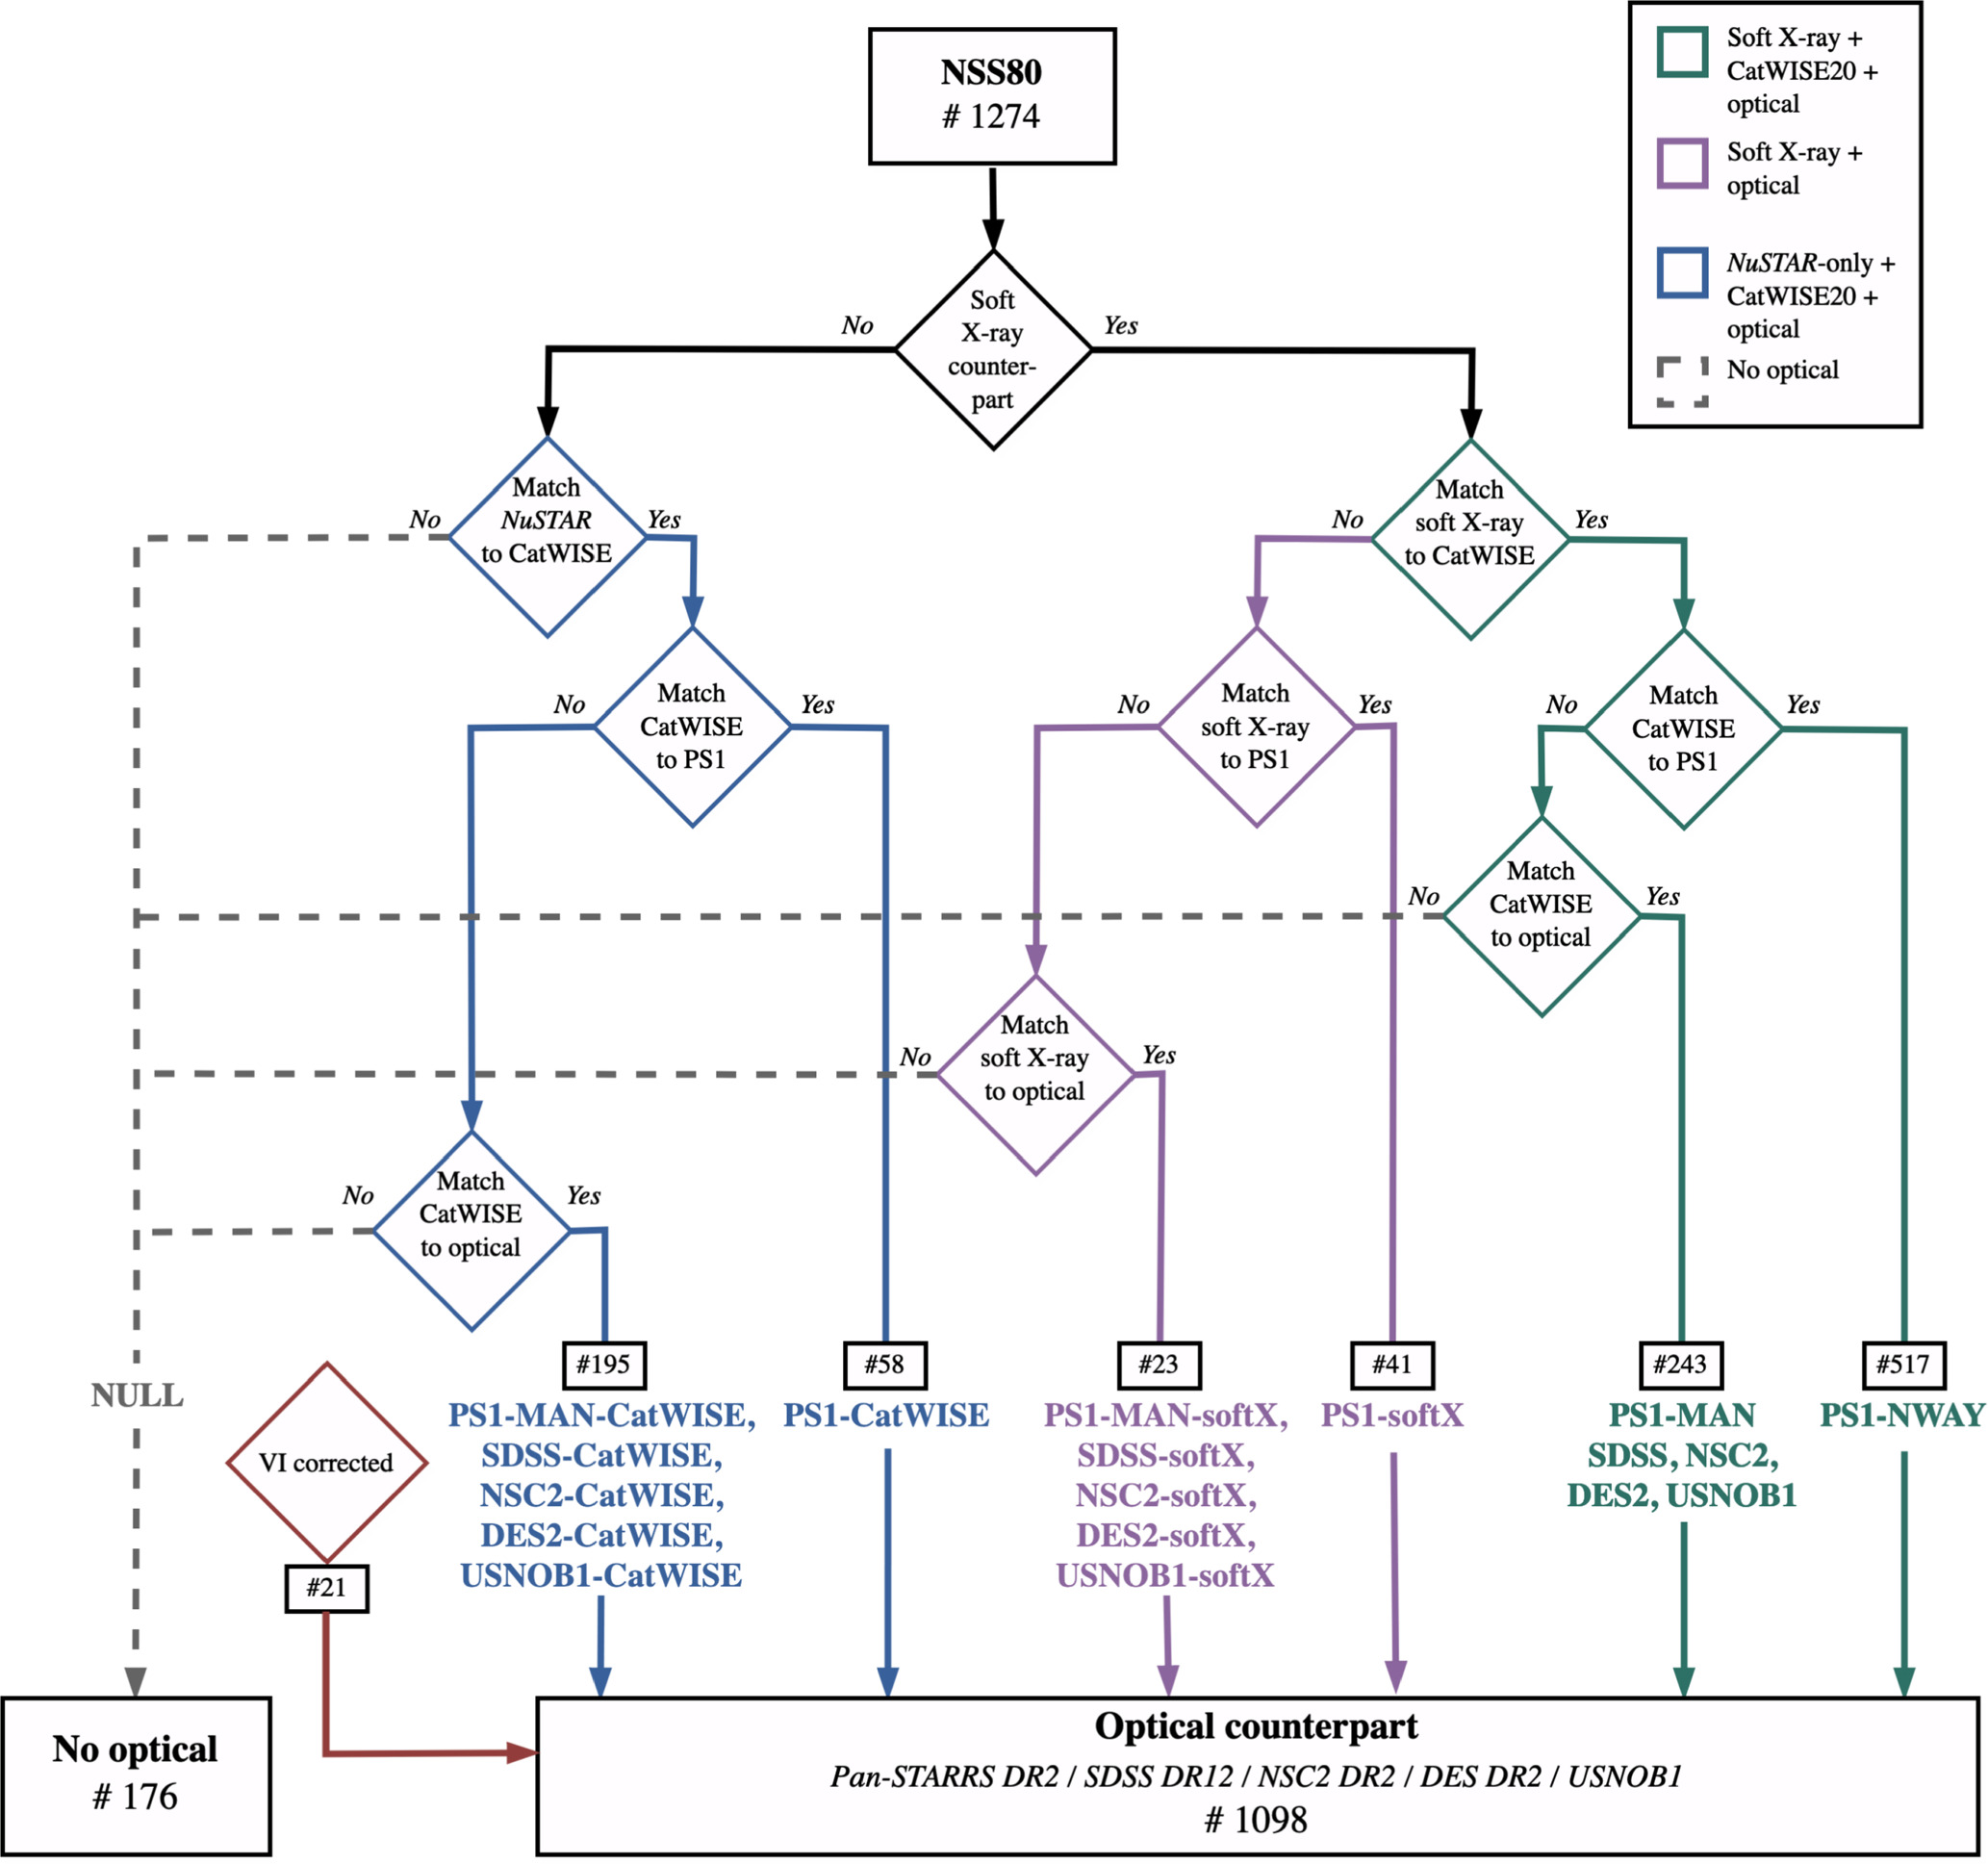
Figure 12. A flowchart of the principal adopted optical counterparts to the NSS80 sources. The actions in green represent NSS80 sources with lower-energy X-ray + CatWISE20 counterparts with an optical match within 27 from the WISE position. Optical matches are retrieved from PS1-DR2 (either from our Nway matching or manually), SDSS, NSC2, DES2, or USNOB1. The purple actions indicate lower-energy X-ray + optical matches which lack a CatWISE20 association. For these sources, we matched the Chandra, XMM-Newton, or Swift-XRT positions (softX ≡ lower-energy X-ray) to the aforementioned optical catalogs using characteristic positional uncertainties of 2.5″, 5″, or 6″, respectively. The blue actions represent NuSTAR-only X-ray + CatWISE20 positions matched to the aforementioned optical surveys (prioritizing Nway matches where available) using a matching radius of 2
7; these optical matches are only used for the purposes of spectroscopic follow-up. NSS80 sources that lack any optical association (some of which may be too faint/distant) are indicated with gray actions. In red is shown the contribution of objects with a visually selected optical match—these include, for example, objects where crossmatching limits for other branches are exceeded slightly but on visual inspection a clear match is found. This results in an optical completeness of ∼86% (1098/1274) for the NSS80 catalog: 844/964 lower-energy X-ray and 254/310 NuSTAR-only X-ray associations. This information is available in the NSS80 catalog; see Appendix A.
Download figure:
Standard image High-resolution imagePreliminary round: constructing base counterpart catalogs. An optical and an IR base catalog are first created (separately) by collecting all IR positions from CatWISE20 and optical positions from PS1-DR2 within 40″ of the NuSTAR position (see the green outlined boxes in Figure 10(a)). 56
Round #1: defining magnitude and color priors / Figure 10(a). Round #1 uses only astrometric and sky-density information (including positional errors) to identify a “good” counterpart for the NSS80 sources. The expected local sky densities of optical and WISE counterparts vary greatly with distance from the Galactic plane, and therefore CatWISE20 and PS1 sky densities were calculated from the actual number counts within 40″ of each NuSTAR source. The NuSTAR source densities were derived using the  –
– curves reported in Harrison et al. (2016), adopting the deblended soft-band NuSTAR flux.
For X-ray positions, lower-energy coordinates are used where available (see Section 3.1), otherwise the NuSTAR position is used. In this work, we use 68% positional uncertainties appropriate for input to Nway, adapted from the various serendipitous catalog values for sources with soft X-ray matches. For NuSTAR-only sources, we used the 68% positional uncertainties based on  , as shown in Figure 8. These values can be found in the catalog (column “e_Xdeg”).
Nway calculates the probability that each WISE or Pan-STARRS source is the correct counterpart to a specific X-ray source (pCat,best and pPS,best for CatWISE20 and PS1-DR2, respectively). 57 For X-ray sources with large positional uncertainties such as pure NuSTAR sources without lower-energy X-ray information, counterpart identification is often less reliable, which will be captured in the lower probability values returned by Nway. In addition to the best counterpart match probability, Nway provides the probability that any of the CatWISE/PS1-DR2 sources is the right counterpart (pCat,any and pPS,any for CatWISE20 and PS1-DR2, respectively); a higher probability indicates a lower false-association likelihood. To ensure that we only include sources with a high probability of a correct match, we applied the following constraints on the matching probabilities and discarded any sources from Round #1 which do not comply: pCAT/PS,any > 0.5 and pCAT/PS,best > 0.8. We treat sources at low Galactic latitudes (∣b∣ < 20°) separately since source confusion is high closer to the Galactic plane as a result of the high density of Galactic sources; color/magnitude priors appropriate to extragalactic sources do not apply to a population containing a large number of stellar X-ray emitters. A detailed study focusing on Galactic and low-latitude sources could improve the counterpart matching for these sources by investigating different potential priors (for example, the top-left panel of Figure 11 implies that W1 may be effective), which may be particularly valuable in these crowded regions. Only two Galactic sources lack a soft X-ray counterpart. No sources outside of the Galactic plane that pass these probability cuts lack a soft X-ray counterpart—these matches can therefore be considered reliable and representative of the extragalactic population.
The high-probability matches of the NSS80 serendipitous sources at high Galactic latitudes are then used to generate WISE and optical magnitude distributions in addition to color distributions, which all serve as photometric priors for the second round of Nway matching, as described in Figure 10(b). The W1-magnitude and W1 – W2 color distributions for the CatWISE20 base catalog generated with Nway are shown in the top panels of Figure 11. W1 – W2 color is known to correlate with the presence of an AGN (e.g., Stern et al. 2012; Assef et al. 2018) and W1 presents the deepest observations, therefore we choose these as our color and magnitude priors. Evidently, the WISE color distribution for sources at high Galactic latitudes (blue distribution) provides a valuable way to distinguish between stellar objects and AGNs. A similar result holds for PS1-DR2 i-band magnitudes and g − i colors, where reliable counterparts are bluer in the optical compared to the base population from PS1-DR2 (see bottom panels of Figure 11). The g and i bands are both deep in PS1-DR2, and the g − i color can be used to select for reddened AGNs (e.g., Klindt et al. 2019).
As an input for prior-based calculations, Nway also requires a distribution of counterparts (WISE or optical) that are not associated with X-ray sources. For this, we use the histograms of all sources in our 40” search fields around the NuSTAR positions (gray histograms in the top panels of Figure 11). X-ray source counterparts contribute to <2% of these histograms, so they are an excellent representation of the background population.
At this point, we have two “good” match catalogs: X-ray–optical and X-ray–IR, which are used to evaluate priors for the more thorough matching in Round 2.
Round #2: improvement of the nway matching using priors / Figure 10(b). Round #2 now uses the optical and MIR priors evaluated after matching in Round #1 (W1 magnitude, W1 − W2 color, i-band magnitude, and g − i color) to help identify the most probable optical counterparts for the NSS80 sources. The primary X-ray source catalog is categorized into low- and high-Galactic-latitude sources with the division at ∣b∣ = 20°. ∣b∣ < 20° sources are matched geometrically (i.e., including positional errors but not using photometric priors) to the base CatWISE20 and PS1-DR2 catalogs, as in Round 1. Counterparts for the ∣b∣ > 20° X-ray sources are identified using the magnitude and color priors from Round #1 as inputs to Nway; therefore, these matches are weighted toward brighter sources and those with AGN-like colors. Figure 11 compares the priors used in this round with the distributions used to construct them. It also shows the distributions for ∣b∣ < 20° sources and all possible matches; the latter can be taken as a reasonable indication of the “background,” or unmatched, distributions. We also compare the results of Round #2 with a version of the catalogs created using a positional offset to simulate the chances of a random association (as advised in the Nway documentation) and assess the probability of a false association based on these results. This informs our selection of threshold cuts in the remainder of this section. For each NSS80 source, the highest-probability CatWISE20/PS1-DR2 match is stored in the catalog, if pCAT/PS,best > 10%.
We now have two “improved” match catalogs: X-ray–optical and X-ray–IR, which contain a potential match for each NSS80 source. These catalogs must then be assessed to select a preferred counterpart, which we refer to as the “principal counterpart.” The goal of this process is to characterize the general optical and MIR properties of the NSS80 sources (see Sections 4.2 and 4.3) and prepare for spectroscopic follow-up (see Section 3.3).
Final step: identification of principal counterpart / Figures 10(b) and 12. Finally, the two catalogs are combined to form a refined catalog, with a single Nway match in each of CatWISE20 and PS1-DR2 for each NSS80 source. This refined catalog includes X-ray information, multiband positions and photometry (which can be expanded according to one’s preferences), and key Nway information such as pCAT/PS,best and pCAT/PS,any—all of these will be included in the online NSS80 catalog; see Appendix A. 58 The next part of this section describes selecting the best available optical counterpart, which is the Nway-selected source in the majority of cases. 59
When selecting the final principal optical counterparts, subsets of the NSS80 sources are dealt with in different ways, depending on the available optical or lower-energy X-ray data and the results of the Nway matching, as outlined below. Generally, we consider the CatWISE20 match to be the primary counterpart, with optical associations secondary; Figure 11 shows that the MIR distribution of best Nway matches is more distinct from that of all possible matches than the equivalent comparison using optical distributions (for extragalactic sources). We note that in all cases the results were visually inspected (with imaging in all cases, and optical spectra where available; see Section 3.3) by several of the authors, to assess the results. If multiple convincing counterparts are seen, then the match is not flagged as reliable, although the results are not changed for a significant number of sources. We consider the following cases, with each following a branch of Figure 12:
- (i)Sources with a lower-energy X-ray match, at least one CatWISE20 match, and at least one PS1 match within 2
7 of the CatWISE20 position. As mentioned in Section 3.1, 964/1274 NSS80 sources have a lower-energy X-ray counterpart and, therefore, will have more reliable multiwavelength counterpart associations than those with NuSTAR-only positions. Of the 964 lower-energy X-ray sources, 850 have a CatWISE20 match to the lower-energy X-ray position, of which 573 have at least one PS1 association found by Nway (Pan-STARRS only covers decl. ≳ −30°; 627/850 sources with soft X-ray and CatWISE20 matches fall in this region). 60 However, given that the two catalogs were independently matched to the lower-energy X-ray positions, the PS1 position is not necessarily an exact match to the CatWISE20 position. A maximum angular separation of 2
- (ii)Sources with a lower-energy X-ray match, at least one CatWISE20 match, but no PS1 match within 2
- (iii)Sources with a lower-energy X-ray match, but no CatWISE20 match. From lower-energy X-ray counterparts that lack any CatWISE20 association (i.e., a CatWISE20 Nway match with pCat,best > 0.1; 114/964); 79% (90/114) of these sources are at low Galactic latitudes. If an Nway PS1 match is available for these sources, this is used, and if not a PS1-DR2 match based on angular separation alone is attempted using the Chandra, XMM-Newton, and Swift-XRT positions, with positional offset limits of 2
- (iv)Sources with no lower-energy X-ray match. For the 310/1274 NSS80 sources without lower-energy X-ray counterparts, the X-ray positional error circle from NuSTAR is comparatively large, so unique counterparts cannot be identified with high confidence (see Figure 13). However, from our Nway matching we were able to secure a potential WISE association for all 310 sources with a pCat,best ≳ 0.1; note that NuSTARJ182353+0742.0 is a borderline case with pCat,best = 0.095 and pCat,any = 0.53. To search for an optical counterpart for these sources, for the purposes of optical spectroscopic follow-up only (i.e., to retrieve an optical position and r magnitude if detected), we crossmatched the CatWISE20 position to the aforementioned optical surveys using a 2
- (v)Visually inspected sources. Finally, as each source was visually inspected we find a small number (21/1274) where it is appropriate to override the procedural matching explained in this section. The majority of these are sources that fail a matching distance criterion by only a small amount but on visual inspection appear likely to be a correct match. For example, if a PS1 source is further than 2
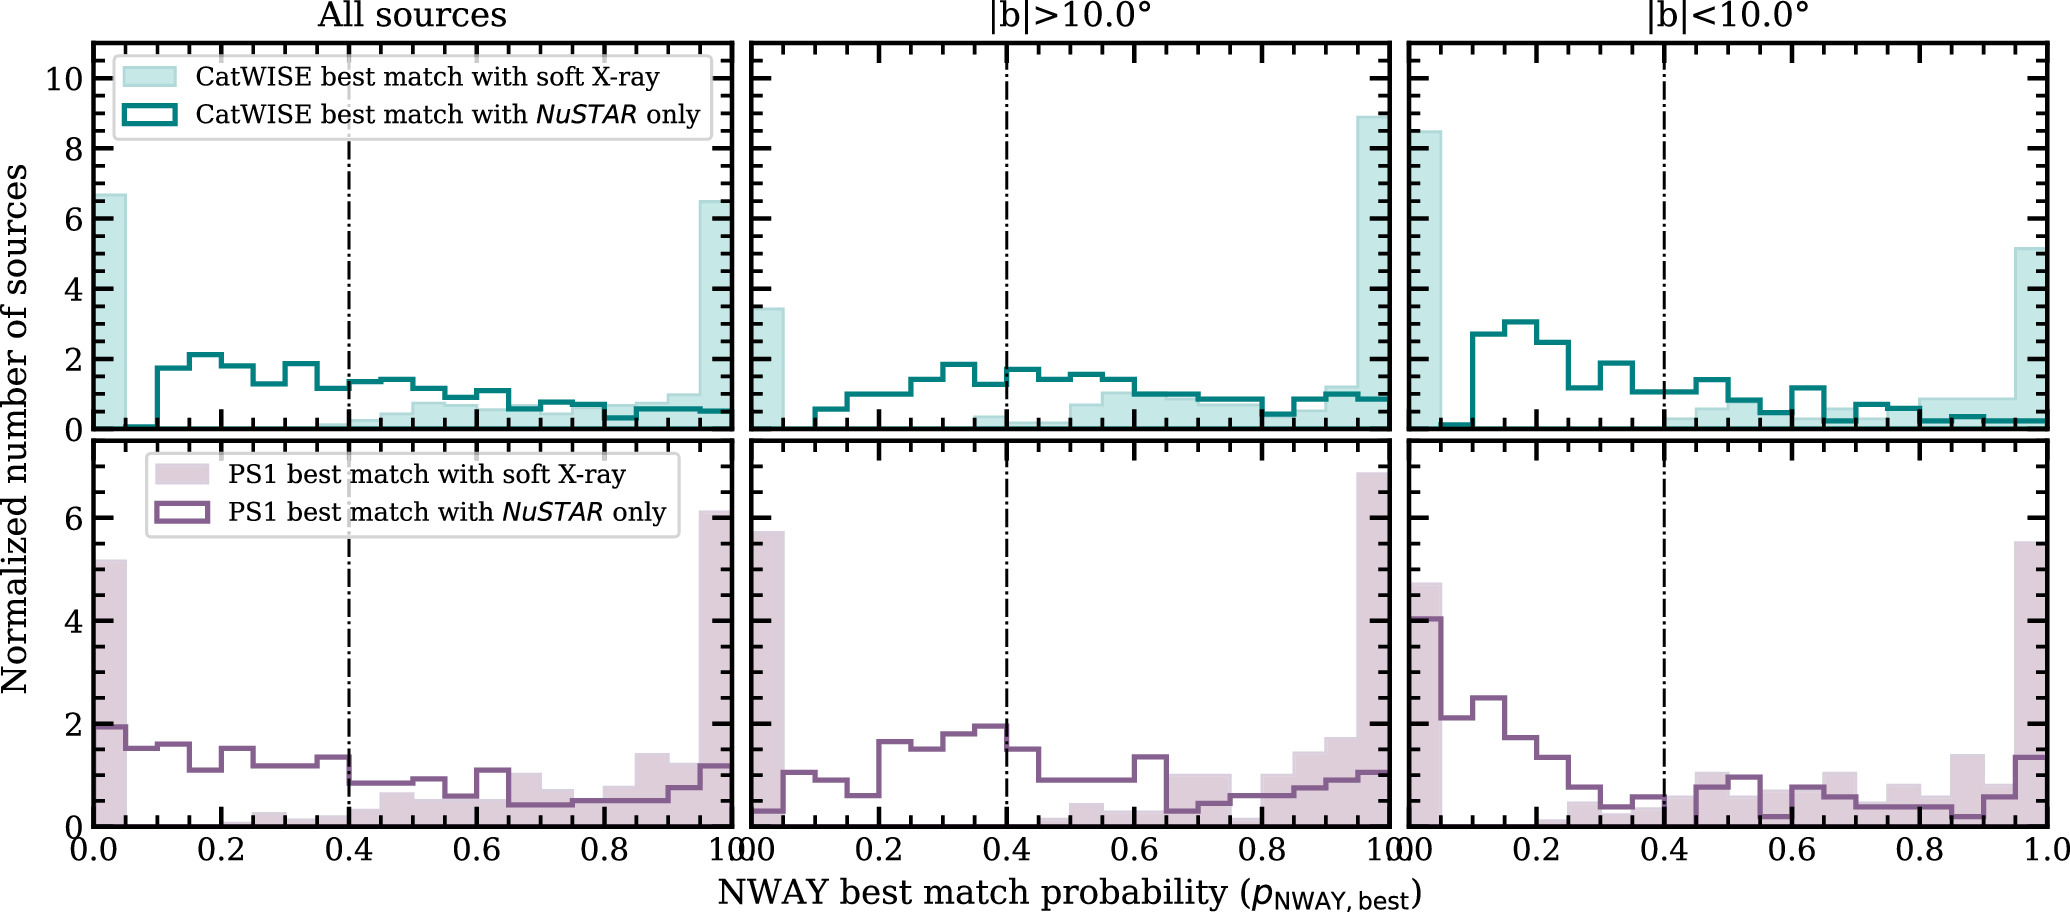
Figure 13. A histogram of the distribution of match probabilities for the Nway CatWISE20 (top panel) and Pan-STARRS (bottom panel) candidates before applying the >10% pCat/PS1,best cut at the end of Round #2, both for NuSTAR-only (open) and improved lower-energy X-ray positions (filled). The high-quality probability cut (pCat/PS1,best ≥ 0.4) is plotted with a dashed–dotted line. Evidently, in the absence of more reliable lower-energy X-ray positions, Nway returns low probabilities for the CatWISE20/PS1-DR2 matches. The left panel shows all sources; the middle and right panels show high- and low-Galactic-latitude sources, respectively.
Download figure:
Standard image High-resolution imageOur selection process to identify the principal adopted optical counterpart is summarized in Figure 12. Not all Nway matches will be true counterpart associations since the crossmatching depends on X-ray counterpart information (i.e., positional uncertainty, which is influenced by source and background counts), whether a soft X-ray counterpart can be found (generally these have much smaller positional uncertainties than NuSTAR and thus improve crossmatching), the Galactic latitude of the source (i.e., source confusion easily occurs for high-density fields usually within the Galactic plane), and the depth of the optical/IR imaging surveys (e.g., shallow imaging can miss counterparts that are evident in deeper surveys), to mention but a few. Figure 13 shows the distribution of Nway match probabilities (pCAT/PS,best) for the “best” CatWISE20 (top panel) and Pan-STARRS (bottom panel) candidates, both for NuSTAR-only (open) and improved lower-energy X-ray positions (filled). Evidently, the CatWISE20/PS1-DR2 probabilities are low in the absence of more reliable lower-energy X-ray positions.
We therefore attempted to identify a subset of our NSS80 that have high-probability matches based on our Nway analysis to minimize false associations—henceforth described as “reliable” counterparts—and provide this information in the catalog (“NWAY_RFlag”; Table 11). We first identified high-probability CatWISE20 matches with thresholds of pCat,best > 0.4 and pCat,any > 0.5. The expected rate of false associations based on matching with randomized catalogs (as in Salvato et al. 2018) around each NuSTAR/soft X-ray position gives a 1.4% chance of false association if a soft X-ray source is present, and 12.6% if there is no soft X-ray source, improving to 0.5% and 9.6%, respectively, when limited to ∣b∣ > 10°. We supplement the reliable CatWISE20 counterparts with reliable PS1-DR2 counterparts, if present, for sources that fail the CatWISE20 probability criterion, by applying the same higher-probability cut on their PS1-DR2 probabilities (i.e., pPS,best > 0.4 and pPS,any > 0.5). In total, 963/1274 NSS80 sources have a reliable CatWISE20 or PS1-DR2 counterpart, of which 76% (726) are high-Galactic-latitude sources. Of these 370 only have a reliable CatWISE20 counterpart and 103 only PS1-DR2; many of these do have an Nway match that is below the 0.4/0.5 thresholds. The remaining 321 NSS80 sources have low-probability Nway counterparts and should, therefore, be used with caution to avoid biasing the results.
Finally, we have a single principal match catalog, checked at each stage for the most reasonable match. All selected matches are included, and particularly high-probability matches are flagged as reliable. This subset can be selected with the flag “NWAY_RFlag”; see Table 4.
Figure 14 shows the distribution of astrometric offsets between the X-ray source and the adopted CatWISE20 (top panel) and optical (Pan-STARRS, SDSS, NSC2, DES, and USNOB1; bottom panel) counterpart, for the high-probability Nway-selected samples (filled symbols) and for sources with low Nway probabilities (open, gray-edged crosses). Sources with Galactic latitudes ∣b∣ > 20° are plotted with circles, squares/diamonds, and stars for NSS80 sources with CSC2, 4XMM-DR10/s, and 2SXPS counterparts, respectively. The low-Galactic-latitude sources identified with Nway based solely on geometric information are shown with crosses.
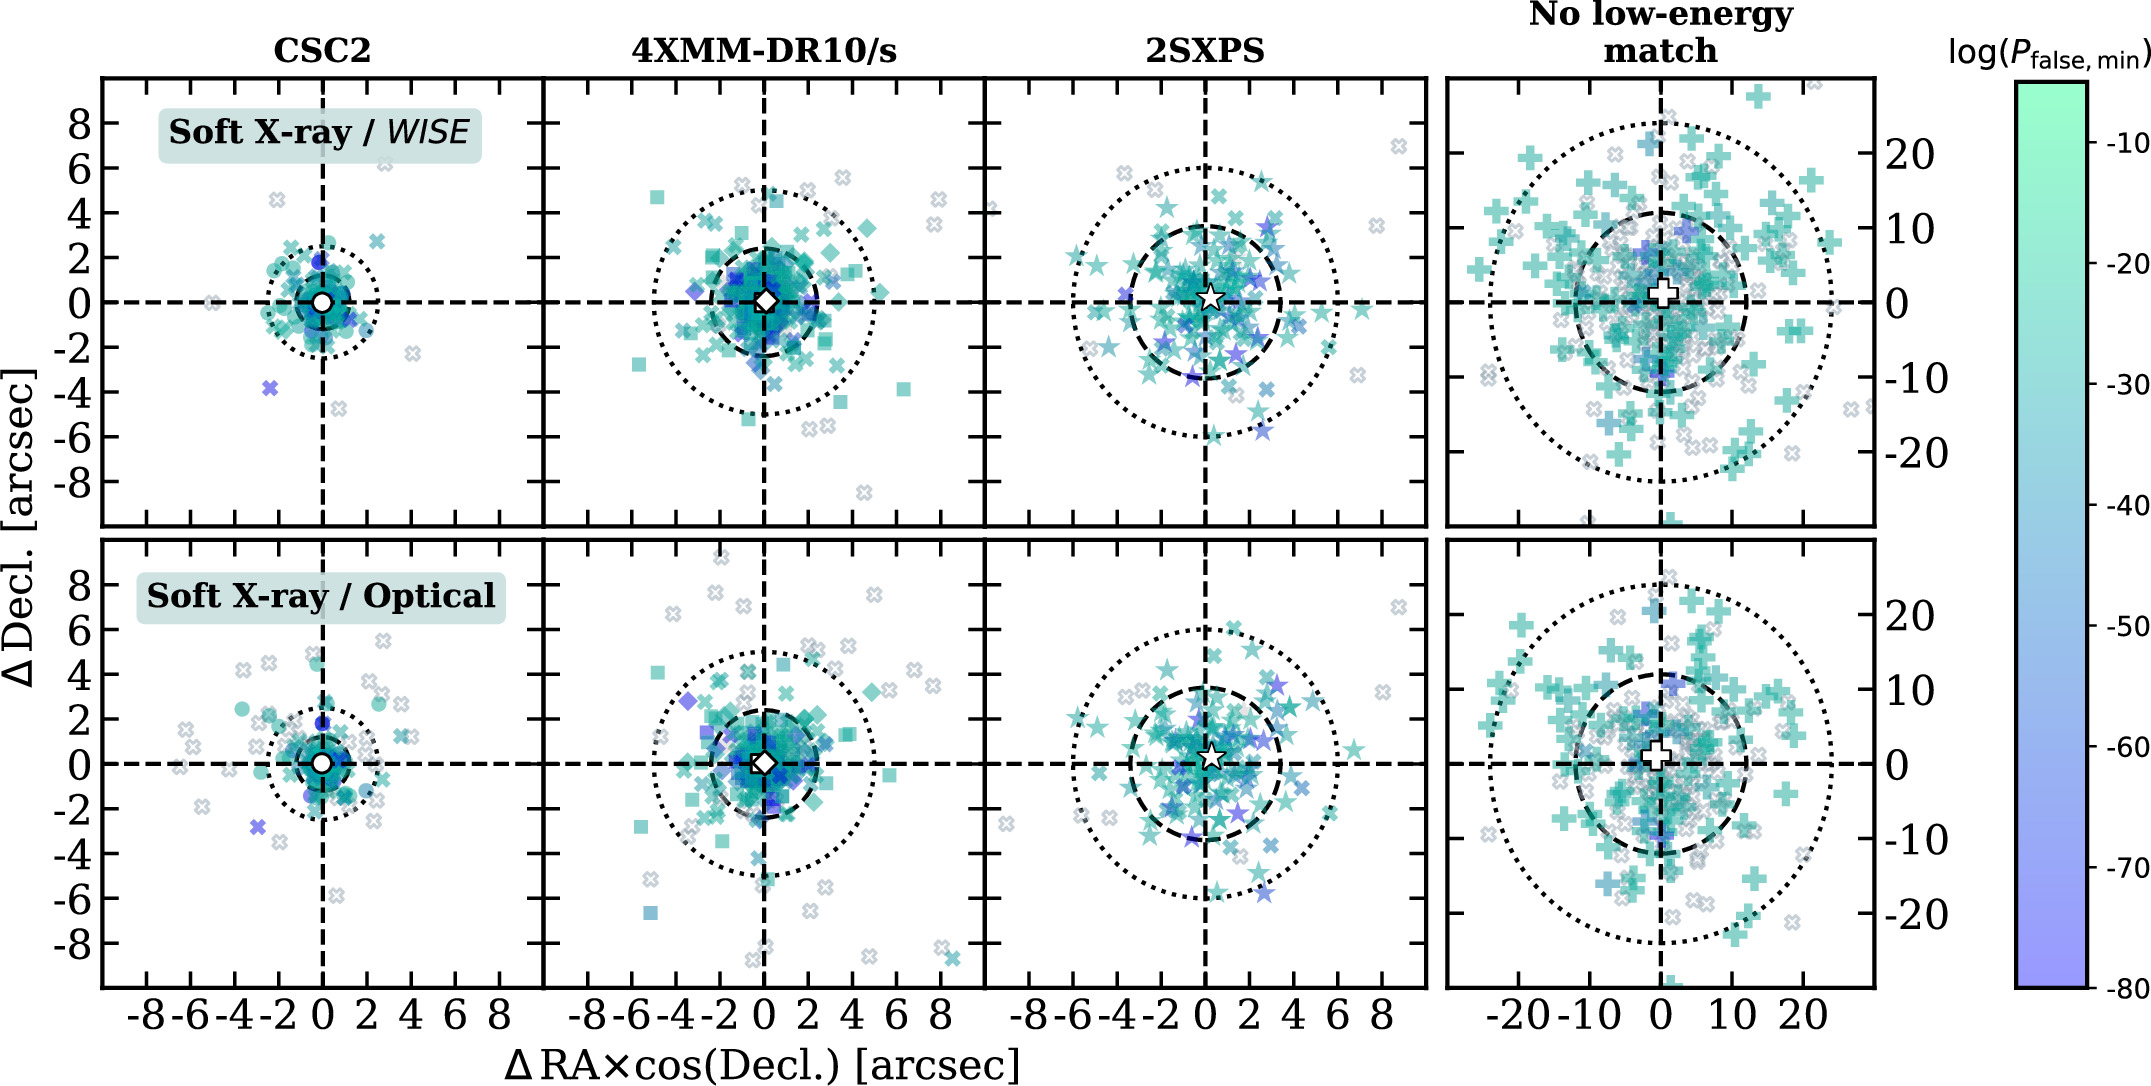
Figure 14. Astrometric offsets between the lower-energy X-ray counterpart coordinates and the WISE (top row) and the adopted optical (bottom row) coordinates, color coded using the NuSTAR detection likelihood ( ), for Nway-identified counterparts flagged as reliable. The high-Galactic-latitude lower-energy X-ray counterparts are from CSC2 (left column; circles), 4XMM-DR10/s (middle-left column; squares and diamonds, respectively), 2SXPS (middle-right column; stars), and NuSTAR only (right column; plus symbols). Low-Galactic-latitude sources are plotted with color-coded crosses and sources with less reliable counterpart associations are indicated with open gray-edged crosses. The dashed (dotted) circles correspond to the 1σ (2σ) search radii for each lower-energy X-ray telescope: 1
2 (2
5), 2
4 (5″), 3
4 (6″), and 12″ (24″) for Chandra, XMM-Newton, Swift-XRT, and NuSTAR, respectively. The white circle, square, diamond, star, and plus indicates the median astrometric offset for each of the extragalactic samples. Note the different scale for the NuSTAR-only section.
Download figure:
Standard image High-resolution imageIn Figure 15, we show histograms of the WISE (top panels) and optical (g,r and i; middle panels) magnitudes for the high-probability Nway-selected samples at high (green) and low (peach) Galactic latitudes, respectively. 65 The median magnitudes of the low-Galactic-latitude sources are on average 1–2 mag brighter than the high-Galactic-latitude sources.
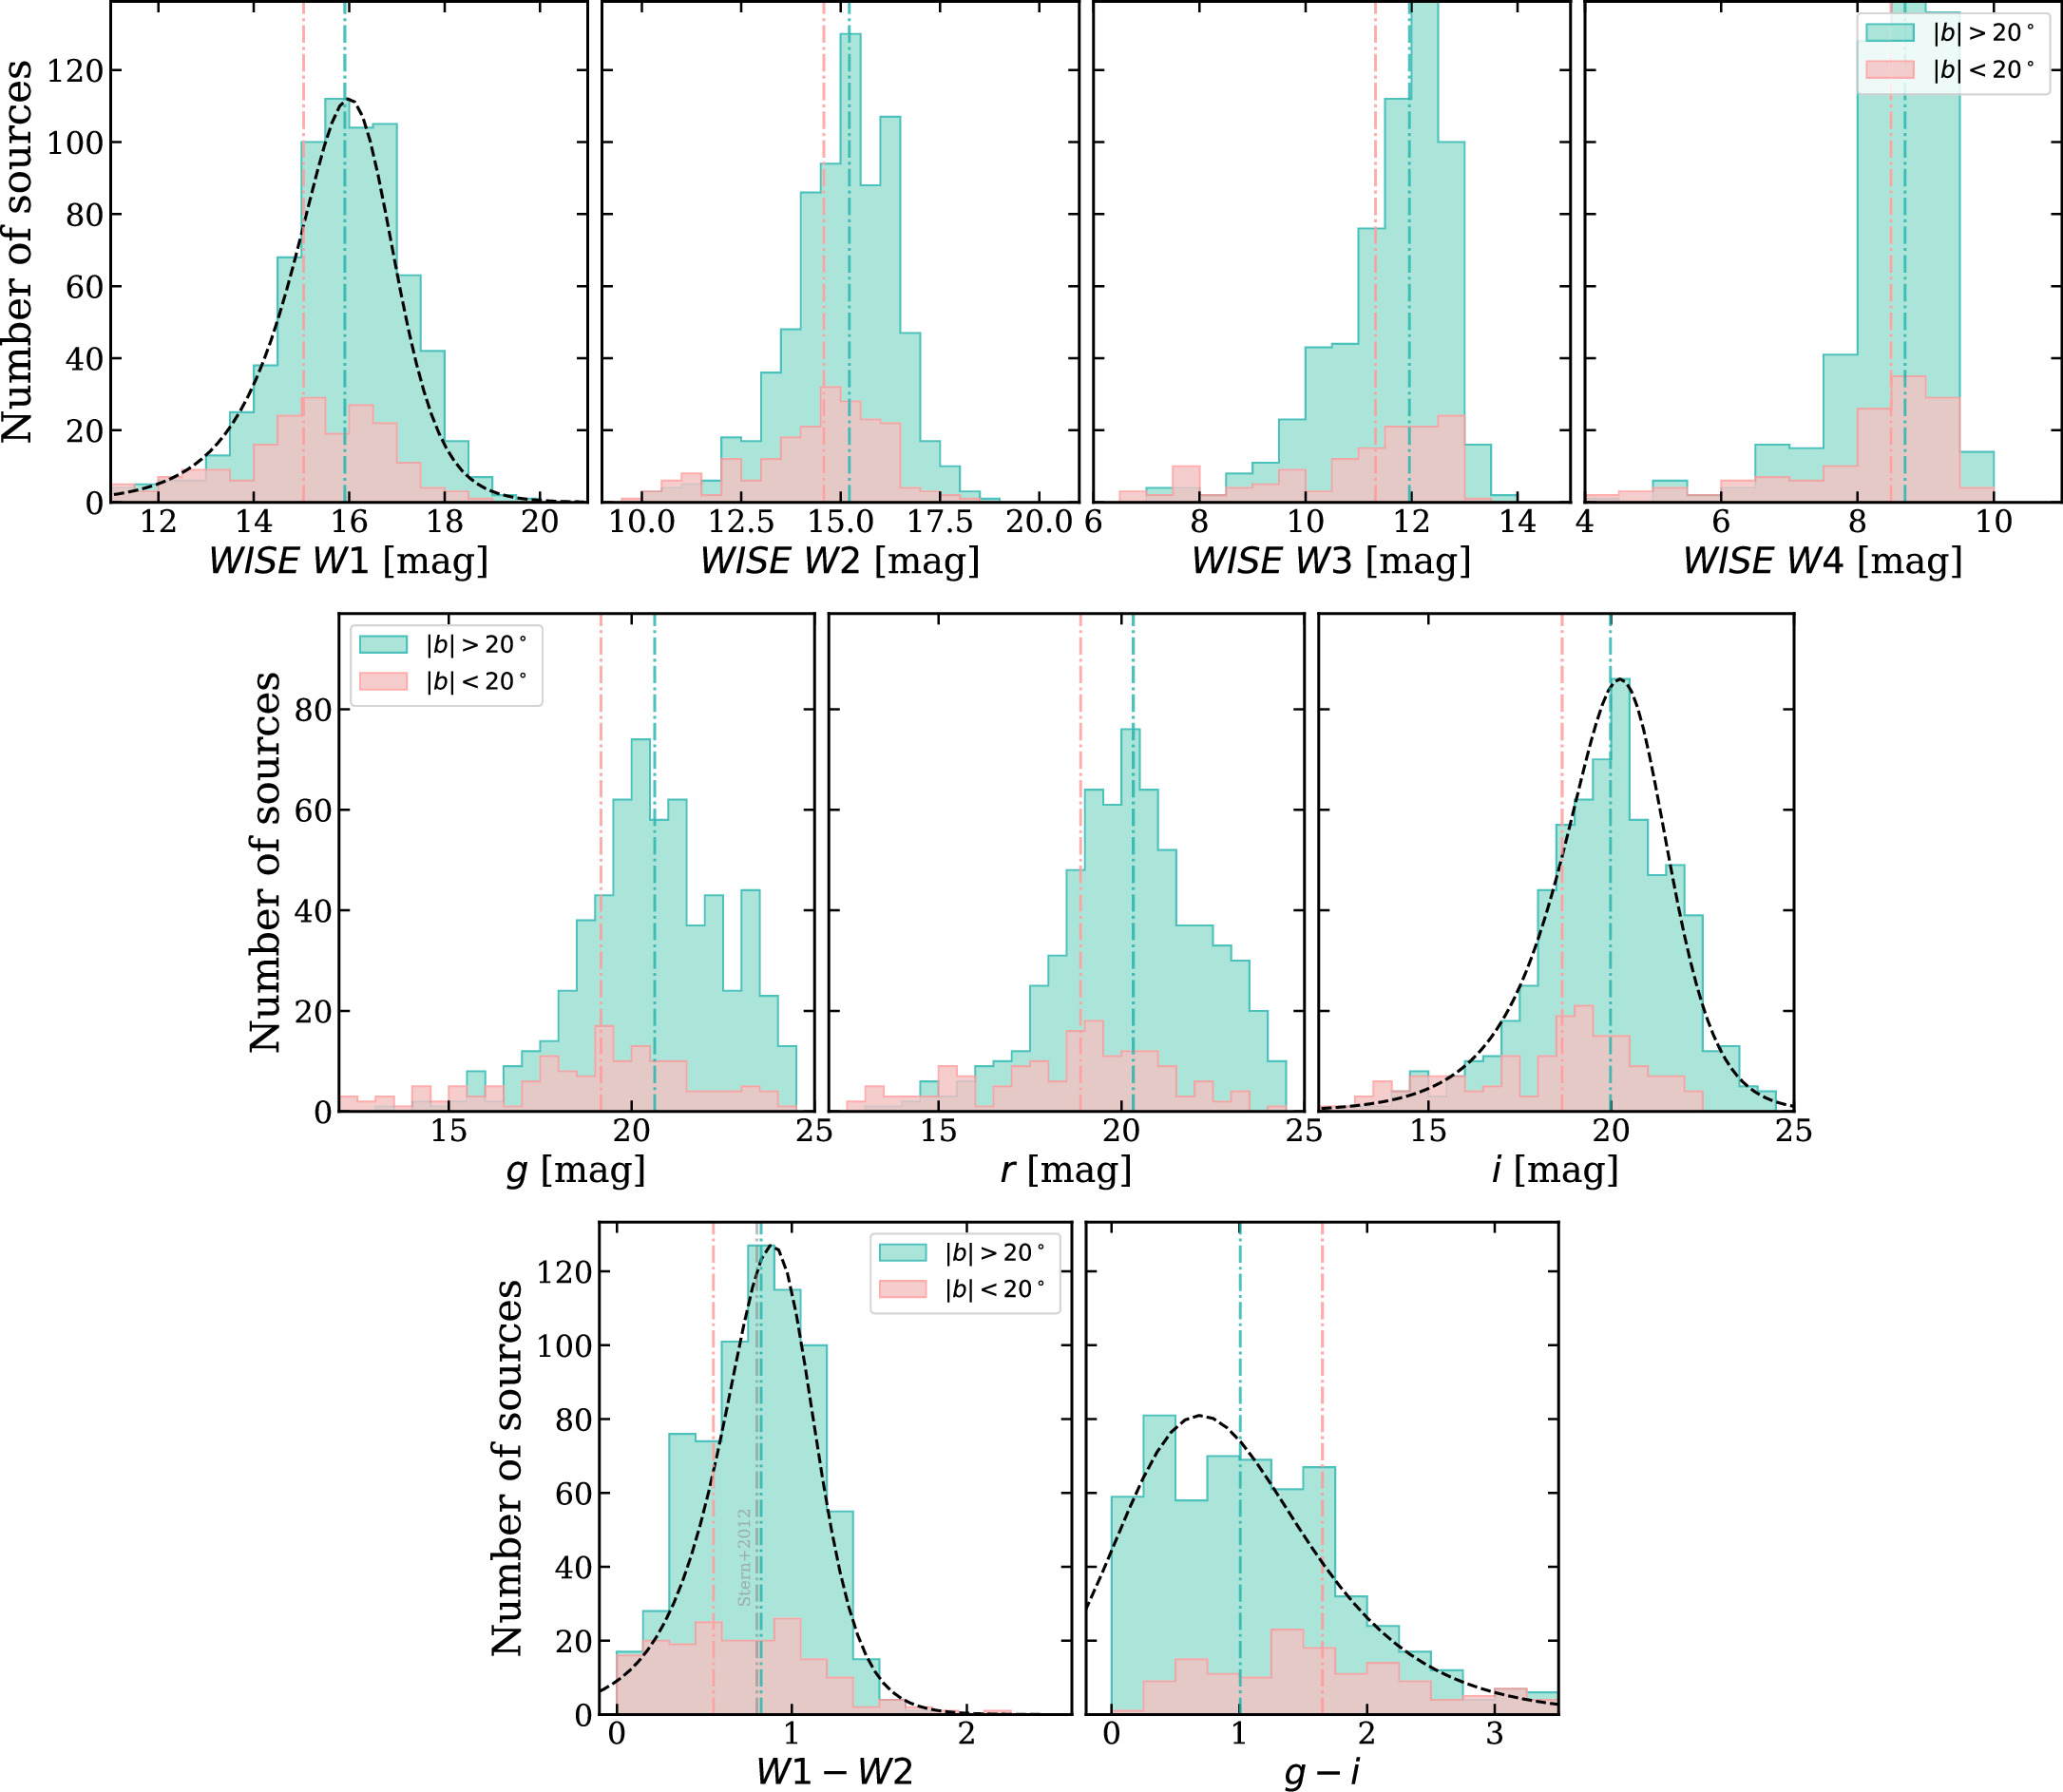
Figure 15. Distributions of the MIR and optical magnitudes and colors for the high-probability Nway-selected counterpart samples at high Galactic latitudes (∣b∣ > 20°; green) and low Galactic latitudes (∣b∣ < 20°; peach). The median of each distribution is plotted with a dashed–dotted line. The dashed black lines indicate the distributions constructed in Nway Round #1 and used as priors in Round #2. Top four panels: magnitude distributions for the four photometric WISE bands, for the sources with successful CatWISE20 matches satisfying the high-probability cut. Middle three panels: the g-band, r-band, and i-band magnitudes (corrected for Galactic extinction) for all the sources satisfying the Nway high-probability cuts. Bottom two panels: the W1 − W2 and g − i colors for all the sources satisfying the Nway high-probability cuts. These colors are used as priors for Nway. The dashed–dotted gray line indicates the Stern et al. (2012) AGN threshold of W1 − W2 > 0.8. WISE magnitudes are Vega and optical magnitudes are AB.
Download figure:
Standard image High-resolution imageIn addition, the W1 − W2 and g − i colors for all the sources satisfying the Nway high-probability cuts are shown in the bottom panels of Figure 15. The median W1 − W2 for high-Galactic-latitude sources is similar to the AGN threshold of W1 − W2 = 0.8 presented in Stern et al. (2012).
3.3. Optical Spectroscopy
To maximize the scientific impact of the NuSTAR observations and to explore the intrinsic source properties, we carried out a major, coordinated spectroscopic campaign using a broad range of telescopes across the globe to obtain redshifts of the NSS80 sources. The analysis of and classifications obtained from these new spectroscopic data and those from preexisting spectroscopy are described in Section 3.3.3.
3.3.1. Dedicated Follow-up Campaign
L17 obtained spectroscopic redshifts for 276 of the 497 NuSTAR serendipitous sources through multiyear observing programs in both hemispheres. For NSS80, we continued the multiyear spectroscopic follow-up campaign with the following telescopes:
- 1.In the Northern Hemisphere, we used a combination of the 5.1 m Hale Telescope at the Palomar Observatory (decl. ≳ −21°; PIs: F. A. Harrison and D. Stern) and 10 m Keck I at the W. M. Keck Observatory (−35° ≲ decl. ≲75°; PI: F. A. Harrison), targeting brighter targets preferentially with the former and fainter targets with the latter.
- 2.In the Southern Hemisphere, we used a combination of the 8.2 m Very Large Telescope (VLT) at the European Southern Observatory (Unit Telescope 1; −70° ≲ decl. ≲10°; PIs: G. B. Lansbury and L. Klindt), and the 11 m Southern African Large Telescope (SALT), which is part of the South African Astronomical Observatory in Sutherland (–80° ≲ decl. ≲20°; PI: L. Klindt).
This multi-latitude campaign resulted in spectroscopic redshifts and classifications for 550 NSS80 sources (including those in L17, two galaxy and four AGN pairs), as summarized in Table 6. We provide the date of the observing run, the telescope and instrument used, and the total number of sources observed, for both visitor- and service-mode observations; this key observing information is listed for each individual source in the spectroscopic catalog (see Appendix E.1 and Table 14). This subset can be selected from the primary catalog with the flag “SpecCAT”; see Table 4. The reader can refer to Table 4 in L17 for a summary of the NSS40 spectroscopic follow-up observations.
Table 6. Chronological List of the Optical Spectroscopic Follow-up Campaign of NSS80 Sources post L17; See L17 for the Details of the NSS40 Spectroscopic Follow-up Campaign
| Visitor Mode | ||||
|---|---|---|---|---|
| Run ID | UT Start Date | Telescope | Instrument | Nsrc |
| 1 | 2016 Oct 2 | Palomar | DBSP | 3 |
| 2 | 2016 Nov 27 | Keck | LRIS | 3 |
| 3 | 2017 Apr 28 | Keck | LRIS | 16 |
| 4 | 2017 Jul 21 | Keck | LRIS | 15 |
| 5 | 2017 Jul 27 | Palomar | DBSP | 7 |
| 6 | 2017 Sep 14 | Palomar | DBSP | 2 |
| 7 | 2017 Sep 16 | Keck | LRIS | 9 |
| 8 | 2017 Nov 22 | Palomar | DBSP | 2 |
| 9 | 2018 Mar 18 | Keck | LRIS | 8 |
| 10 | 2018 Jun 6 | Palomar | DBSP | 9 |
| 11 | 2018 Jul 16 | Keck | LRIS | 4 |
| 12 | 2018 Sep 9 | Palomar | DBSP | 2 |
| 13 | 2018 Oct 3 | Keck | LRIS | 6 |
| 14 | 2019 Mar 7 | Keck | LRIS | 1 |
| 15 | 2019 Jul 22 | Palomar | DBSP | 3 |
| 16 | 2019 Jul 28 | Palomar | DBSP | 1 |
| 17 | 2019 Aug 2 | Palomar | DBSP | 1 |
| 18 | 2019 Aug 23 | Palomar | DBSP | 1 |
| 19 | 2019 Oct 26 | Palomar | DBSP | 7 |
| 20 | 2019 Dec 24 | Keck | LRIS | 15 |
| 21 | 2020 Jun 16 | Palomar | DBSP | 5 |
| 22 | 2020 Sep 12 | Palomar | DBSP | 5 |
| 23 | 2020 Sep 25 | Palomar | DBSP | 24 |
| 24 | 2020 Oct 23 | Palomar | DBSP | 28 |
| Service Mode | ||||
| Run ID | Semester | Telescope | Instrument | Nsrc |
| 25 | P100 | VLT | FORS2 | 13 |
| 26 | P101 | VLT | FORS2 | 12 |
| 27 | P102 | VLT | FORS2 | 9 |
| 28 | P103 | VLT | FORS2 | 17 |
| 29 | 2017-SEM1+SEM2 | SALT | RSS | 4 |
| 30 | 2018-SEM1+SEM2 | SALT | RSS | 10 |
| 31 | 2019-SEM1+SEM2 | SALT | RSS | 8 |
| 32 | 2020-SEM1 | SALT | RSS | 3 |
Notes. Listed for visitor-mode observations are the ID assigned to each observing run, the date of the observing run, the telescope and instrument used, and the number of sources observed. For service-mode observations, we also provide the observing period (semester) and the observing run end date. The different telescope instruments include the Double Spectrograph (DBSP), the Low Resolution Imaging Spectrometer (LRIS), the Focal Reducer and low dispersion Spectrograph (FORS2), and the Robert Stobie Spectrograph (RSS).
Download table as: ASCIITypeset image
We note that all instruments are long-slit spectrographs. A further 44 NSS80 sources were followed up, but we failed to obtain a reliable redshift measurement: 33/44 sources are optically faint (seven undetected in the r band and 26 with r > 20), 9/44 sources have low signal-to-noise ratio (low-S/N) spectra due to compromised observations (either due to weather conditions or telescope failures), one source is optically undetected, but given its radio and X-ray emission it is possibly a radio lobe associated with the science target, and the remaining source is a BL Lac candidate with a power-law continuum lacking spectral features; see Table 14 and Figure E5. Hence, 680/1274 (53%) NSS80 sources have not yet been targeted for spectroscopic follow-up.
3.3.2. Spectroscopic Observations and Data Reductions
Since the spectral features of the NSS80 sources are not known a priori, we adopt a broad wavelength coverage with sufficient spectral resolution to search for, identify, and accurately measure any spectral features. Therefore, two grating angles were selected for each target observation with Keck, Palomar, and SALT, whereas a broad wavelength coverage was achieved with a single camera station for VLT.
66
This allowed us to access the 3200−9000 Å visible wavelength range and cover commonly known AGN and quasar emission and absorption lines across a range of redshifts. For example, at lower redshifts (e.g., z = 0.3), emission lines such as Mg ii
λ2800, [Ne v] λ3346 and λ3426, [O ii] λ3728, [Ne iii] λ3869, Hδ λ4102, Hγ λ4340, Hβ λ4861, [O iii] λ4959 and λ5007, [O i] λ6300 and λ6364, [N ii] λ6548 and λ6584, Hα λ6563, and [S ii] λ6716 and λ6731 are covered; and at higher redshifts (e.g., z = 2), lines such as Lyα λ1216, Si iv
λ1398, C iv
λ1549, He ii
λ1640, C iii] λ1909, C ii] λ2326, and Mg ii
λ2800 are covered. For all our observations, we adopted a slit width of 1−15, depending on the seeing, and configured the spectrographs to obtain low-resolution spectra (i.e., a resolving power of R ∼ 1000), which is sufficient to achieve our science goals.
For the majority of observations, a total of two exposures were obtained (with the exception of very bright targets), and in the case where dithering was requested, one horizontal tile and two vertical tiles with a maximum offset size of 10″ were obtained. 67 Calibration images (flat fields and arc frames) were also recorded, and spectrophometric standard stars were observed in the different instrument configurations for flux calibration. It should be noted that, due to the design of SALT, the spectra cannot be absolute flux calibrated. This is due to the moving pupil during exposures and tracking, which consequently changes the effective area of the telescope. Therefore, the standards were only used for relative spectral (shape) calibration.
The spectroscopic data reductions included basic CCD pre-reductions, spectral calibration, background subtraction, spectral extraction, and flux calibration. The tasks available in iraf were used to perform the reduction and analysis processes for the Keck, Palomar, and SALT spectra, 68 and the EsoReflex 2.9.1 pipeline was used to reduce the VLT/FORS2 spectra; for more details, see Section 4.4 of Klindt (2022). The final flux-calibrated optical spectra described herein are available in Appendix E.1 and will be made available on the NSS80 web page; see Section A.2 in L17 for the NSS40 optical spectra.
3.3.3. Spectral Classification and Analysis
To assist in the measurement of spectroscopic redshifts, we used the open-source Manual and Automatic Redshifting software (Marz; Hinton et al. 2016) by matching the observed flux-calibrated input spectra (FITS file format) against a library of stellar, galaxy, and AGN templates available in the Marz web application; see Figure 6 in Hinton et al. (2016) for a visual display of the 12 (five stellar + six galaxy + one AGN) current templates available in Marz. 69 Via this manual template comparison approach, the object type can easily be identified and the spectrum can be redshifted to align the observed spectral lines with the template (for moderate- to high-S/N spectra). From this, Marz provides a redshift solution; however, it does not assign uncertainties to the redshifts (see Yuan et al. 2015, for more details). For low-S/N spectra where template comparison and line identification are arduous, we identified potential spectral features and used a look-up table of wavelength ratios based on the emission and absorption lines observed in AGN and galaxy spectra for spectral lines. The redshift solution is then determined by crossmatching the observed wavelength ratios of the identified lines to the rest-wavelength ratios based on the emission and absorption lines observed in AGNs. Sources with low-S/N spectra or dubious redshift measurements are flagged in the catalog.
During the full 80 month period, including L17, we obtained redshift measurements for 550 NuSTAR sources, of which we spectrally classified 547 (this accounts for 43% of the NSS80 primary catalog): 427 were obtained via our optical follow-up campaign and 123 from archival data (primarily SDSS Data Release 16, DR16; Ahumada et al. 2020; see Table 14 for details). The source classifications and redshift measurements for all NSS80 sources with optical spectra are provided as supplementary material in Appendix E.1. The majority of the sources have robust redshift measurements obtained from two or more spectral lines, while 21/550 sources have a single-line measurement; these sources are flagged as “quality B” redshift measurements. Sources were selected for follow-up based on target visibility, chances of success given optical magnitude and instrument characteristics, and where possible higher-probability counterparts were chosen. However, many targets were included in telescope observing programs as filler targets, and thus the selection is not completely uniform.
Based on the spectroscopic redshift measurements, 492/550 NSS80 sources are extragalactic and 58 are Galactic. The extragalactic sources are classified through visual inspection of the flux-calibrated spectra into the following general classes, and subsets can be selected from the primary catalog using the “Classification” column (see Table 4):
- 1.Broad-line object (BL) if any permitted line is significantly broader than the forbidden lines, or if a single-line measurement for our quality “B” spectra satisfies the standard definition of a broad line, i.e., FWHM ≥ 1000 km s−1 (measured in iraf).
- 2.Narrow-line object (NL) if the permitted lines are of similar width to the narrow forbidden lines.
- 3.Galaxy (Gxy) if only absorption lines are detected.
Based on this simple classification scheme, we find that 58% (284/492) are BL AGNs, 39% (194/492) are NL objects, and 2% (10/492) are Gxy; see Figure 16. We also classify 1/492 source as a galaxy cluster (GClstr; NuSTARJ132535–3825.6) and 3/492 sources have redshift measurements obtained from the literature but lack spectroscopic classification. We append the optical classification with a “?” symbol for 29 sources (12 BL? + 17 NL?) where it is ambiguous whether the permitted lines are broad or not. Regardless of the optical classification, the vast majority of the sources are expected to be AGNs due to the detection of X-ray emission at high X-ray energies of >3 keV, which is further confirmed for most sources by the identification of strong optical emission lines often superimposed on a power-law spectrum. The 58 Galactic sources are not classified here, but based on the NSS40 results they are likely to include, for example, cataclysmic variables, X-ray binaries, and active stars; 40% (23/58) of the Galactic sources are at low Galactic latitudes (∣b∣ < 10°). The number of Galactic NuSTAR sources has increased by a factor of ∼3 from the NSS40 catalog to the NSS80 catalog. These sources will be further investigated through an additional follow-up campaign (see, e.g., Tomsick et al. 2018, for a study of the L17 Galactic sources). There are also 43 NSS80 targets which we followed up but failed to obtain a reliable redshift measurement. For all these cases a faint (often red) continuum is detected, one of which is a Fermi BL Lac candidate (NuSTARJ081003–7527.2) with a featureless power-law spectrum (Ackermann et al. 2016). Possible reasons for the lack of spectroscopic identifications for these sources are given in Section 3.3.4. Finally, the remaining source (NuSTARJ204256+7503.1) is a hotspot associated with the primary NuSTAR science target 4C 74.26, a radio quasar at z = 0.104 (e.g., Erlund et al. 2007, 2010). Figure 17 shows multiwavelength imaging of the NuSTAR-detected hotspot at a projected distance of ∼580 kpc from the quasar. Hence, in total there are 594 unique source entries in the NSS80 spectroscopic catalog given in Table 14. Figure 16. A pie chart of the NSS80 source classifications obtained via our spectroscopic follow-up campaign. In total, there are 612 source entries in the NSS80 spectroscopic catalog: 594 unique spectroscopic entries and 18 additional entries. Of the 594 unique entries, we have classified 492 as extragalactic sources, including 284 BL (or BL?), 194 NL (or NL?), one galaxy cluster, 10 galaxies, and three unclassified sources with redshift measurements from the literature. We have also classified 58 Galactic sources at z = 0. There are a further 43 sources that lack a reliable redshift measurement, 28 of which are unclassified due to the lack of spectral lines, but a power-law continuum is detected in all of the cases, 14 sources have counterpart uncertainties due to the lack of a lower-energy X-ray counterpart or high optical source density, and one source is a Fermi BL Lac candidate. The remaining one source is a hotspot of 4C 74.26 (radio quasar), which was targeted as the primary NuSTAR science target; see Figure 17. In addition to the unique entries, we obtained spectra for a further 18 sources: three AGN pairs, of which one pair is a dual AGN system, two AGN–galaxy pairs, one galaxy pair, one unclassified pair (see Figure 18), seven sources with photometric redshifts, and four sources which are potentially the correct counterpart opposed to the one selected; three out of four are fainter lower-energy X-ray sources (two BLs + one phot-z source of unknown type) nominally closer to the NuSTAR source than the selected (X-ray brighter) BL counterpart, and the remaining source is an optically bright NL galaxy at a different redshift than the Nway-selected NL counterpart (which is associated with the primary NuSTAR science target). Download figure: Figure 17. Multiwavelength imaging of the luminous X-ray hotspot in 4C 74.26 (e.g., Erlund et al. 2010), the primary NuSTAR science target. The hotspot, which coincides with a radio-bright lobe of 4C 74.26, is detected with both lower-energy (i.e., Chandra, XMM-Newton, and Swift-XRT) and hard X-ray observatories such as NuSTAR. Download figure:
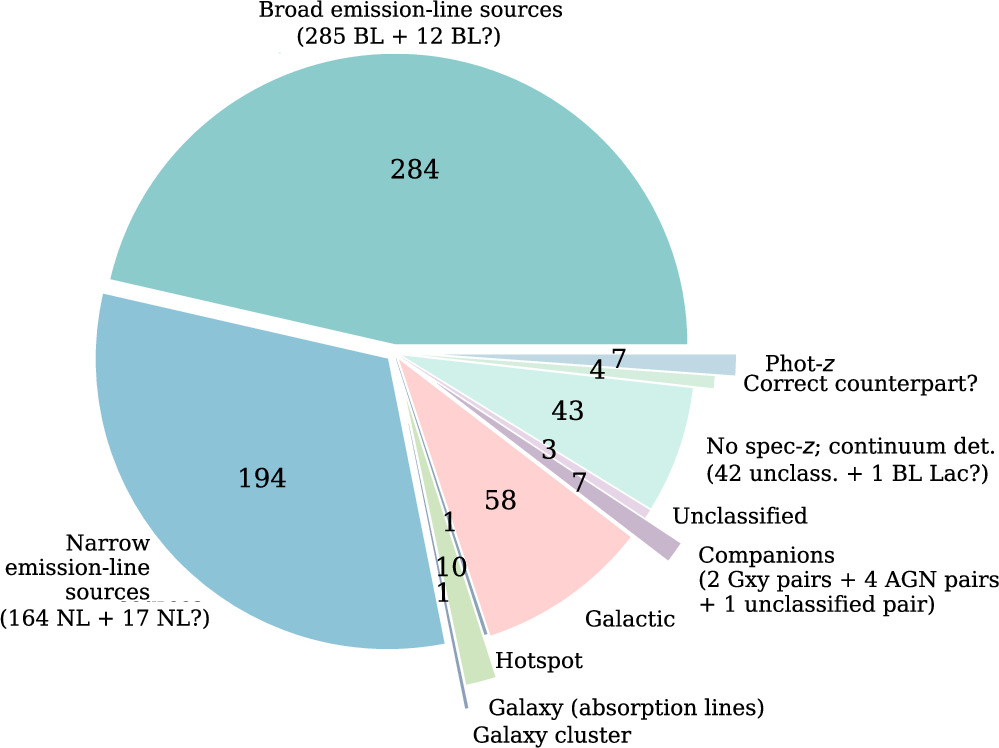
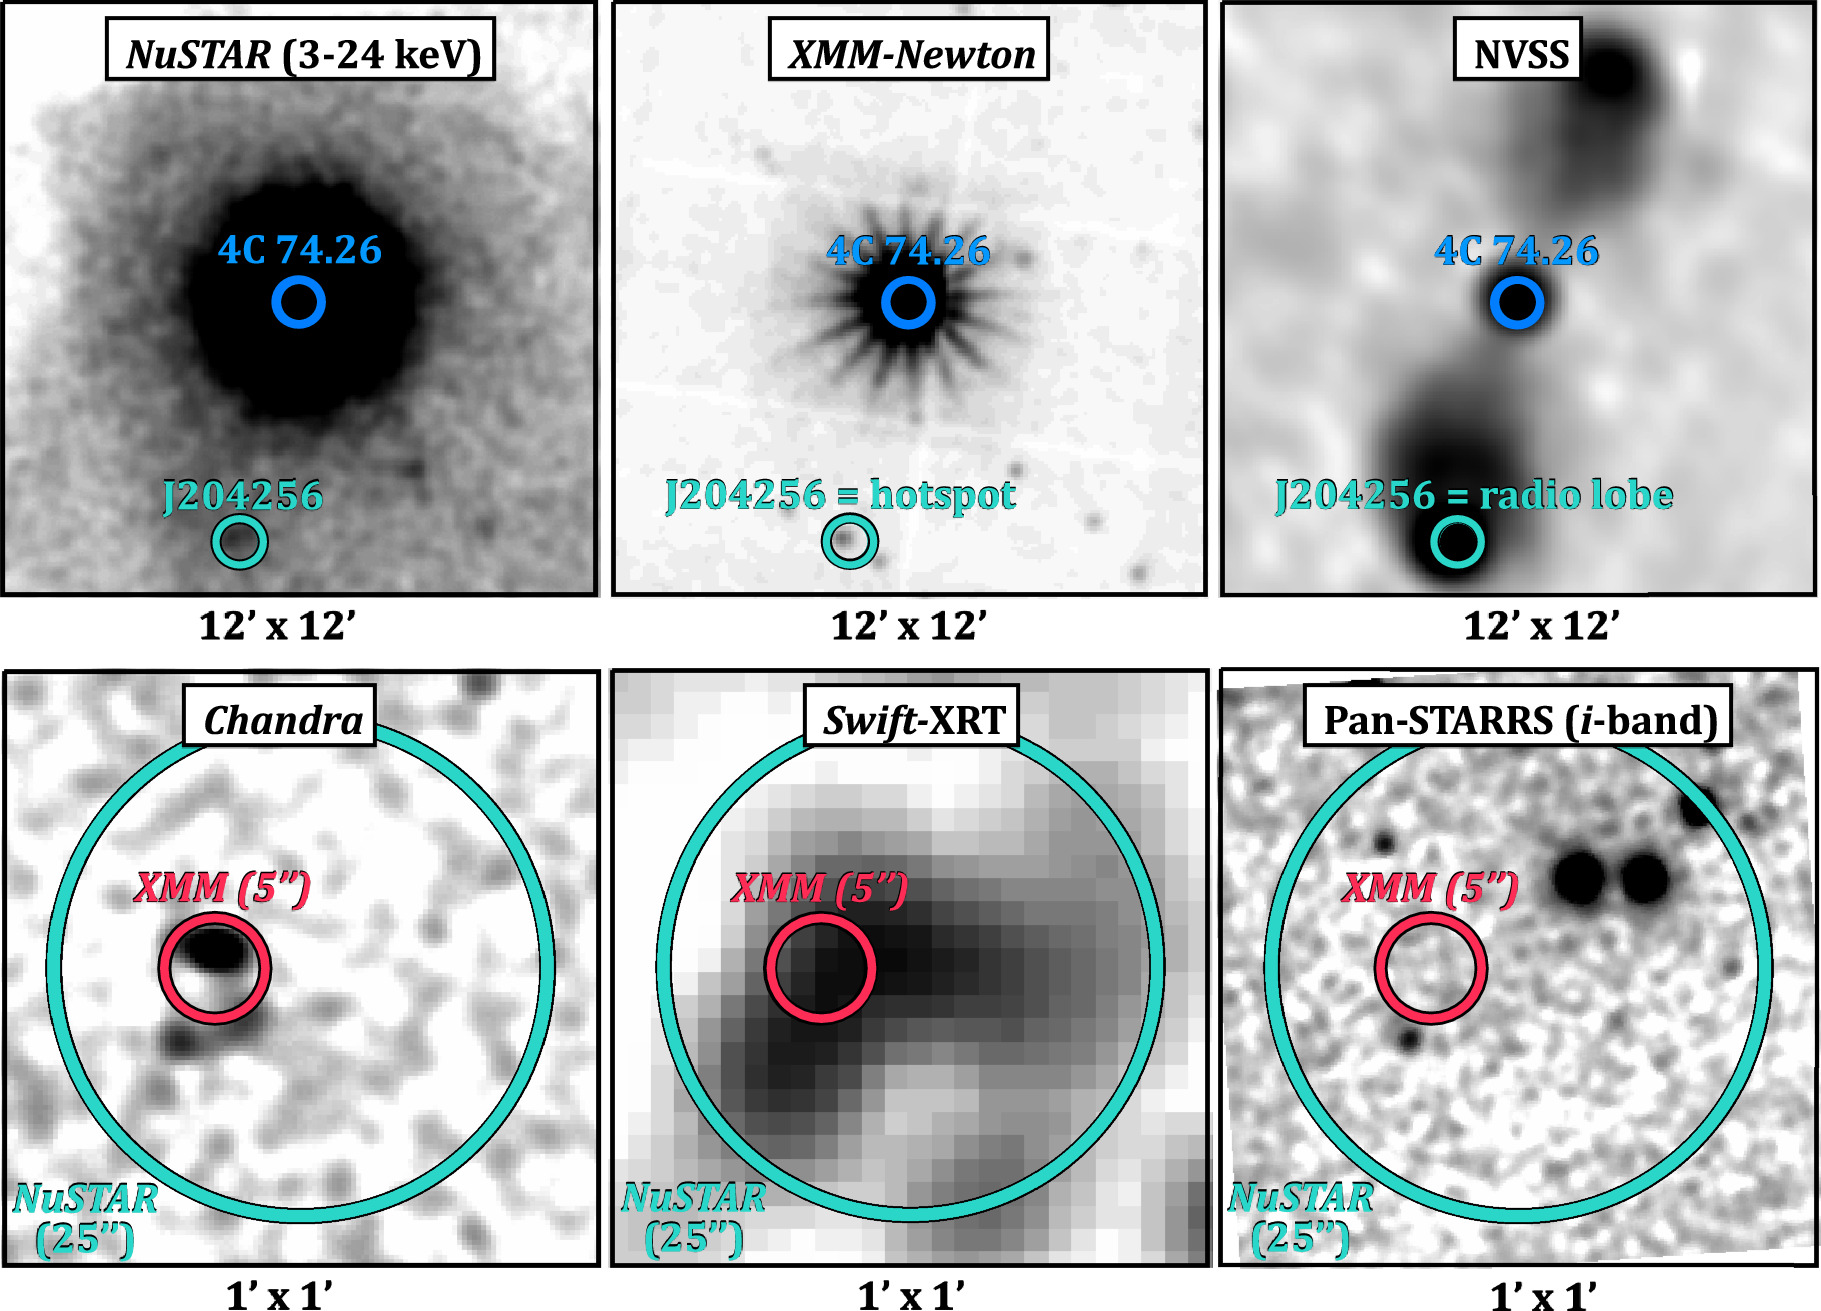
In addition to the unique spectroscopic entries, we obtained spectra for a further 18 cases where two potential optical/IR counterparts were identified. This gives a total of 612 entries in the NSS80 spectroscopic catalog (i.e., 18 NuSTAR sources have duplicate entries to capture information for both targeted counterparts). Notably, among these there are six sources with companions (i.e., in pairs with Δz < 0.1): three AGN pairs, two AGN–galaxy (AGN-Gxy) pairs, and one galaxy pair. In Figure 18, optical spectra of the three AGN pairs are shown (the main target spectra are plotted in black and their companions in peach), and Figure 19 shows the two AGN–galaxy pairs and the galaxy–galaxy pair. We also show the spectra of a candidate source pair (NuSTARJ020614+6449.3) at low Galactic latitude, for which both sources only have a faint, red continuum detected. The source information for these systems is provided in Table 7. For the three AGN and two AGN–galaxy pairs the projected physical distances are in the range ∼15–160 kpc. These include the following:
- 1.NuSTARJ054231+6054.4: a dual AGN system at z = 0.257, comprising a pair of likely merging, obscured AGNs (in X-rays, there is lower-energy X-ray coverage with Swift-XRT but no detection; in optical, their spectra show only narrow lines). The term dual AGN refers to a system where two AGNs at the same redshift are identified at a small separation angle. Koss et al. (2016) reported on the first dual AGN identified with NuSTAR, i.e., SWIFTJ2028.5+2543—a system where both nuclei are heavily obscured to Compton thick (CT; NH ≈ (1−2) × 1024 cm−2).
- 2.NuSTARJ091534+4054.6: a BL AGN pair at z = 1.298, comprising two closely associated quasars.
- 3.NuSTARJ120530+1649.9: an AGN pair including a BL AGN (WISEAJ120530.63+164941.4; Ahn et al. 2012; Toba et al. 2014) and an NL AGN at z = 0.217. This pair is at the same redshift as the primary NuSTAR science target (WISEAJ120547.71+165107.9; Darling & Giovanelli 2006) and is, therefore, associated with the luminous IR galaxy (see Table 8).
- 4.NuSTARJ022742+3331.5: an AGN-Gxy pair at z = 0.09 which is composed of a “borderline” NL AGN and a star-forming galaxy, confirmed by Baldwin, Phillips & Telervich (BPT) diagnostics. The NL AGN is detected in all three NuSTAR bands.
- 5.NuSTARJ184552+8428.2: an AGN-Gxy pair at z = 0.233 comprising an NL AGN and an early-type galaxy companion, which are in the same halo as the NuSTAR science target (see Table 8). The NL AGN is detected in all three NuSTAR bands with a soft-band luminosity of L3−8 keV = 1.91 × 1043 erg s−1, indicating that it is indeed an X-ray AGN.
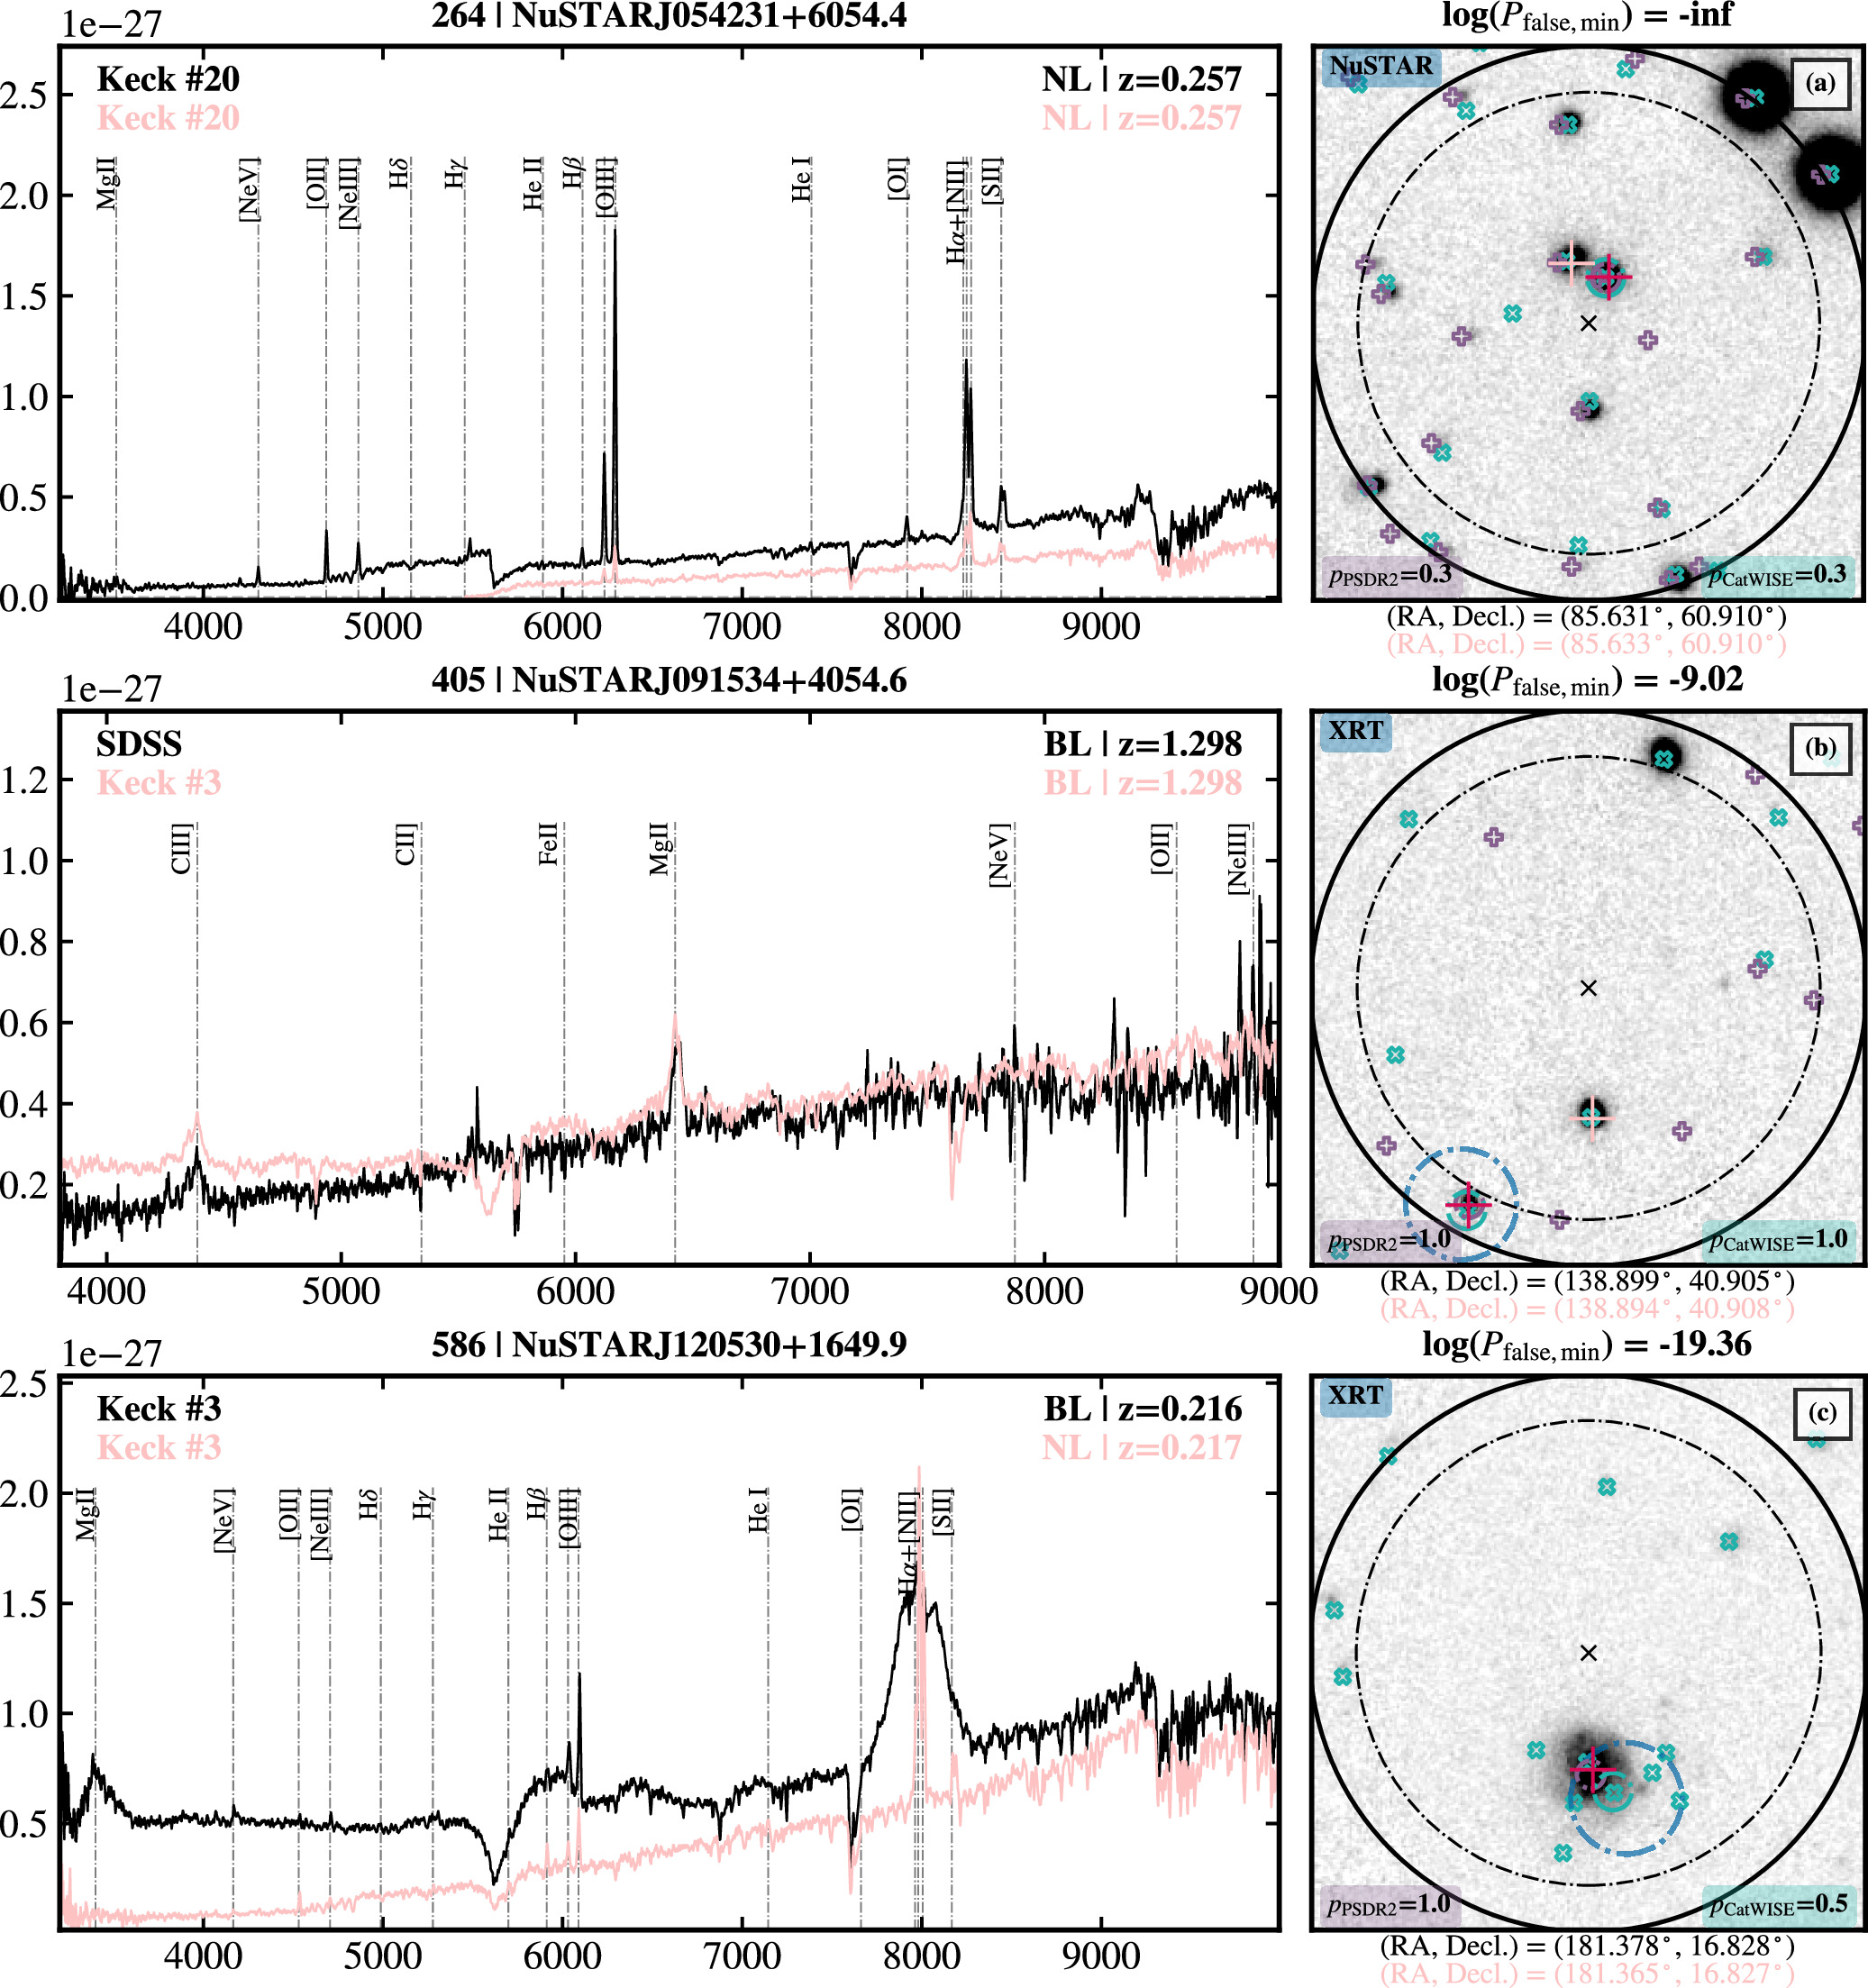
Figure 18. Optical spectra for the three NSS80 AGN pairs: (a) a dual AGN system of merging, obscured AGNs, (b) a BL AGN (i.e., quasar) pair, and (c) a BL AGN + NL AGN pair. For each source pair the two spectra are plotted in the left panel and a 30″ × 30″ Pan-STARRS (or DECam for sources with decl. < −25°) i-band image centered on the NuSTAR position is shown on the right. Spectrum panel: shown on the top are the unique NuSTAR ID and source name, in the upper-left corner the observing telescope and run identification number (corresponding to Table 6), and in the upper-right corner the source classification and redshift. Sky subtraction has been performed, but some features may remain, e.g., the 7600 Å absorption feature. Image panel: all WISE detections are shown with “×” marks, color coded in W1 − W2 colors: non-AGN-like sources with W1 − W2 < 0.8 (green), AGN-like sources with W1 − W2 > 0.8 (red), and non-AGN-like sources based on the W1 − W2 color, but with a bright W3 detection (peach). The NuSTAR 25″ and 30″ error circles are plotted in a dashed–dotted and a solid black line, respectively. The lower-energy X-ray position is marked with a blue cross and the respective error circle, the CatWISE20 position is indicated with a green crosshair, a WISE color-coded star and a green 27 error circle, the PS1-DR2 position is shown with a purple 2″ error circle, and the spectroscopically observed pair of sources are marked with a red and a peach crosshair corresponding to the spectrum (black and peach).
Download figure:
Standard image High-resolution image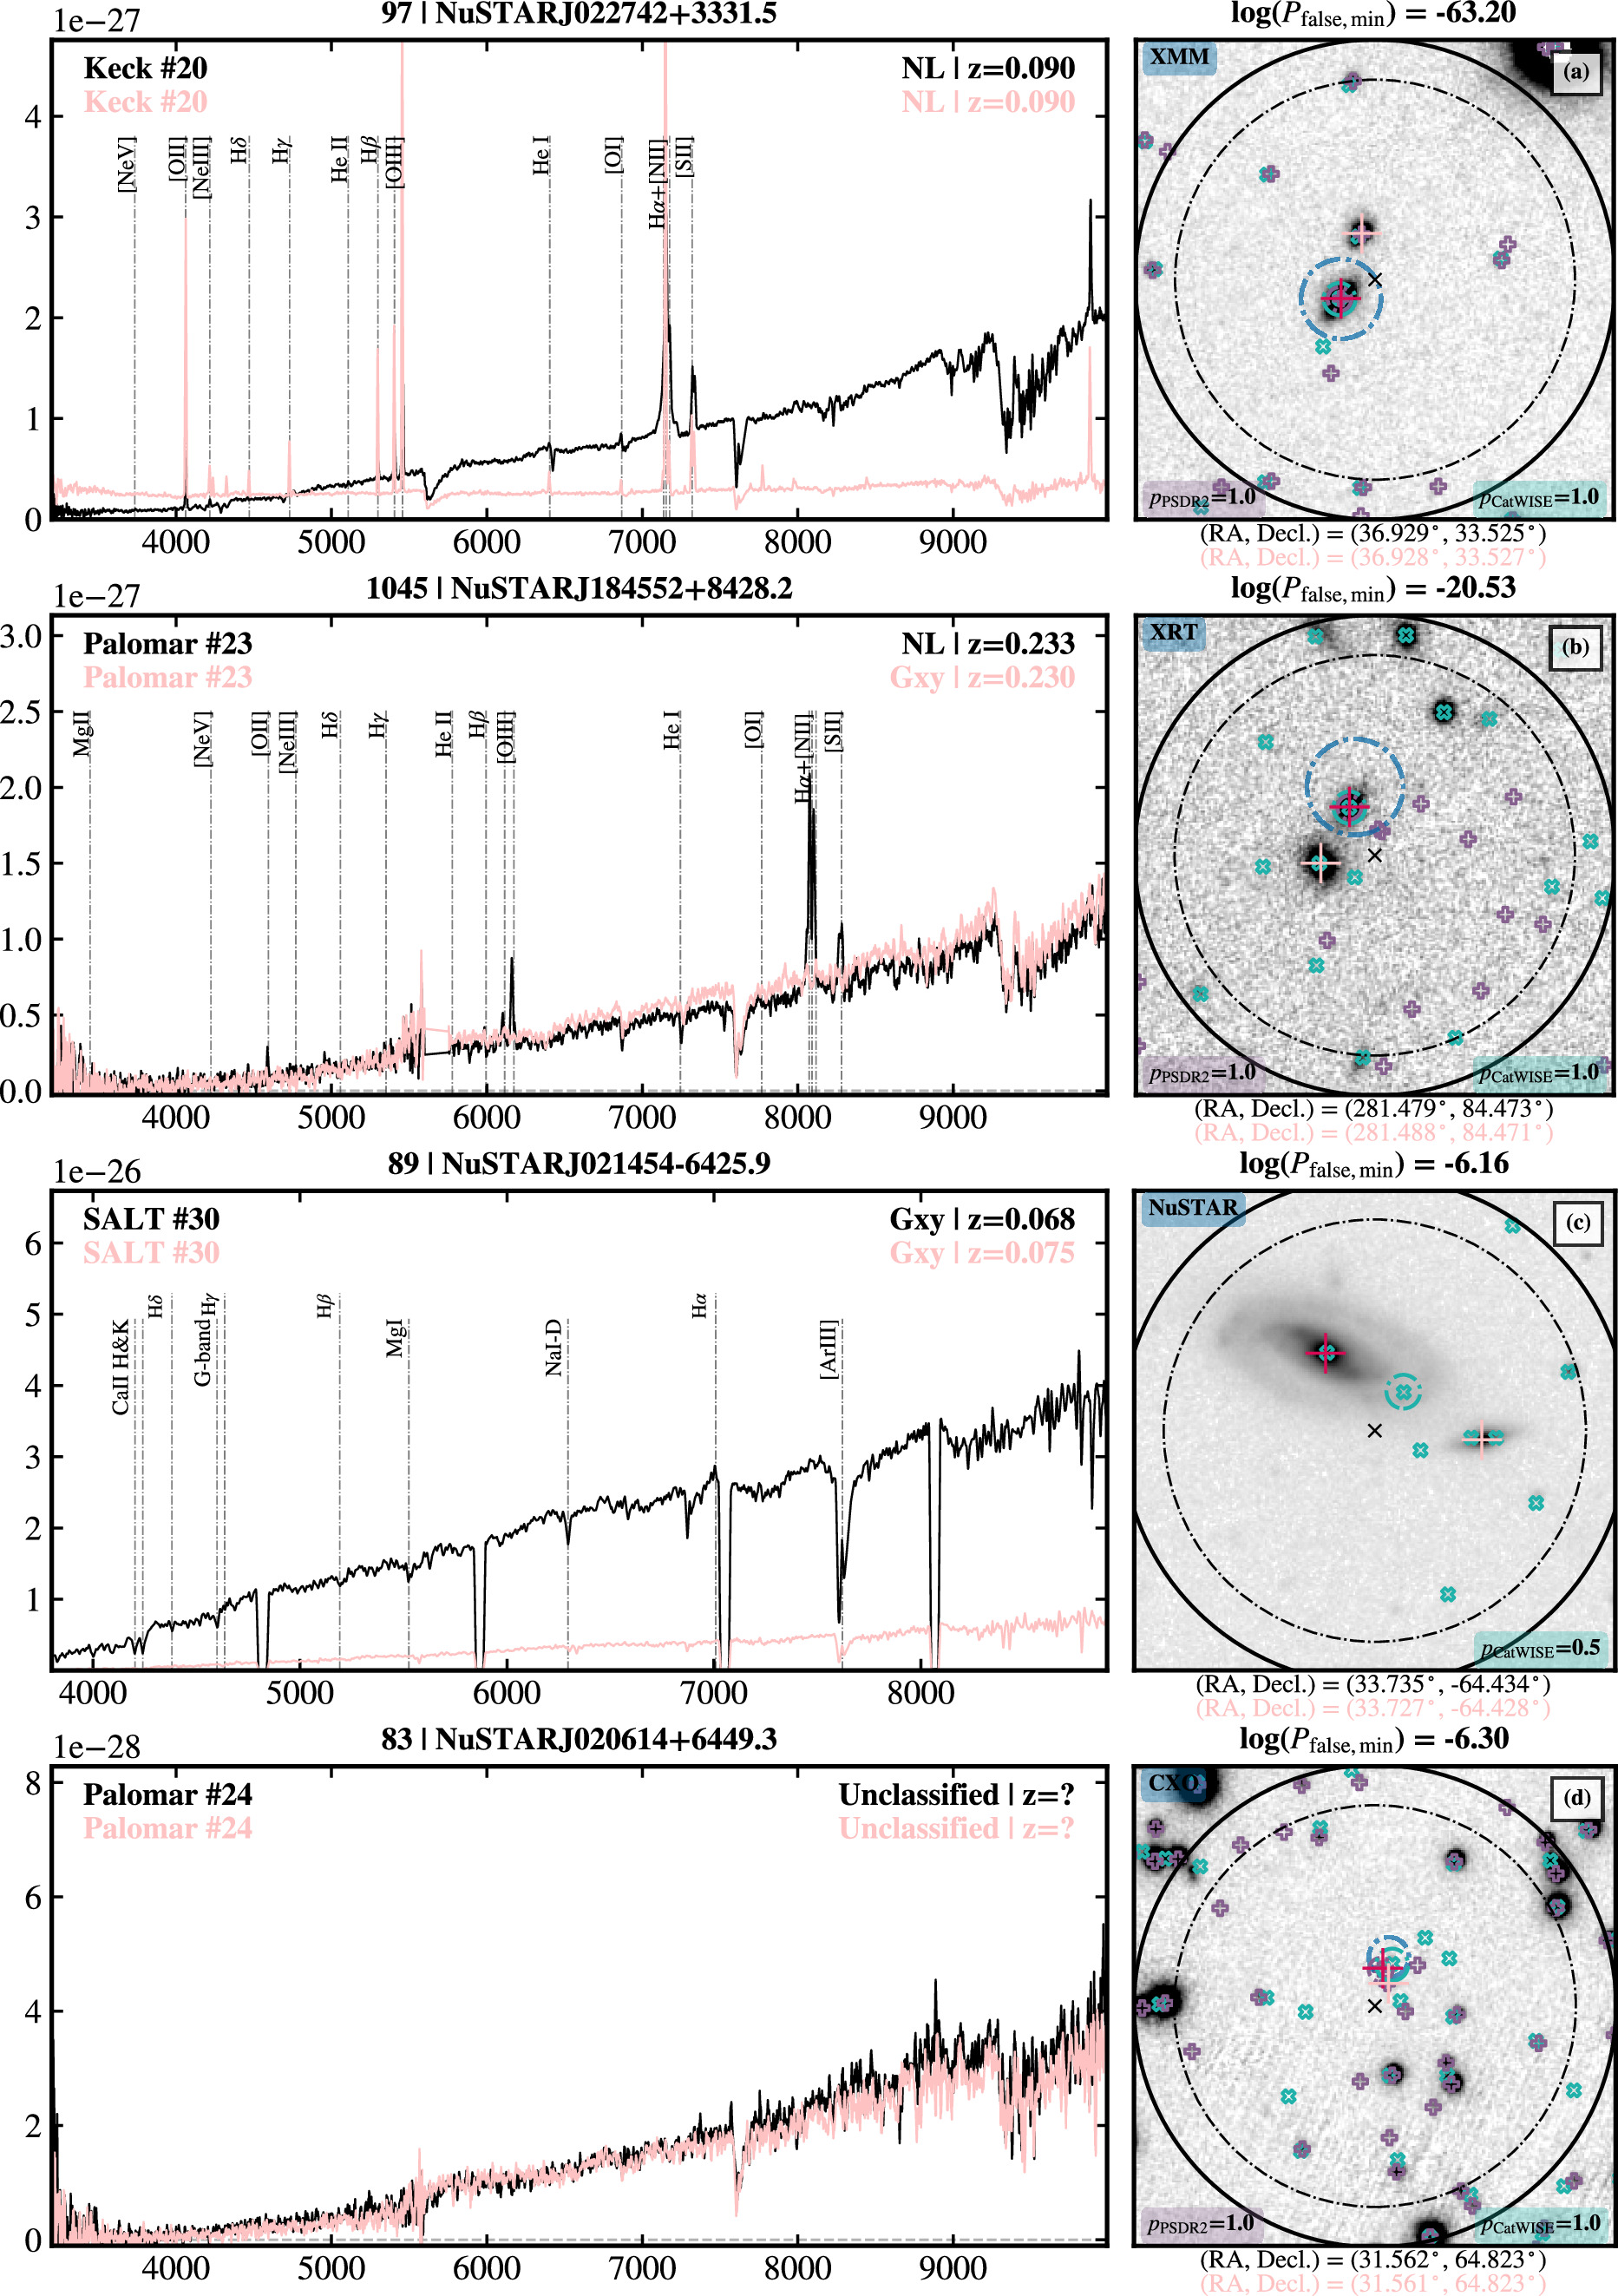
Figure 19. Optical spectra for the two AGN-Gxy pairs ((a) and (b)), one galaxy pair (c), and one pair of sources of unknown type (d). The spectroscopically observed pair of sources are marked with a red and a peach crosshair corresponding to the spectrum (black and peach), or a red and a green crosshair if one of the sources is the CatWISE20 counterpart. See Figure 18 for the symbol key.
Download figure:
Standard image High-resolution imageTable 7. Source Information for the Three AGN Pairs, Two AGN-Gxy Pairs, One Galaxy Pair, and One Pair of Unknown Type
| NSS80 Name | NSS80 Field | NuSTAR | z | L10−40keV | PFlag | Pair | Angular | Physical |
|---|---|---|---|---|---|---|---|---|
| Detection | Type | Distance | Distance | |||||
| (erg s−1) | (arcsec) | (kpc) | ||||||
| (1) | (2) | (3) | (4) | (5) | (6) | (7) | (8) | (9) |
| NuSTARJ054231+6054.4 | BY_Cam | S + H + F | 0.257 | 4.07 × 1044 | 0 | NL AGN + NL AGN | 4.7 | 19.1 |
| NuSTARJ091534+4054.6 | NGC_2785 | F | 1.298 | 6.41 × 1044 | 0 | BL AGN + BL AGN | 16.3 | 138.6 |
| NuSTARJ120530+1649.9 | IRAS12032p1707 | S + H + F | 0.216 | 2.37 × 1043 | 1 | BL AGN + NL AGN | 45.5 | 159.4 |
| NuSTARJ022742+3331.5 | CXOJ022727d5p333443 | S + H + F | 0.09 | 6.33 × 1042 | 0 | NL AGN + NL | 8.9 | 15.1 |
| NuSTARJ184552+8428.2 | 1RXSJ184642d2p842506 | S + H + F | 0.233 | 4.92 × 1043 | 1 | NL AGN + Gxy | 8.1 | 30.3 |
| NuSTARJ021454–6425.9 | RBS0295 | F | 0.068 | 1.21 × 1042 | 1 | Gxy + Gxy | 22.2 | 29.04 |
| NuSTARJ020614+6449.3 | 3C_58 | F | ⋯ | ⋯ | ⋯ | Unknown | 1.99 | ⋯ |
Notes. Columns: (1): unique NuSTAR source name. (2): object name for the primary science target of the NuSTAR observation(s), i.e., the field name. (3): the energy bands for which the source is detected: soft (S; 3–8 keV), hard (H; 8–24 keV), and full (F; 3–24 keV) bands. (4): the spectroscopic redshift of the NuSTAR source. (5): the rest-frame 10–40 keV luminosity; see Figure 26. (6): a binary flag indicating sources that show evidence for being associated with the primary science target of their respective NuSTAR observations, according to the definition Δ(cz) < 0.05 cz. (7): the type of sources for each pair: BL AGN refers to quasars, NL AGN to narrow-line AGNs (from BPT diagnostics), NL to narrow-line objects (e.g., star-forming galaxies), and Gxy to galaxies (absorption lines only). (8): the angular distance for each pair. (9): the projected physical distance for each pair.
Download table as: ASCIITypeset image
Table 8. NSS80 Sources that Show Evidence for Being Associated with the Primary NuSTAR Science Target according to the Definition Δ(cz) < 0.05 cz
| Serendip Name | Serendip Type | zserendip | Primary Target | Primary Type | ztarget | BASS |
|---|---|---|---|---|---|---|
| (1) | (2) | (3) | (4) | (5) | (6) | (7) |
| NuSTARJ002544+6818.8 | NL | 0.012 | LEDA136991 | Sy2 | 0.012 | 1 |
| NuSTARJ010736–1732.3 | NL | 0.021 | IC 1623 | GPair | 0.02 | 0 |
| NuSTARJ012215+5002.2 | ⋯ | 0.021 | MCG+8-3-18 | Sy2 | 0.021 | 1 |
| NuSTARJ021454–6425.9 | Gxy | 0.075 | RBS295 | Sy1 | 0.074 | 1 |
| NuSTARJ024144+0512.3 | NL | 0.07 | IRAS02394+0457 | Sy2 | 0.07 | 1 |
| NuSTARJ035902–3011.7 | NL | 0.093 | SARS 059.33488–30.34397 | Sy1.9 | 0.097 | 1 |
| NuSTARJ040702+0346.8 | NL | 0.088 | 3C105 | Sy2 | 0.088 | 1 |
| NuSTARJ050559–2349.9 | NL | 0.036 | LEDA178130 | Sy2 | 0.035 | 1 |
| NuSTARJ054349–5536.7 | BL | 0.272 | WISEJ054357.21–553207.5 | QSO | 0.273 | 0 |
| NuSTARJ065805–5601.2 | NL? | 0.296 | Bullet Cluster | GxyCluster | 0.296 | 1 |
| NuSTARJ065842–5550.2 | NL | 0.297 | Bullet Cluster | GxyCluster | 0.296 | 0 |
| NuSTARJ071422+3523.9 | NL | 0.015 | MCG+6-16-28 | Sy2 | 0.015 | 1 |
| NuSTARJ120530+1649.9 | BL | 0.216 | WISEAJ120547.71+165107.9 | LIRG | 0.218 | 0 |
| NuSTARJ125442–2657.1 | Gxy | 0.058 | CTS18 | Sy1.2 | 0.059 | 1 |
| NuSTARJ151253–8124.3 | NL | 0.069 | 2MASXJ15144217–8123377 | Sy1.2 | 0.069 | 1 |
| NuSTARJ165105–0129.4 | NL | 0.041 | 2MASXJ16510578–0129258 | Sy2 | 0.04 | 1 |
| NuSTARJ184552+8428.2 | NL | 0.233 | 1RXSJ184642.2+842506 | Sy1 | 0.225 | 1 |
| NuSTARJ190813–3925.7 | Gxy | 0.075 | IGRJ19077–3925 | Sy1 | 0.075 | 1 |
| NuSTARJ224536+3947.1 | NL | 0.081 | 3C452 | Sy2 | 0.081 | 1 |
Notes. Columns: (1): the unique NSS80 name for each serendipitous source. (2): spectroscopic classification of the NSS80 serendipitous source. (3): spectroscopic redshift of the NSS80 serendipitous source obtained with our follow-up campaign. (4): the primary NuSTAR science target name. (5): source type of the NuSTAR science target name. (6): redshift of the NuSTAR science target. (7): a binary flag indicating NuSTAR science targets which are BASS DR2 sources (Koss et al. 2022).
Download table as: ASCIITypeset image
The galaxy pair (NuSTARJ021454–6425.9) is composed of a galaxy at z = 0.068 and a galaxy companion at z = 0.075; the latter is associated with the primary NuSTAR science target (RBS0295; Schwope et al. 2000); see Table 8. The pair of sources are undetected in the NuSTAR soft and hard energy bands with a full-band luminosity of L3−24 keV = 1.52 × 1042 erg s−1, which may be a spurious detection, considering also its low NuSTAR detection probability ![$[\mathrm{log}({P}_{\mathrm{false},\min })\sim -6.2]$](https://content.cld.iop.org/journals/0067-0049/273/2/20/revision2/apjsad4a71ieqn20.gif) and lack of a lower-energy X-ray identification.
and lack of a lower-energy X-ray identification.
The 18 additional spectroscopic entries also include four sources that could potentially be the correct counterparts rather than the one selected in the unique catalog entry; see Figure 20. Three are fainter lower-energy X-ray sources ((a)–(c)) nominally closer to the NuSTAR source than the selected (X-ray brighter) BL counterpart. The correct counterpart for the remaining source (d) is the choice between an optically bright NL AGN (z = 0.036) associated with the BAT-detected primary NuSTAR science target (LEDA178130; Jones et al. 2004, 2009; Lansbury et al. 2017b; Koss et al. 2022), or an NL galaxy (z = 0.137) 125 from the Nway-selected NL AGN, which lacks a lower-energy X-ray counterpart; the former takes preference of being the correct counterpart to the NSS80 source since it is a confirmed AGN. These sources will be further investigated through our multiwavelength follow-up campaign.
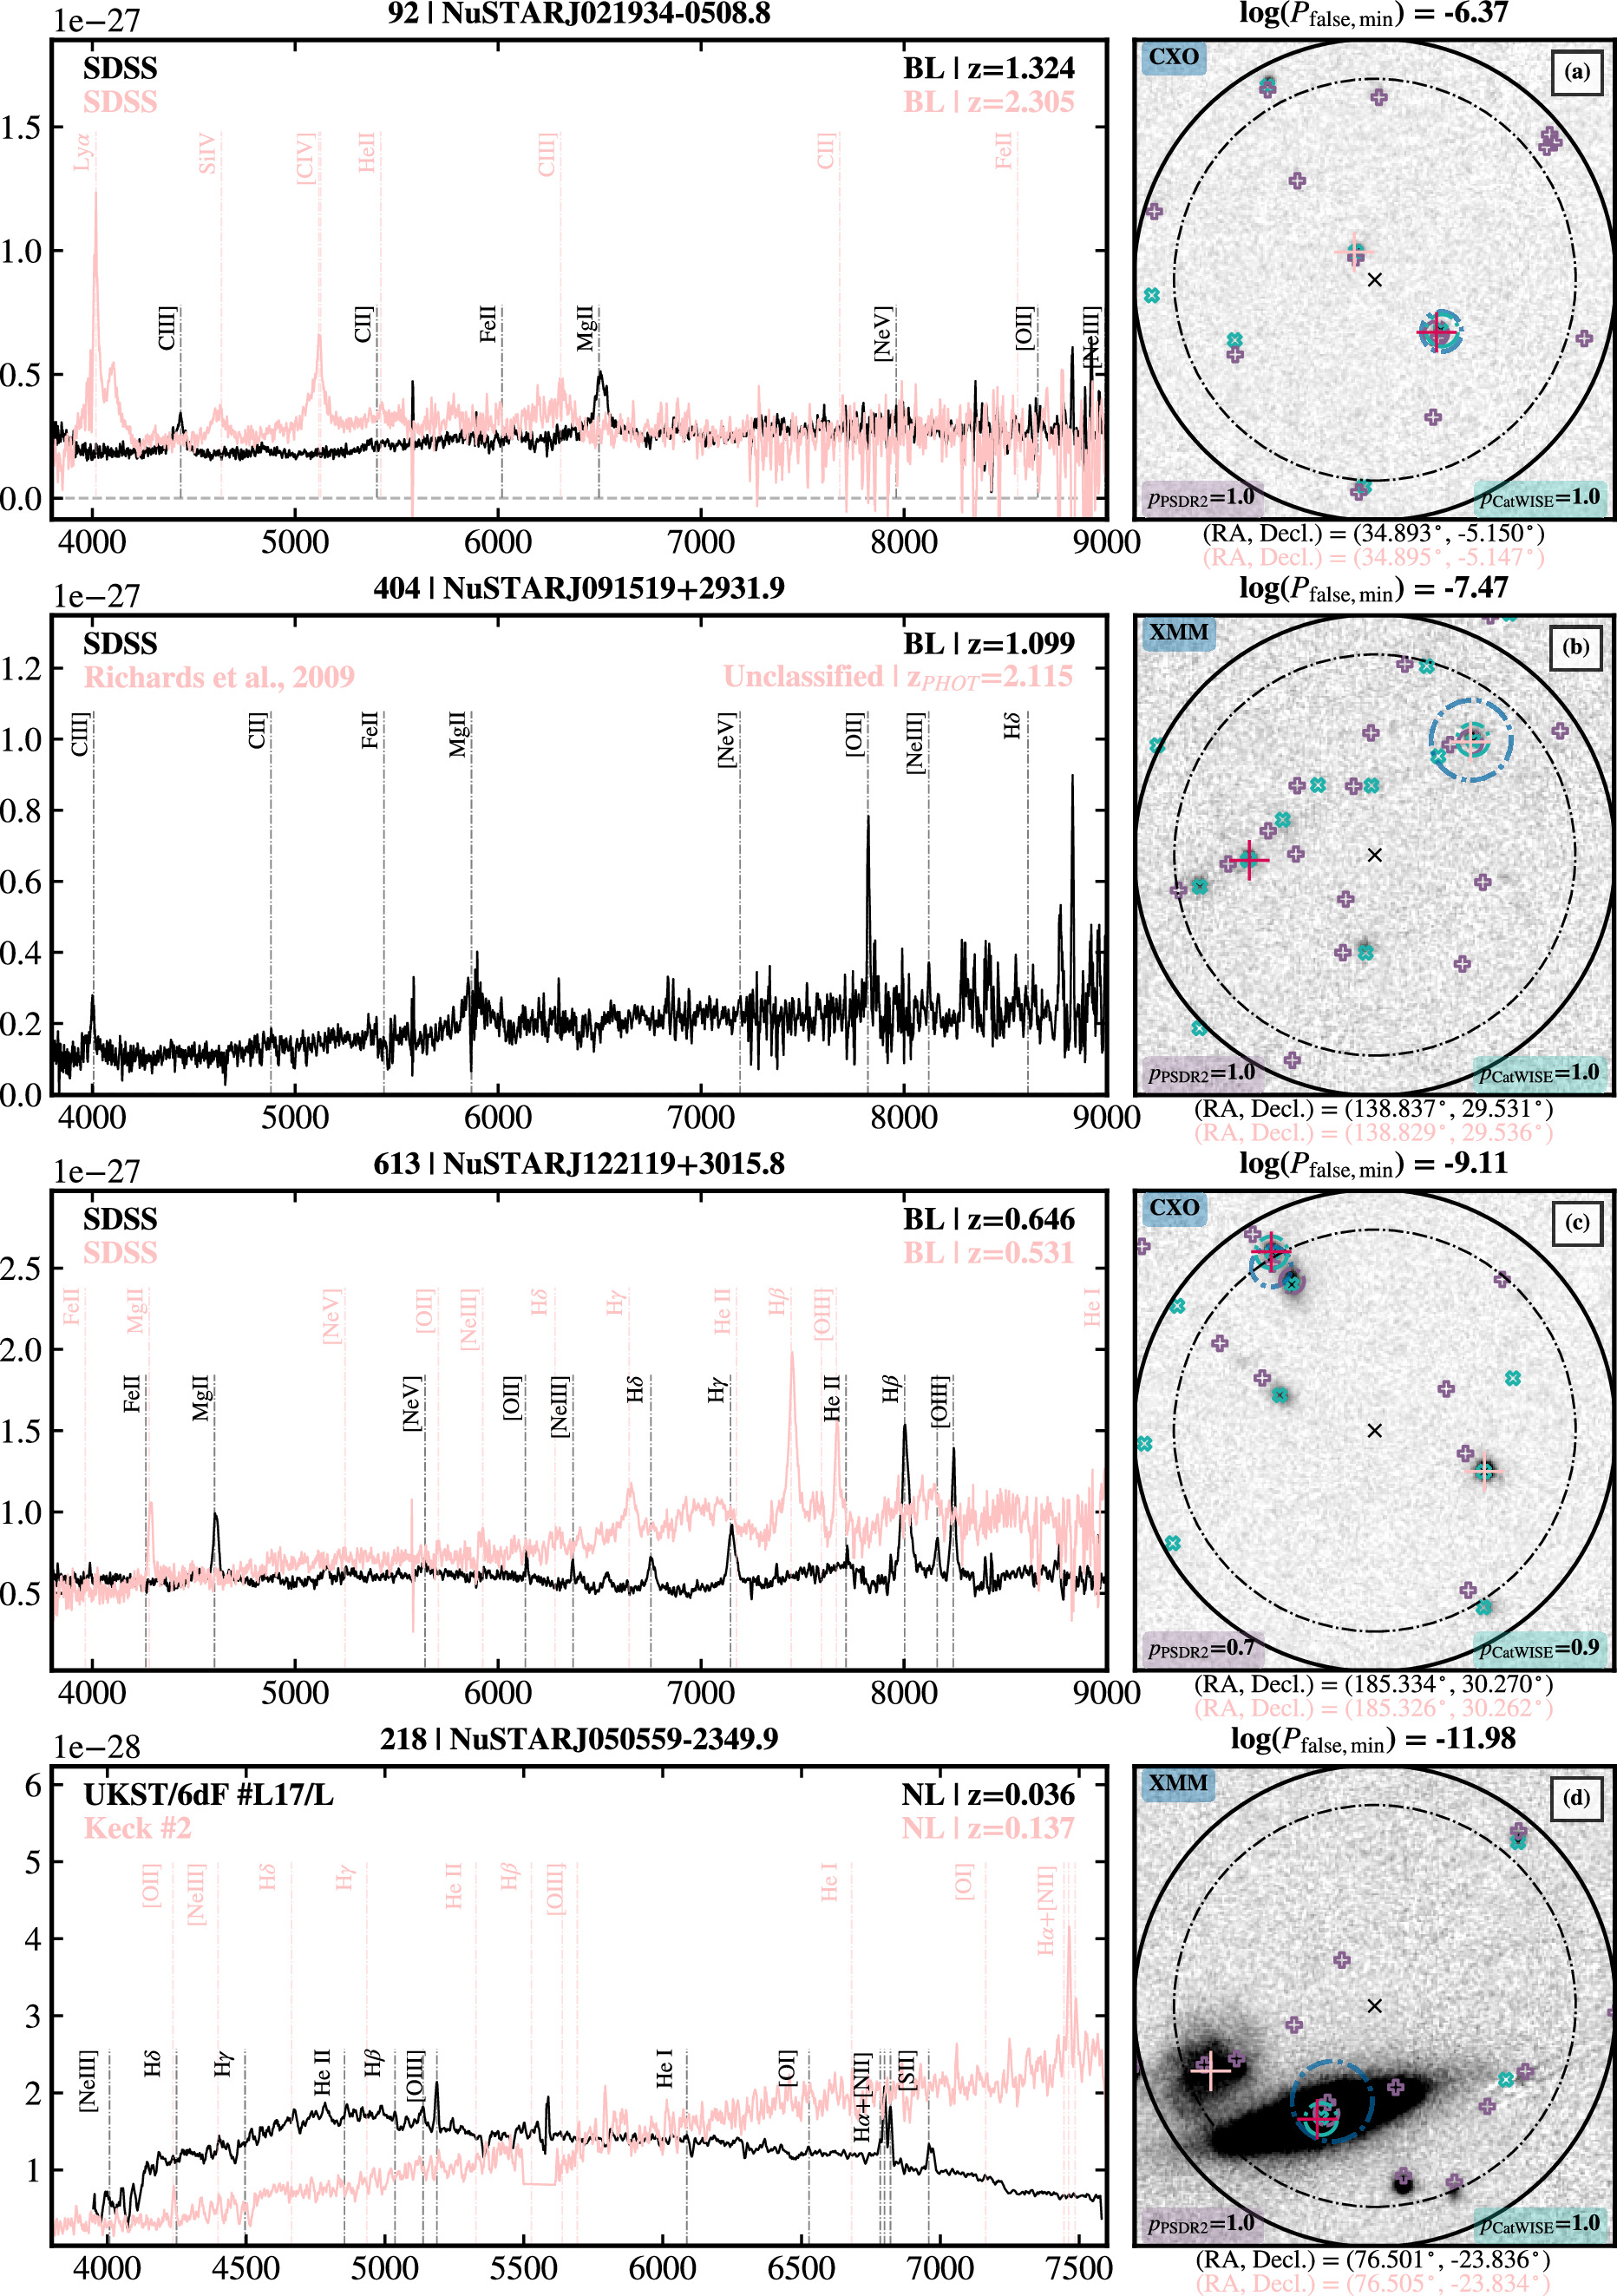
Figure 20. Optical spectra for the NSS80 sources with two counterpart candidates. Three of the four candidates ((a)–(c)) are fainter lower-energy X-ray sources nominally closer to the NuSTAR source than the selected (X-ray brighter) BL counterpart. The correct counterpart for the remaining source (d) is either an optically bright NL AGN (z = 0.036) associated with the BAT-detected primary NuSTAR science target or an NL galaxy (z = 0.137) which lacks a lower-energy X-ray counterpart. See Figure 18 for the symbol key.
Download figure:
Standard image High-resolution imageIn addition to the 550 spectroscopically confirmed redshifts, we also obtained photometric redshifts from the literature for an additional seven NSS80 sources (from Salvato et al. 2009, Richards et al. 2009, Bilicki et al. 1996, and Masini et al. 2020), flagged as “quality C” redshift measurements in the catalog, and for which we append the optical classification with a “C.” We exclude these seven sources with phot-z measurements from any redshift-dependent analysis given the larger uncertainty on phot-z measurements. Overall, the current spectroscopic completeness for the primary NSS80 catalog is 43% (550/1274); this improves to 52% (508/981) for sources at high Galactic latitudes (∣b∣ > 10°). Further ongoing optical spectroscopic campaigns will increase the spectroscopic completeness of the NSS80 catalog, in addition to further lower-energy X-ray observations to improve the number of sources with reliable lower-energy X-ray counterparts.
For all NuSTAR sources with spectroscopic identifications, we assign an “associated” flag to those that have a velocity offset from the science target smaller than 5% of the total science target velocity, i.e., Δ(cz) < 0.05 cz, following L17. Based on this, 19 spec-z NSS80 sources show evidence for being associated with the primary NuSTAR science target and are, therefore, excluded from any subsequent analysis. Table 8 provides source information for these serendipitous sources and their associated NuSTAR science target, of which 15 are Swift-BAT AGN Spectroscopic Survey (BASS) Data Release 2 sources (DR2; see Koss et al. 2022).
3.3.4. Comparison between Confirmed Spectroscopic and Nway-identified AGNs
A significant fraction of the optical spectroscopic follow-up program was based on the approach outlined in L17 using closest counterparts for lower-energy X-ray sources and/or counterparts with AGN-like MIR properties from WISE. Here we investigate how the optical counterpart identified from that approach compares to that found using the Nway approach described in Section 3.2. We note that a disagreement between the counterparts does not necessarily mean that the incorrect counterpart was followed up; due to the probabilistic approach of Nway, the “best” selected counterpart will not always be the true one (see discussion of false probabilities in Section 3.2). For example, the clear identification of AGN signatures in the optical spectrum provides compelling evidence that the correct optical source was followed up, given the low probability of selecting a clear optical AGN by chance. Therefore, to provide easy access to the IR/optical counterpart information (i.e., magnitudes), we include binary flags in the catalog (“NWAY_CatWISE,” “NWAY_PS1”) indicating whether the spectroscopic target position matches to the Nway-identified CatWISE20 and PS1-DR2 counterparts. In total, 515/594 unique spectroscopic targets (Section 3.3.3) coincide with the CatWISE20 positions, and 388/594 with the Nway-identified PS1-DR2 positions.
To assist in the interpretation of our results in Section 4, we classify the spectroscopically classified sources as either reliable or uncertain (see “Cpart_RFlag” in Appendix A). The majority of the reliable sources will have positional offsets of < 5″, mostly assisted by the identification of lower-energy X-ray counterparts, while the majority of the uncertain sources will have larger positional offsets (see Appendix D). However, as our previous analysis was limited to using cataloged data it will not take into account potential anomalies such as the presence of nearby bright sources, close-separation systems, and image artifacts. We therefore supplemented our analyses with a visual inspection of all spectroscopically targeted NSS80 sources using the detailed optical finding charts; see Appendix E.1 for the post-NSS40 finding charts (and optical spectra) and Appendix E.2 for the NSS40 finding charts. 70
Overall, on the basis of the combination of these analyses, we determined 91% (449/492) of the spectroscopically classified extragalactic sources to be reliable (274 BLs + 166 NLs); only 13/449 sources fail our high-probability cut defined in Section 3.2, mostly due to the lack of lower-energy X-ray or MIR information. The remaining 43 sources are flagged as uncertain (13 of which do not have any Nway matches satisfying our high-probability cut), either due to source confusion as a result of high source density, multiple potential counterpart associations, or shallow IR/optical coverage. Of the 58 spectroscopically classified Galactic objects, we identify 30 as reliable spectroscopic counterparts (28 of which satisfy the Nway high-probability cut) and flagged the other 28 as uncertain. We note that counterpart identification is more challenging in these cases (see, e.g., Tomsick et al. 2018). We use this reliable spectroscopic sample for our science analysis in Section 4, unless otherwise indicated.
In Figure 21, we show r-band magnitude distributions for the reliable optical NSS80 sources (i.e., those satisfying our Nway high-probability cut; light purple), overlaid with the NSS80 sources with reliable spectroscopic classifications (purple). Of the 958 high-probability counterparts, 721 sources have available constrained r-band magnitudes with a mean magnitude of 〈rNway〉 = 19.73. Of the 492 extragalactic NSS80 sources, 399 are flagged as reliable (based on our visual comparison between the Nway identified counterpart and the spectroscopic target) and have available constrained r-band magnitudes (excluding 19 sources with evidence for being associated with the NuSTAR targets for their respective observations): 261 BLs, 132 NLs, and six other sources (four galaxies and two unclassified), with average magnitudes of 〈rBL〉 = 19.53, 〈rNL〉 = 19.3, and 〈rOther〉 = 16.58, respectively. Overall, our spectroscopic campaign is targetting the majority of the sources (in terms of r-band magnitude) but misses the faintest sources.
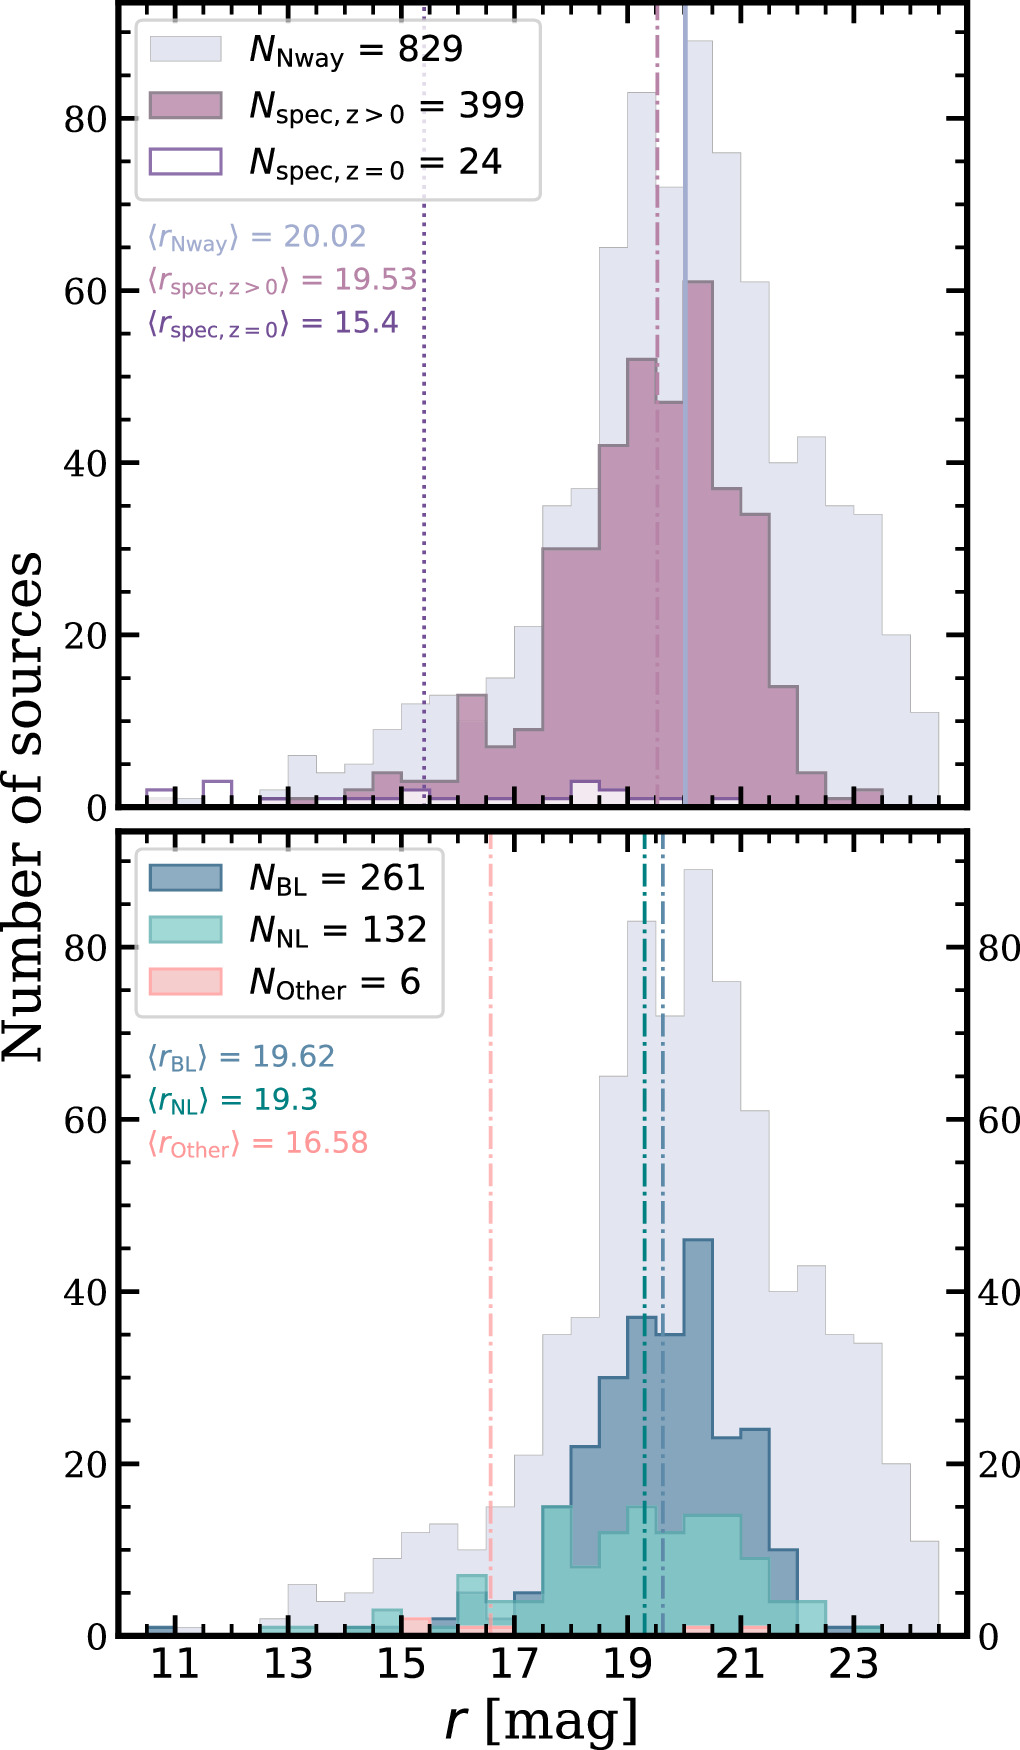
Figure 21. Top panel: r-band magnitude distributions for the high-probability NSS80 sources (i.e., adopted optical counterparts satisfying our Nway probability cut) with constrained r magnitudes (721/953; light purple), overlaid with the constrained r-band magnitude distribution of the spectroscopically classified extragalactic (399/492) and Galactic (24/58) NSS80 sources with reliable counterpart associations shown in filled purple and white, purple-edged histograms, respectively. The 19 sources with evidence for being associated with the NuSTAR science targets for their respective observations are excluded. Bottom panel: the r-band magnitude distribution separated by spectroscopic classification: BL objects are shown in blue, NL objects are shown in green, and “Other” (including four galaxies and two unclassified sources) are shown in peach. The vertical lines mark the median r magnitude for the respective subsamples. Overall, the current spectroscopic completeness for the primary NSS80 catalog is 43% (550/1274), missing the faintest sources; this improves to 52% (508/981) for sources at high Galactic latitudes, ∣b∣ > 10°.
Download figure:
Standard image High-resolution image4. Results and Discussion
In this section, we exploit the X-ray data, multiwavelength data, and optical spectroscopy to characterize the properties of the NSS80 sources. The basic X-ray properties of the extragalactic NSS80 sources (see selection in Table 4) are given in Section 4.1, while in Section 4.2 we explore the MIR colors of these sources. In Section 4.3, we investigate the optical properties of the NSS80 AGNs, with particular focus on quasars, utilizing detailed composite spectra to explore the origin of their observed optical colors.
4.1. X-Ray Characteristics of the NSS80 Sources
4.1.1. NuSTAR Source Counts, Count Rates, and Fluxes
Altogether, there are 1274 NSS80 sources with significant detections in at least one NuSTAR energy band—a factor of 3 improvement over that of NSS40 reported in L17. Similarly to other NuSTAR surveys (e.g., Civano et al. 2015; Mullaney et al. 2015; Lansbury et al. 2017b; Masini et al. 2020), 32% (412/1274) of the sample is detected in the 8–24 keV band, which is unique to NuSTAR among focusing X-ray observatories.
The basic properties of the NSS80 sources are given in Table 9. We find a large range (∼6–1700 ks) in the net exposure time per source for the combined telescopes FPMA+B (cleaned and vignetting corrected; tnet), with a median of ∼80 ks. For the sources with detections in the 3−8 keV, 8−24 keV, and 3−24 keV bands the lowest (deblended) net source counts (Snet) are 12, 11, and 19, respectively. The source with the highest Snet in all three energy bands is still NuSTAR J043727–4711.5, a BL AGN at z = 0.051, as reported in L17, with Snet values of 11,337, 6653, and 17,943 counts, respectively. The median Snet values in the respective bands are 62, 67, and 82, respectively. Finally, we find a range in the net count rates of 0.09–37.1, 0.07–44.3, and 0.12–72.2 ks−1, and median values of 0.8, 0.8, and 1.04 ks−1 for the soft-, hard-, and full-band energies, respectively.
Table 9. X-Ray Characteristics of the NSS80 Sources with Significant Detections in the Soft (3−8 keV), Hard (8−24 keV), and Full (3−24 keV) Bands, Respectively
| NuSTAR Energy Band |

|

| 〈tnet〉 |
|---|---|---|---|
| (ks) | (ks) | (ks) | |
| 3−8 keV | 7.6 | 1657.4 | 79.8 |
| 8−24 keV | 6.1 | 1617.9 | 76.4 |
| 3−24 keV | 8.9 | 1656.4 | 78.3 |
 (counts) (counts) |
 (counts) (counts) | 〈Snet〉 (counts) | |
| 3−8 keV | 12 ± 7 | 11,337 ± 114 | 62 ± 45 |
| 8−24 keV | 11 ± 5 | 6653 ± 88 | 67 ± 48 |
| 3−24 keV | 19 ± 29 | 17,943 ± 143 | 82 ± 55 |
CTRT (ks−1) (ks−1) | CTRT (ks−1) (ks−1) | 〈CTRTnet〉 (ks−1) | |
| 3−8 keV | 0.09 ± 0.04 | 37.1 ± 0.4 | 0.8 ± 0.5 |
| 8−24 keV | 0.07 ± 0.03 | 44.3 ± 1.3 | 0.8 ± 0.6 |
| 3−24 keV | 0.12 ± 0.05 | 72.2 ± 1.6 | 1.04 ± 0.7 |
Flux (erg s−1 cm−2) (erg s−1 cm−2) | Flux (erg s−1 cm−2) (erg s−1 cm−2) | 〈FluxX〉 (erg s−1 cm−2) | |
| 3−8 keV | (6.65 ± 2.68)× 10−15 | (2.49 ± 0.025)× 10−12 | (5.18 ± 3.56)× 10−14 |
| 8−24 keV | (9.93 ± 4.07)× 10−15 | (6.15 ± 0.17)× 10−12 | (11.31 ± 7.86)× 10−14 |
| 3−24 keV | (11.55 ± 4.43)× 10−15 | (6.79 ± 0.15)× 10−12 | (9.82 ± 6.83)× 10−14 |
Notes. The listed data include the minimum, maximum, and median values for the net exposure times (tnet; in kiloseconds), the net source counts (Snet counts), the net count rates (CTRTnet; ks−1), and the X-ray fluxes. The median absolute deviation (MAD) is taken as the uncertainty on the median values.
Download table as: ASCIITypeset image
The flux distributions of detected and undetected NSS80 sources for a given band are shown in Figure 22 in comparison to the NSS40 flux distributions. The faintest fluxes are 6.65 and 9.93 × 10⁻¹⁵ erg s−1 cm−2 for detected sources in the 3−8 keV and 8−24 keV bands, respectively, and 1.15 × 10⁻¹⁴erg s−1 cm−2 for full-band source detections. The brightest fluxes in the NSS80 catalog correspond to two sources: NuSTARJ043727–4711.5, a BL AGN at z = 0.051, with a soft-band flux of 2.49 × 10⁻¹² erg s−1 cm−2, and NuSTARJ153602–5749.0, a Galactic source (z = 0), with hard- and full-band fluxes of 6.15 and 6.79 × 10⁻¹² erg s−1 cm−2, respectively. The source with the brightest flux in L17, NuSTARJ075800+3920.4 (BL AGN at z = 0.095) is recorded in our secondary NSS80 catalog, with soft-, hard-, and full-band fluxes of 3.50, 4.99, and 8.8 × 10⁻¹² erg s−1 cm−2; the median fluxes in the NSS80 catalog are (5.18 ± 3.56), (11.31 ± 7.86), and (9.82 ± 6.83) ×10−14 erg s−1 cm−2, respectively. 71 The serendipitous survey pushes to fluxes ∼2 orders of magnitude fainter than those achieved by previous-generation hard X-ray observatories such as INTEGRAL (e.g., Malizia et al. 2012) and Swift-BAT (Oh et al. 2018); see Section 4.1.3.
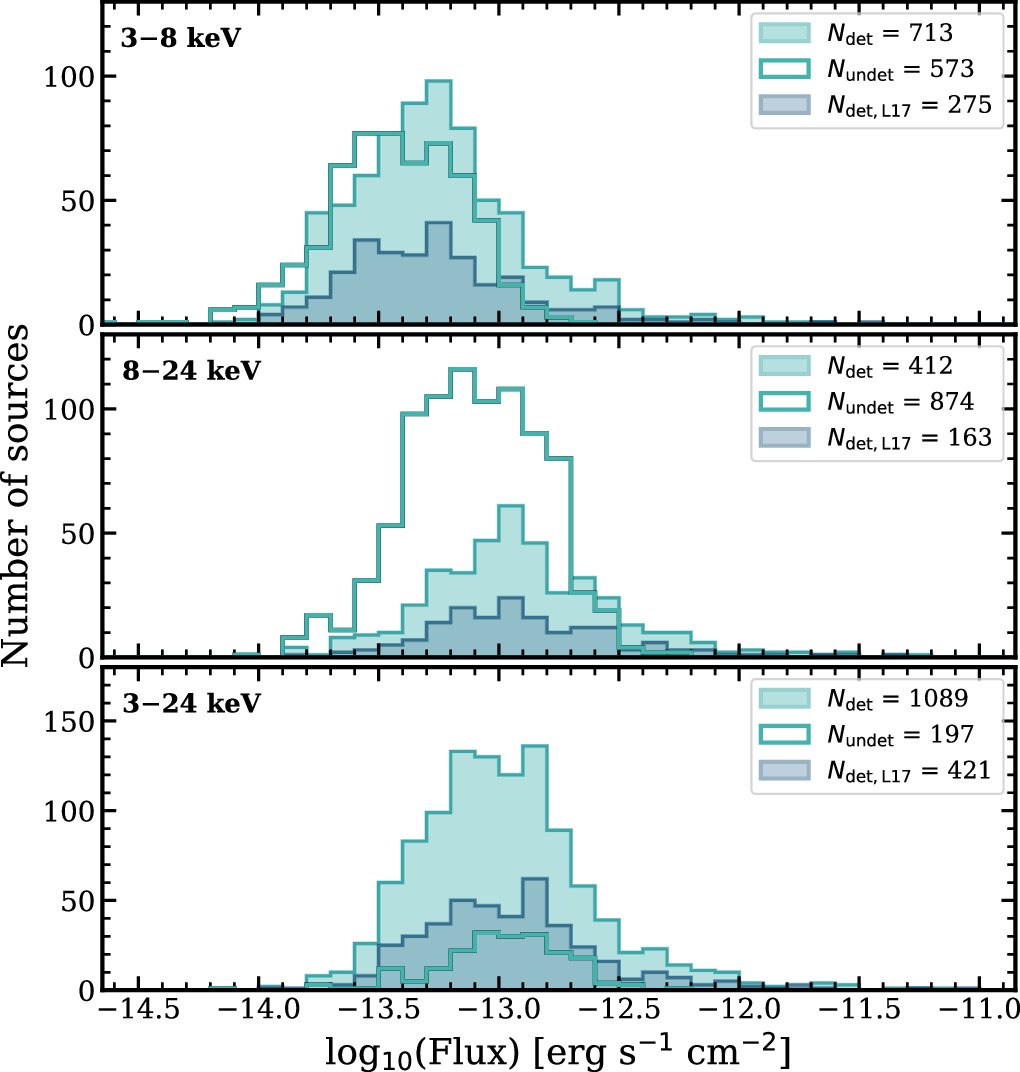
Figure 22. NuSTAR flux distributions in the soft (top), hard (middle), and full (bottom) energy bands for the NSS40 (blue) and NSS80 (green) samples. For each band, the filled histogram shows the flux distribution for sources independently detected in that band (the number of these sources, Ndet, is indicated in the upper-right corner), and the open histogram shows the distribution of flux upper limits for sources undetected in that band, but independently detected in at least one other band (Nundet).
Download figure:
Standard image High-resolution image4.1.2. Band Ratios
In obscured objects, as optical depth increases with decreasing energy, relatively larger numbers of hard X-ray photons are detected in comparison to soft X-rays due to the preferential obscuration of lower-energy X-ray emission due to photoelectric absorption. With its capability of focusing high-energy photons, NuSTAR is well suited to categorize the obscured population of AGNs and to search for heavily obscured sources of up to CT (NH ≳ 1.5 × 1024 cm−2) levels of obscuration (e.g., Marchesi et al. 2018, 2019; Torres-Albà et al. 2021; Zhao et al. 2021a). The ratio in count rates between the hard and soft X-ray bands, defined as the band ratio, is indicative of the amount of intrinsic obscuration along the line of sight to the nucleus of an X-ray emitting source and can, therefore, be used as a basic estimate of the amount of obscuration to (crudely) identify CT sources from their extreme band ratios. This technique has been successfully demonstrated in several previous NuSTAR studies (e.g., Gandhi et al. 2014; Baloković et al. 2014; Lansbury et al. 2017a; Torres-Albà et al. 2021), and we use this definition in this work for consistency with the literature.
Figure 23 shows the 8−24 keV to 3−8 keV band ratios (BRNu) for the NSS80 sample as a function of the 3−24 keV (full-band) count rate (CTRT). 72 In order to examine the results for extragalactic sources only, we remove sources which are spectroscopically confirmed as having z = 0 and exclude sources with Galactic latitudes below ∣b∣ = 10°, for which there is significant contamination to the nonspectroscopically identified sample from Galactic sources. A large variation in BRNu is observed across the sample corresponding to spectral slopes (applying to a single absorbed power-law model with fixed Galactic NH) ranging from Γeff ≈ 3 (at the softest values) to Γeff ≈ −0.5 (at the hardest values). To include weak and nondetections in the NSS80 catalog, we also calculate “stacked” medians in BRNu per count rate (in bins of 1 × 10⁻³ s−1) by summing the net count rates of all NSS40 (blue-edged diamonds) and NSS80 (green-edged circles) sources. The results are consistent with a flat relation in the average band ratio versus count rate, and a constant average effective photon index of Γeff ≈ 1.5, suggesting at least modest amounts of obscuration on average within the sample (compared to Γeff ∼ 1.8 for typical unobscured sources; see, e.g., Ricci et al. 2017). Furthermore, we find no evidence of a relationship between band ratio and count rate in the higher-energy 3–24 keV band, as found by previous studies at <10 keV (e.g., Della Ceca et al. 1999; Mushotzky et al. 2000; Alexander et al. 2003). The absence of such a trend may partly be attributed to the fact that X-ray spectra of AGNs are less strongly affected by absorption in the high-energy NuSTAR band.
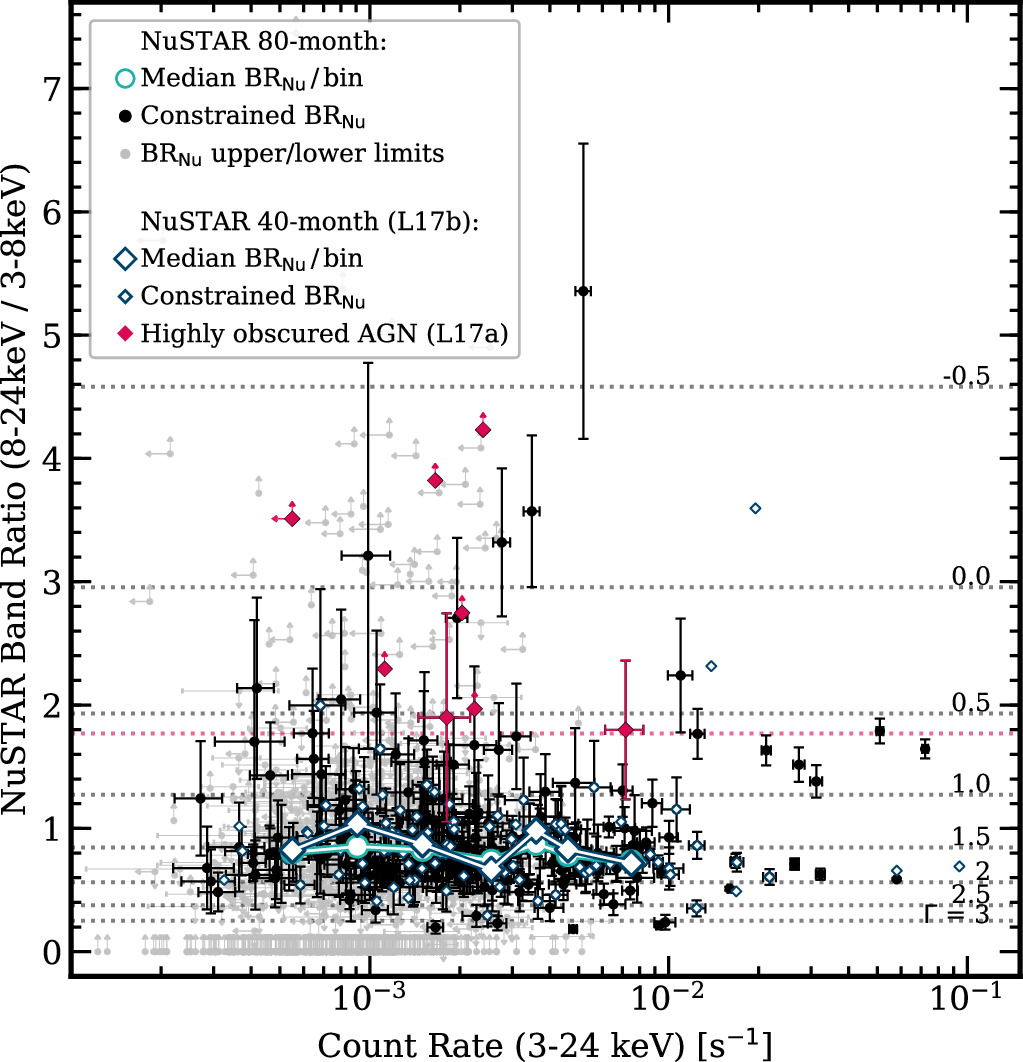
Figure 23. The NuSTAR 8−24 to 3−8 keV band ratio (BRNu) vs. full-band (3−24 keV) count rate for the NSS80 sources. Constrained BRNu values are shown in black, and those with upper or lower limits are shown in gray. The dotted horizontal lines indicate the equivalent X-ray spectral slope (Γeff) for a given band ratio. Highly obscured NSS40 serendipitous sources (Lansbury et al. 2017a), with BRNu values that correspond to Γeff < 0.7, are marked with red diamonds. The blue diamonds and the green circles show the median BRNu value per count rate bin of size 1 × 10⁻³ s−1 for the NSS40 and NSS80 sources, respectively.
Download figure:
Standard image High-resolution imageWhen using the BRNu alone to identify obscured AGNs, additional knowledge of the source is required to estimate the absorbing column density (NH), as key spectral features (e.g., the photoelectric absorption cutoff) are shifted across the observed energy band for sources at different redshifts. Therefore, potentially highly obscured AGNs can be identified using the BRNu values complemented by the source’s redshift information, as demonstrated in Lansbury et al. (2017a). The BRNu values as a function of redshift are plotted for the spectroscopically identified NSS80 sample in Figure 24. We plot tracks for a range of column densities (NH = 1023−24 cm−2) to provide an estimate of the absorbing columns giving rise to the observed band ratios of the NSS80 sources. We find that the majority of extragalactic NSS80 sources (z > 0) have BRNu values in the range of 0.4–1.4, with a median of 0.8 ± 0.3, which breaks down into a median of 0.7 ± 0.2 for the BLs and a slightly higher value of 0.9 ± 0.2 for the NLs (as illustrated with the blue and green histograms, respectively). In comparison to the column density tracks, the majority of the extragalactic NSS80 serendipitous sources have NH values of <3 × 1023 cm−2, with only a minority (14/82 BL and 13/55 NL constrained sources), predominantly at low redshift, with significantly higher absorbing column densities.
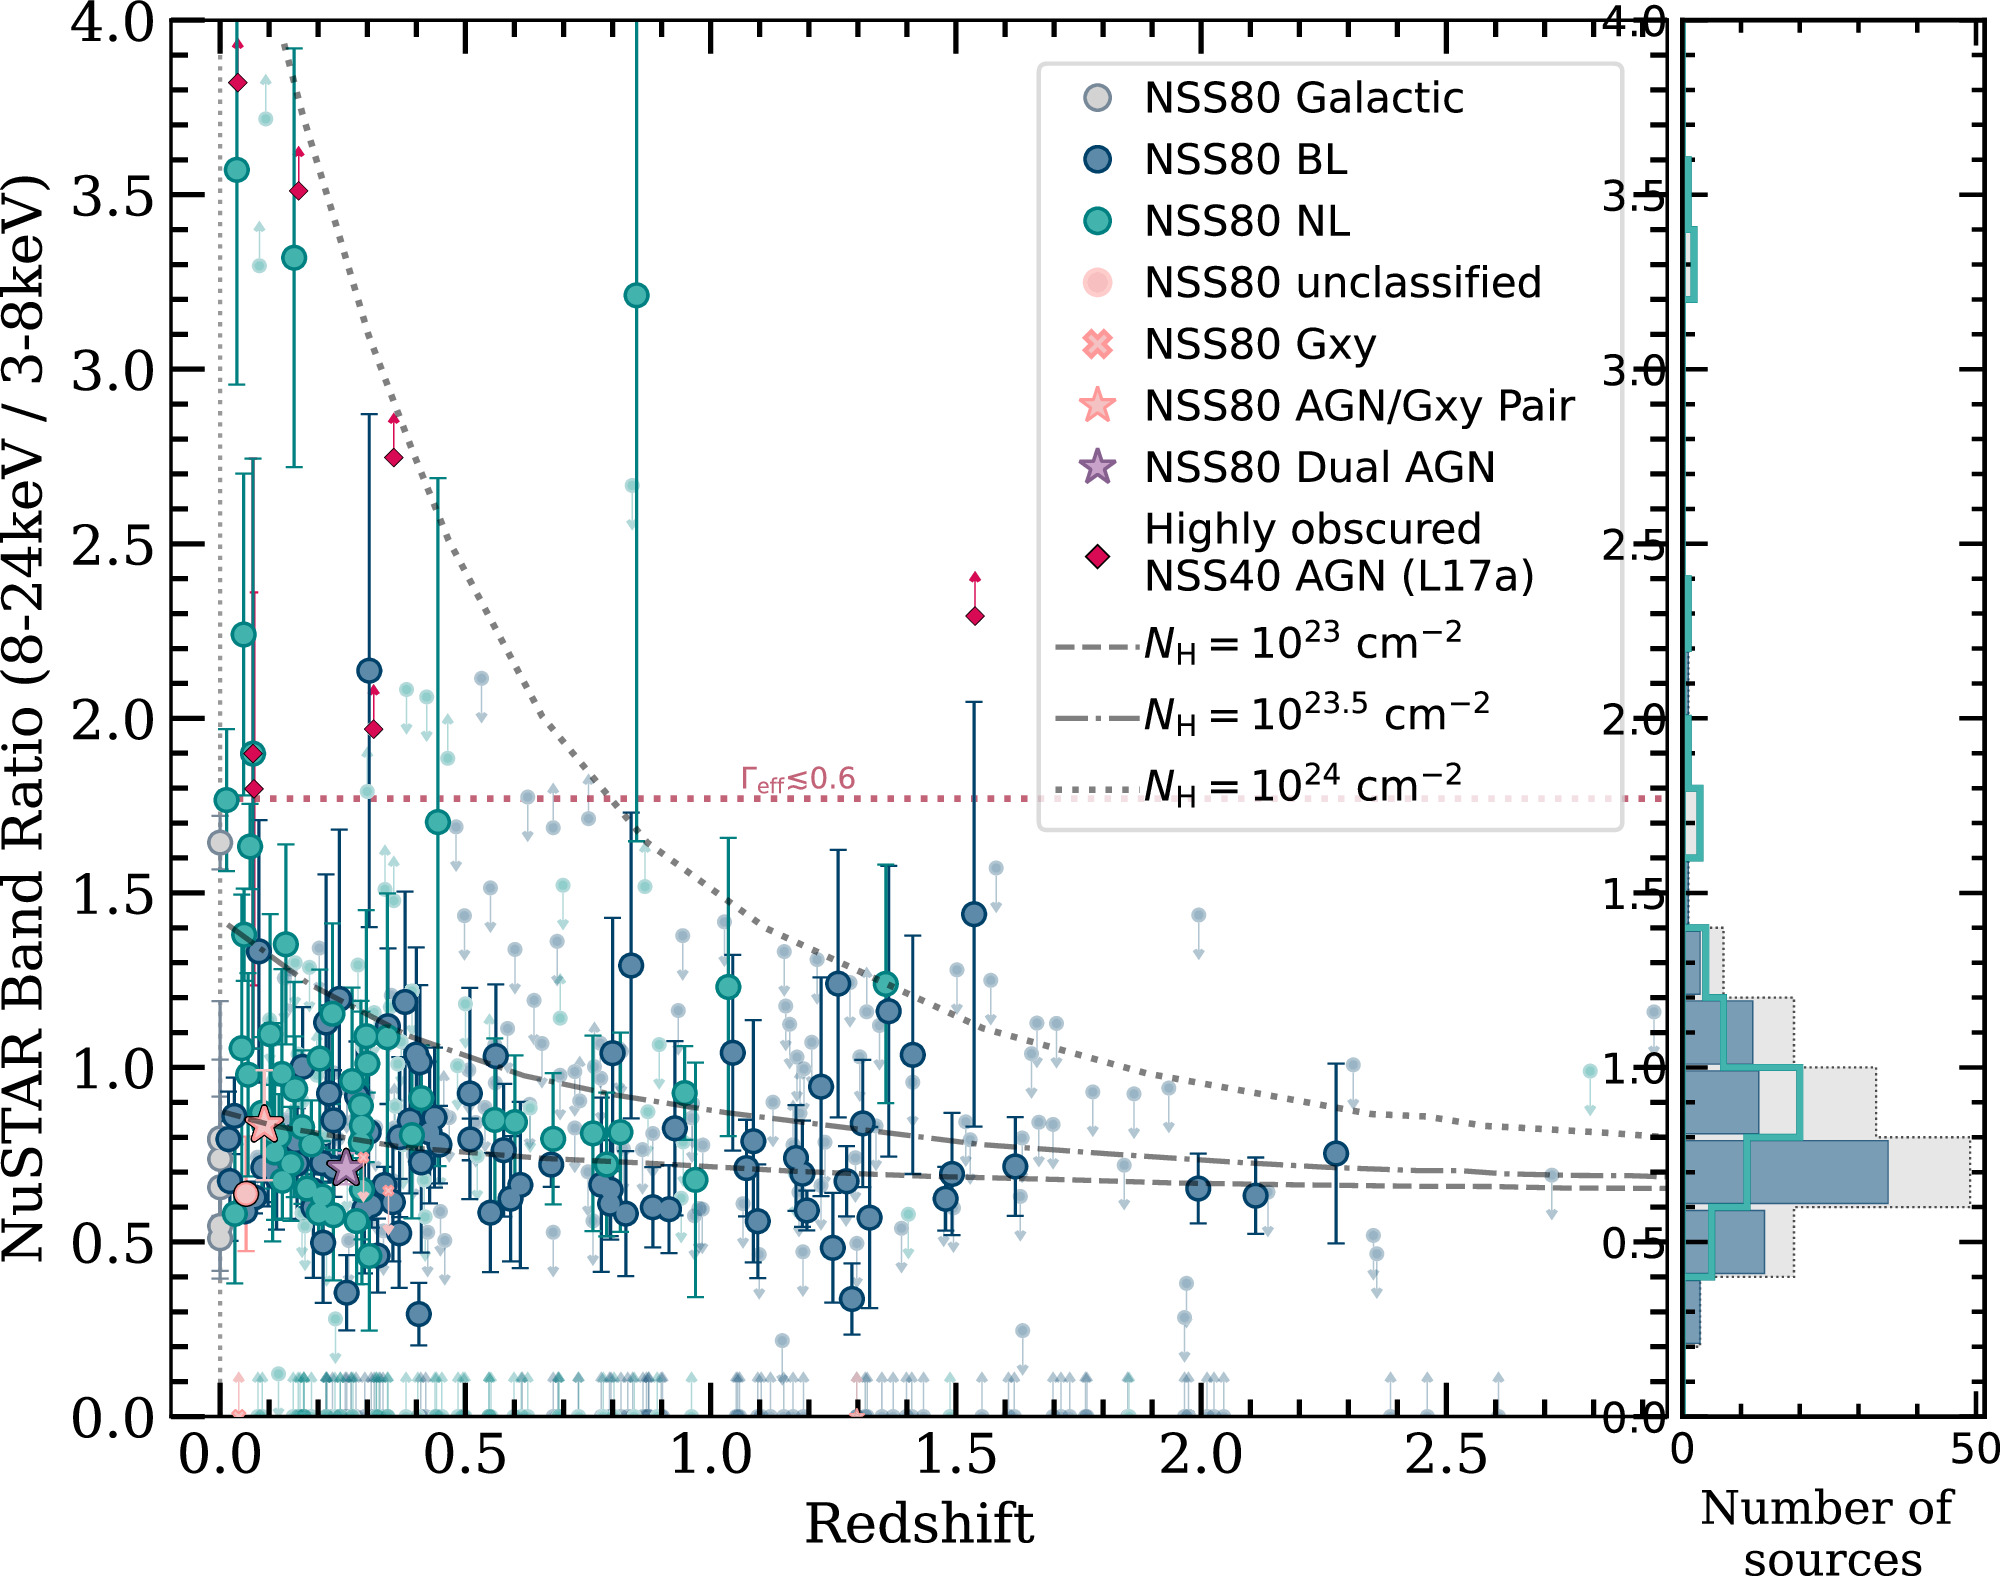
Figure 24. NuSTAR band ratio (BRNu) vs. redshift for the NSS80 sources, color coded by source classification: Galactic sources (z = 0; gray circle), broad emission-line objects (BL; blue circle), narrow emission-line objects (NL; green circle), unclassified sources (peach circle), galaxies (Gxy; peach “×”), AGN–galaxy pairs (peach star), dual AGNs (purple star), and highly obscured AGNs observed in NSS40 (red diamond; Lansbury et al. 2017a). Sources associated with the primary NuSTAR science target are excluded. BRNu values with upper or lower limits are faded using the respective classification colors. The dashed lines show tracks for a simple absorbed power-law model (assuming Γ = 1.8) and Galactic absorption of NH,Gal = 1020 cm−2 for a range of column densities along the line of sight to the nucleus. The distribution of constrained band ratios for the full NSS80 sample is shown on the right in faded gray, overlaid with the distribution of the BL (filled blue) and NL (open green) objects. The median constrained band ratio of the NSS80 sample is ∼0.8.
Download figure:
Standard image High-resolution imageWe apply the same basic approach to that used in Lansbury et al. (2017a) to identify potentially heavily obscured sources, i.e., a BRNu > 1.7 cut (red dotted line in Figure 24), which corresponds to an effective (i.e., observed) photon index of Γeff ≲ 0.6 (motivated by observed CT AGNs in other NuSTAR programs; e.g., Baloković et al. 2014; Gandhi et al. 2014; Civano et al. 2015; Lansbury et al. 2015). The sample is limited to NSS80 sources with spectroscopic redshifts and constrained BRNu values (or lower limits). Based on this analysis, 22 sources stand out as CT candidates: 10 sources detected in all three NuSTAR bands, eight with hard- and full-band detections, and four only detected in the hard band. Of these, seven are reported in Lansbury et al. (2017a), increasing the number of NSS-selected candidate CT AGNs by a factor of ∼3; however, the eighth source in Lansbury et al. (2017a), NuSTAR J165346+3953.7, is undetected in the NSS80 catalog. Note that 3/22 sources show evidence for being associated with the primary NuSTAR science target based on Δ(cz) < 0.05 cz (see Table 8). The basic properties of these candidate CT AGNs are provided in Table 10. The majority (18/22) are spectroscopically classified as NL systems, consistent with expectations for obscured AGNs; the other systems are classified as either low-redshift galaxies or BL AGNs. We note that BRNu provides a crude estimate of the absorbing columns, and a more detailed investigation of the NuSTAR spectra and multiwavelength properties of the 15 newly identified CT candidates is required to strengthen the interpretation of these high-BRNu sources as highly absorbed systems and provide significantly improved constraints on the space density of CT AGNs (see, e.g., Yan et al. 2019). However, based on the X-ray spectral analysis presented in Lansbury et al. (2017a), we expect at least 50% of these candidates to be CT AGNs (i.e., at least four of the eight CT candidates). Importantly, three of these four systems would not have been identified as candidate CT AGNs without NuSTAR data.
Table 10. Candidate Obscured NSS80 AGNs with BRNu > 1.7
| NuSTAR Object Name | Short Name | R.A. | Decl. | Det. | BRNu | zspec | Type | L10−40keV |
|---|---|---|---|---|---|---|---|---|
| (deg) | (deg) | (erg s−1) | ||||||
| (1) | (2) | (3) | (4) | (5) | (6) | (7) | (8) | (9) |
| NuSTARJ010739–1139.1 | J010739 | 16.914801 | −11.65257 | F S H | 2.2 ± 0.5 | 0.048 | NL | 7.99 × 1042 |
| NuSTARJ022951–0856.4 | J022951 | 37.46319 | −8.94133 | F H | > 1.8 | 0.300 | NL | 1.63 × 1043 |
| NuSTARJ035951–3009.9 | J035951 | 59.96408 | −30.16580 | H | > 2.4 | 0.685 | NL | 2.85 × 1044 |
| ⋆NuSTARJ050559–2349.9 | J050559 | 76.49839 | −23.83168 | F H | > 3.8 | 0.036 | NL | 8.97 × 1041 |
| NuSTARJ082303–0502.7 | J082303 | 125.76385 | −5.04649 | F H | > 2.0 | 0.313 | NL | 9.81 × 1043 |
| NuSTARJ094910+0022.9 | J094910 | 147.29356 | 0.38186 | F H | > 3.7 | 0.093 | NL | 1.63 × 1042 |
| NuSTARJ103456+3939.6 | J103456 | 158.73575 | 39.66031 | F S H | 3.3 ± 0.6 | 0.151 | NL | 2.41 × 1043 |
| NuSTARJ115658+5508.2 | J115658 | 179.24379 | 55.13830 | F H | > 3.3 | 0.080 | NL | 7.03 × 1042 |
| NuSTARJ141056–4230.0 | J141056 | 212.73727 | −42.50139 | F S H | 1.9 ± 0.8 | 0.067 | NL | 2.48 × 1042 |
| NuSTARJ144406+2506.3 | J144406 | 221.02819 | 25.10514 | F H | > 2.3 | 1.539 | NL? | 1.05 × 1045 |
| NuSTARJ150225–4208.3 | J150225 | 225.60725 | −42.13960 | F S H | 5.4 ± 1.2 | 0.054 | Gxy | 6.18 × 1042 |
| NuSTARJ150646+0346.2 | J150646 | 226.69512 | 3.77105 | F S H | 3.6 ± 0.6 | 0.034 | NL | 1.37 × 1042 |
| ⋆NuSTARJ151253–8124.3 | J151253 | 228.22496 | −81.40501 | F S H | 1.8 ± 0.6 | 0.069 | NL | 9.26 × 1042 |
| NuSTARJ153445+2331.5 | J153445 | 233.68763 | 23.52592 | H | > 3.5 | 0.160 | NL | 4.82 × 1042 |
| NuSTARJ160817+1221.4 | J160817 | 242.07274 | 12.35752 | H | > 1.9 | 0.181 | NL | 1.34 × 1043 |
| NuSTARJ163126+2357.0 | J163126 | 247.85845 | 23.95061 | F H | > 1.7 | 0.751 | BL | 3.97 × 1044 |
| ⋆NuSTARJ190813–3925.7 | J190813 | 287.05529 | −39.42912 | H | > 3.1 | 0.075 | Gxy | 2.46 × 1042 |
| NuSTARJ194234–1011.9 | J194234 | 295.64177 | −10.19846 | F S H | 3.2 ± 1.6 | 0.849 | NL? | 4.58 × 1044 |
| NuSTARJ214320+4334.8 | J214320 | 325.83368 | 43.58032 | F S H | 1.8 ± 0.2 | 0.013 | NL | 5.86 × 1041 |
| NuSTARJ224225+2942.0 | J224225 | 340.60580 | 29.70105 | F S H | 2.1 ± 0.7 | 0.304 | BL | 1.57 × 1043 |
| NuSTARJ224925–1917.5 | J224925 | 342.35456 | −19.29294 | F S H | 1.7 ± 0.9 | 0.445 | NL | 3.32 × 1043 |
| NuSTARJ231840–4223.0 | J231840 | 349.66942 | −42.38454 | F H | > 1.9 | 0.464 | NL | 9.68 × 1043 |
Notes. The sources are listed in order of increasing R.A. The bold rows mark the extremely hard NSS40 sources reported in Lansbury et al. (2017a). Note that J150646 is now detected in all three bands, while in the 40 month catalog it was only detected in the hard band. Column (1): NuSTAR serendipitous source name. Asterisks indicate sources that show evidence for being associated with the primary NuSTAR science target according to the definition Δ(cz) < 0.05 cz; see Table 8. Column (2): abbreviated NuSTAR source name adopted here. Columns (3) and (4): NuSTAR R.A. and decl. J2000 coordinates in decimal degrees. Column (5): the NuSTAR energy bands for which the source is independently detected. F, S, and H correspond to the full (3−24 keV), soft (3−8 keV), and hard (8−24 keV) bands, respectively. Column (6): NuSTAR photometric band ratio. Column (7): source spectroscopic redshift obtained from emission-line fitting in iraf or by matching the observed flux-calibrated input spectra (FITS file format) against a library of stellar, galaxy, and AGN templates available in the Marz web application; see Section 3.3.3. All redshifts are robust, except for J144406 and J194234, where fewer lines (or low-S/N lines) are identified, and J050559, which has two candidate soft X-ray and WISE counterparts. Column (8): source spectroscopic classification. Column (9): non-absorption-corrected, rest-frame 10−40 keV luminosity.
Download table as: ASCIITypeset image
4.1.3. Redshift–Luminosity Plane
Overall, on the basis of our optical spectroscopic campaign (described in Section 3.3) we have classified 492 NSS80 sources as extragalactic, 449 of which have reliable counterpart identifications and 43 sources with uncertain counterpart associations based on our Nway assessment in Section 3.3.4 (which are indicated with white filled symbols in all figures). We exclude from our analysis the seven additional sources with photometric redshift measurements from the literature and those with reliable counterparts closely associated with the targets of the NuSTAR observations, leaving 433 sources.
The redshift distribution for the 433 extragalactic NSS80 sources with reliable counterpart associations is shown in Figure 25, excluding sources with evidence for being associated with the NuSTAR targets for their respective observations (see Table 8). The redshifts cover a large range, z = 0.012–3.43, with a median of 〈z〉 = 0.56. For the 166 extragalactic objects with independent detections in the high-energy band (8−24 keV), to which NuSTAR is uniquely sensitive, the median redshift is 〈z〉 = 0.34. Roughly comparable numbers of NL and BL objects are identified for z < 1 (132 and 147, respectively) but comparison of redshift distributions shows a significant difference, with a larger fraction of BL sources found at higher redshifts. This is supported by a larger median redshift for BL sources of 〈z〉 = 0.80. This result is not unexpected since BL AGNs at a given redshift are typically brighter in the optical band than NL AGNs of the same intrinsic luminosity (i.e., the BL AGNs are less obscured in the optical); see Figures 21 and 25.
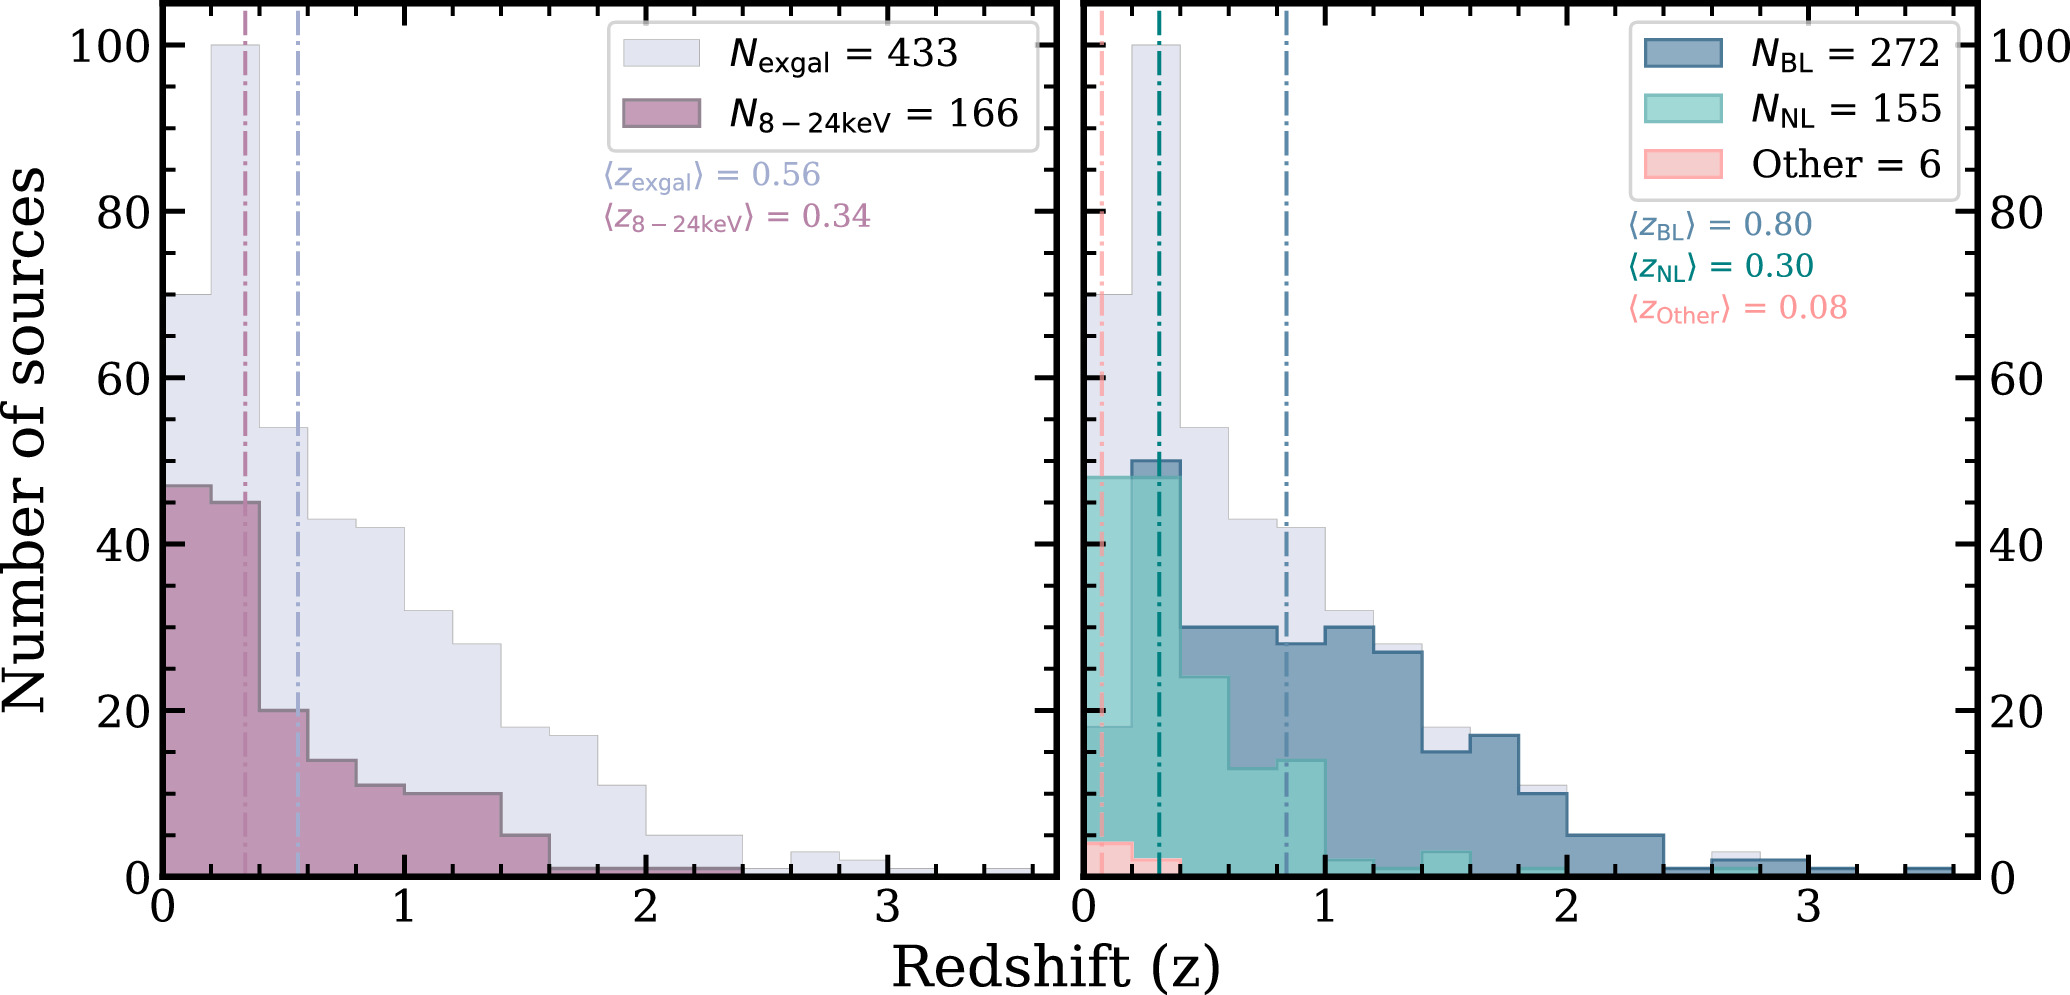
Figure 25. Redshift distribution for the 433 spectroscopically identified extragalactic NSS80 sources with reliable counterpart identifications (light purple), excluding 19 sources with evidence for being associated with the NuSTAR targets for their respective observations. Left panel: the distribution for the subset of NSS80 sources which are independently detected in the hard band (8−24 keV; dark purple). Right panel: the redshift distribution separated by spectroscopic classification: BL objects are shown in blue, NL objects are shown in green, and “Other” (including four galaxies and two unclassified sources) are shown in peach. The vertical lines mark the median redshifts for the respective subsamples.
Download figure:
Standard image High-resolution imageIn Figure 26, we show the redshift–luminosity plane for the rest-frame 10−40 keV band, calculated from the observed-frame NuSTAR fluxes (following the same approach as in L17), assuming an effective photon index of Γeff = 1.8 (typical of AGNs detected by NuSTAR; see Alexander et al. 2013). 73 For comparison, the BASS DR2 (Koss et al. 2022) is plotted with gray crosses. The Swift-BAT 14−150 keV fluxes were used to calculate L10−40 keV values assuming an effective photon index of Γeff = 2.0 for the K-correction factor (using the median slope of 2). As can be seen, the NSS80 sources span the knee of the X-ray luminosity function out to z ≈ 1 (Aird et al. 2015), as opposed to z ≈ 0.1 for the Swift-BAT AGNs.
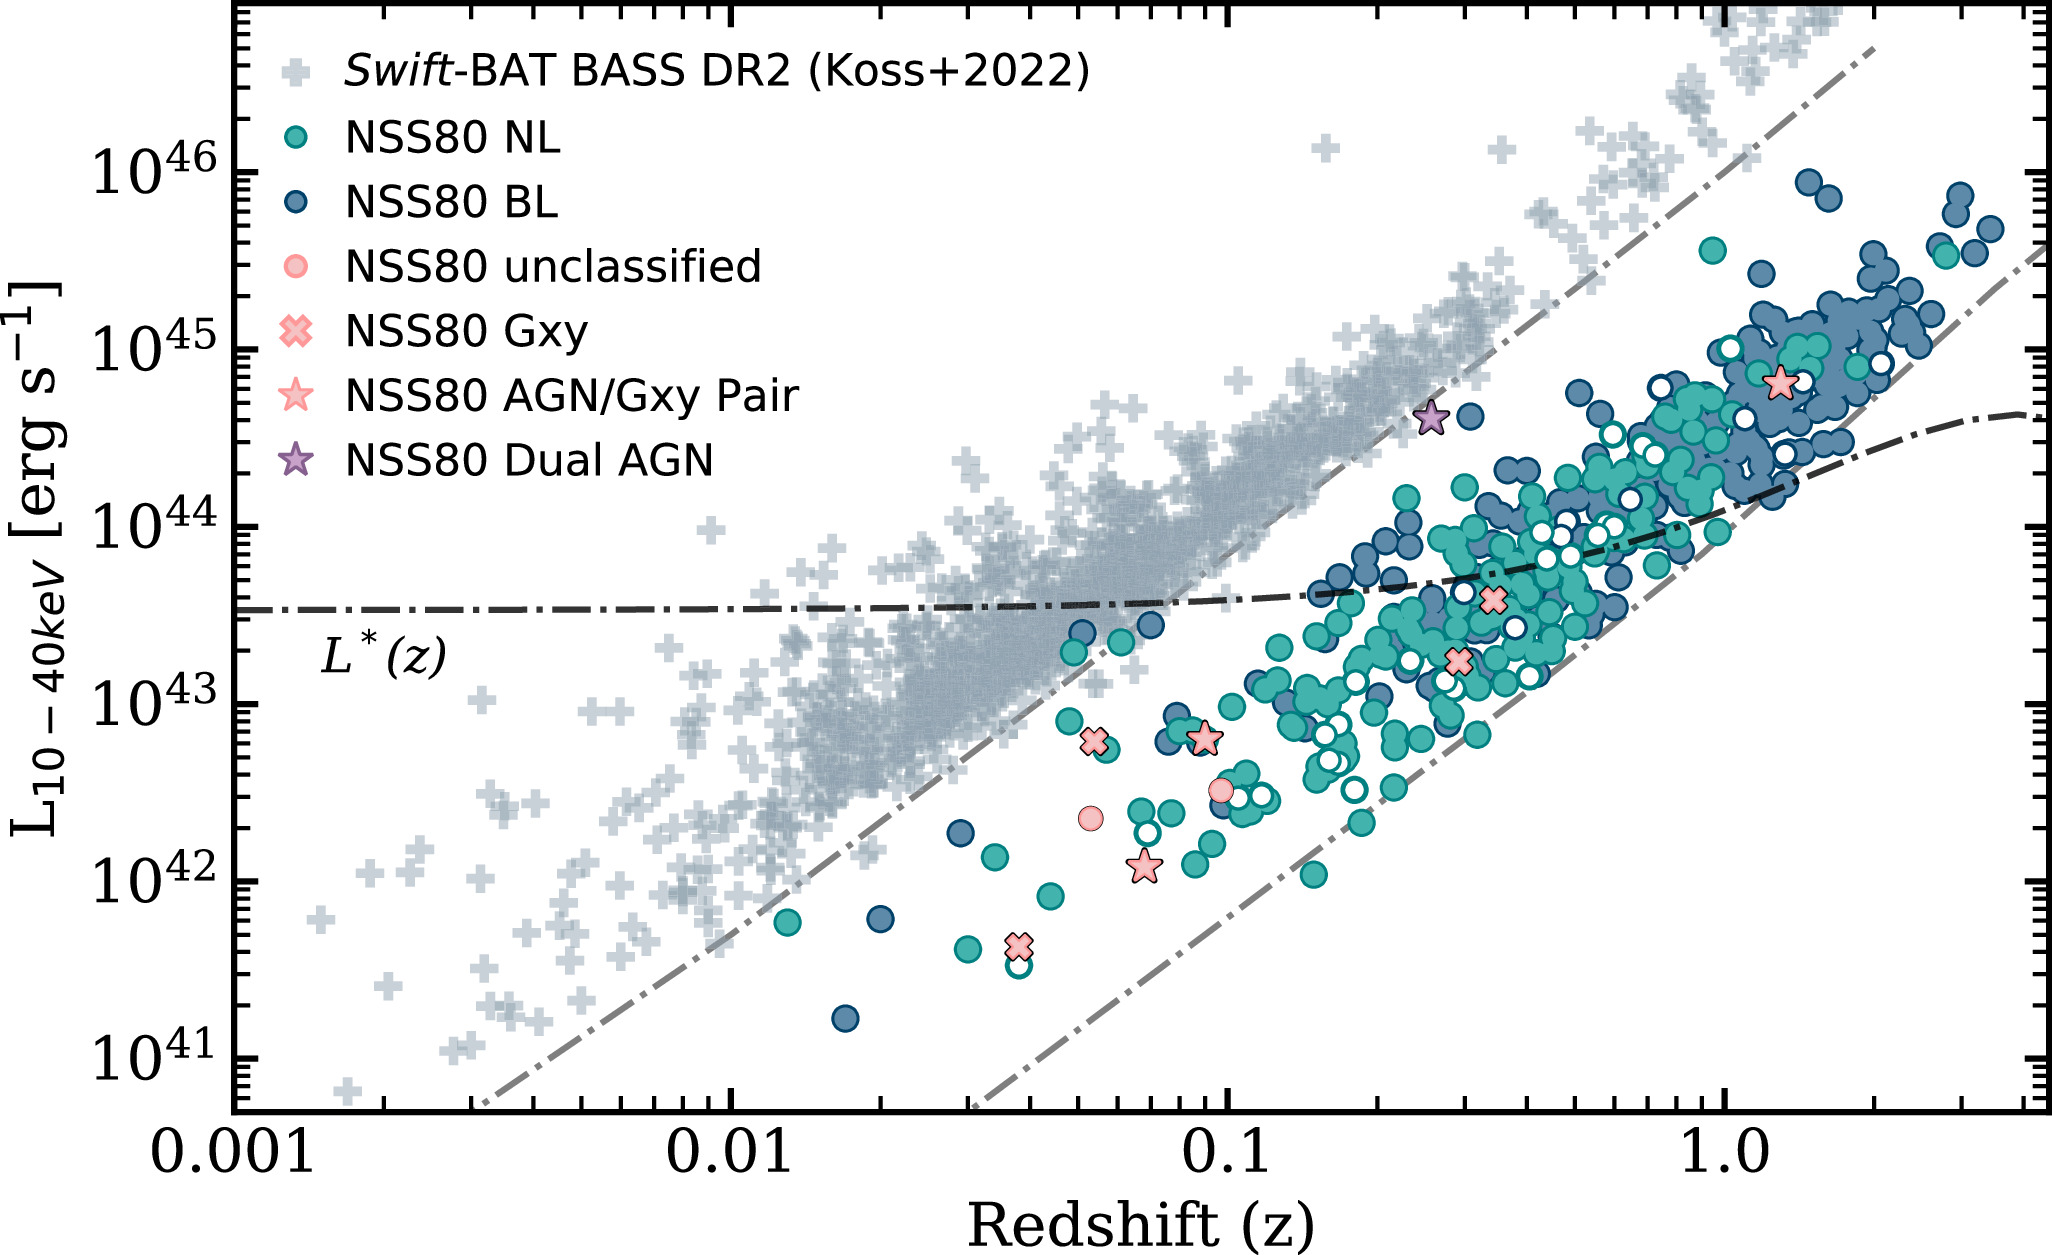
Figure 26. Rest-frame 10−40 keV luminosity (L10−40 keV) vs. redshift for the extragalactic NSS80 sources with reliable counterparts, separated into different spectroscopic classes: broad emission-line objects (BL; blue circle), narrow emission-line objects (NL; green circle), unclassified sources (peach circle), galaxies (Gxy; peach “×”), AGN–galaxy pairs (peach star), dual AGN (purple star), and sources with uncertain counterpart identification (white filled circles with green and blue edges). For comparison, the BASS DR2 (Koss et al. 2022) is plotted with gray crosses. The Swift-BAT 14−150 keV fluxes were used to calculate L10−40 keV values assuming an effective photon index of Γeff = 2.0 for the K-correction factor. The gray dashed–dotted lines indicate an observed-frame X-ray flux range of 0.02–2 × 10⁻¹² erg s−1 cm−2, i.e., spanning 2 orders of magnitude. The black dashed–dotted line highlights the evolution of the knee of the X-ray luminosity function (L*) with redshift (Aird et al. 2015).
Download figure:
Standard image High-resolution imageOf the 433 extragalactic NSS80 sources with reliable counterpart associations, 99% (427/433) are within the luminosity range of L10−40 keV ≈ 1042−1046 erg s−1, with a median luminosity of 1.2 × 1044 erg s−1. These values are consistent with the NSS40 catalog. The faintest source in the L17 sample, however, with L10−40 keV = 1.0 × 1039 erg s−1, is recorded in the secondary NSS80 catalog (see Section 2.3 and Appendix B), since the NL AGN at z = 0.002 is hosted by the galaxy IC750. Hence, the least luminous source in the primary NSS80 catalog is NuSTARJ010736–1732.3 (NL AGN at z = 0.021) with L10−40 keV = 2.6 × 1040 erg s−1. As in L17, the source at the other extreme end in luminosity is NuSTARJ052531–4557.8, a radio-bright BL AGN at z = 1.479 with L10−40 keV = 8.8 × 1045 erg s−1, also classified as a blazar in the literature (e.g., Massaro et al. 2009), which means that the X-ray luminosity may be inflated by beaming effects. The most distant source detected is still the optically unobscured quasar NuSTARJ232728+0849.3, at z = 3.43, reported in the NSS40 catalog.
We also compare to the luminosity–redshift plane of BASS, as shown in Figure 26. The Swift-BAT and NuSTAR serendipitous survey are complementary to one another, with the former providing a statistical sample of AGNs in the nearby Universe (z < 0.1) selected in hard X-rays, and the latter providing its counterpart for the distant Universe. Consequently, there is little overlap between the two surveys, which sample different regions of the Lx – z parameter space, with the exception of four NuSTAR sources outlying in Figure 26 which have very high fluxes at the detection threshold of Swift-BAT (all BASS detected):
- 1.NuSTARJ043727–4711.5: a BL AGN at z = 0.051; L10−40 keV = 2.5 × 1043 erg s−1.
- 2.NuSTARJ091912+5527.8: an NL AGN at z = 0.049; L10−40 keV = 2.0 × 1043 erg s−1.
- 3.NuSTARJ103135–4206.0: an NL AGN at z = 0.061; L10−40 keV = 2.2 × 1043 erg s−1.
- 4.NuSTARJ180958–4552.6: a (beamed) BL AGN at z = 0.07; L10−40 keV = 2.8 × 1043 erg s−1.
Overall, the NuSTAR serendipitous survey provides the higher-redshift component of Swift-BAT and fills out the broadest range of luminosities and redshifts in comparison to other NuSTAR surveys, e.g., the NuSTAR-ECDFS survey (Mullaney et al. 2015), NuSTAR-COSMOS survey (Civano et al. 2015), and NuSTAR-UDS (Masini et al. 2018).
In the following sections, we further explore the optical and MIR properties of the extragalactic NSS80 sources.
4.2. MIR Properties of the 80 AGNs
The MIR emission from AGNs is typically due to the reprocessing of accretion-disk radiation by circumnuclear dust, and suffers little extinction relative to other wavelengths (e.g., Nishiyama et al. 2008; Netzer 2015; Hickox & Alexander 2018); however, a nonnegligible fraction can also be produced by star formation in the host galaxy (e.g., Stern et al. 2005; Hickox & Alexander 2018). Color selections using the WISE telescope bands (3.4, 4.6, 12, and 22 μm; e.g., Assef et al. 2010; Jarrett et al. 2011; Stern et al. 2012; Mateos et al. 2012, 2013; Assef et al. 2013) can separate bright AGNs from host-galaxy light (from stars and the interstellar medium) through the identification of a red MIR spectral slope, and have thus become widely applied. These selections have the potential to identify large samples of AGNs with less bias against heavily obscured systems. However, their effectiveness worsens toward lower AGN luminosities, where the AGN component of the MIR spectrum can be swamped by the emission from the host galaxy. For example, Cardamone et al. (2008) and LaMassa et al. (2019) found that most X-ray-selected AGNs in the (deep) GOODS field and Stripe 82X, respectively, would not have been found by standard MIR color selection. Lyu et al. (2022) show similar results for spectral-energy-distribution (SED)-selected AGNs in the GOODS-S/HUDF region. Notably, the MIR host emission contribution increases with redshift due to the increase in cosmic star formation rate density, too, thus it is progressively harder to select AGNs at the same luminosity at higher redshifts. By comparison, NuSTAR selects AGNs almost irrespective of the relative strength of the AGN to the host galaxy since the X-ray emission from galaxy processes is weak in comparison to the AGN, particularly at the 3−24 keV energies probed by NuSTAR. Here we investigate the MIR properties of our NSS80 sources, and consider the results with respect to the AGN selection criteria.
As CatWISE20 contains only W1 and W2 photometry, for the purposes of examining the further properties of the sample we match all sources with an Nway CatWISE20 counterpart to their nearest AllWISE (Wright et al. 2010; Mainzer et al. 2011) source within a maximum radius of 4
74
This results in 865 matches, including 312/523 upper limits for W3/W4, respectively. W1 and W2 magnitudes are roughly consistent between CatWISE20 and AllWISE values except in a small minority of sources, implying that the W3 and W4 can be used for comparison with the caveat that there may be additional uncertainty due to the different photometric pipelines. In Figure 27, we plot the WISE colors (W1 − W2 versus W2 − W3) of the spectroscopically confirmed extragalactic NSS80 sample with reliable counterpart associations and W3 detections, i.e., well-defined WISE colors (see Section 3.2), and compare to the selection “wedge” defined by Mateos et al. (2012) to identify AGNs with red MIR power-law SEDs. In this comparison, we further limit our analysis to the sources with significant detections in all three of the relevant, shorter-wavelength WISE bands (W1, W2, and W3; centered at 3.4 μm, 4.6 μm, and 12 μm, respectively). Considering sources with optical spectroscopic classifications, the fractions for the overall BL AGN (top panel) and NL AGN (bottom panel) samples are
 = 80% (148/185) and
  = 42% (36/86), respectively. Therefore, NL AGNs are less likely to be identified as AGNs based on MIR colors alone. If we use the “X-ray quasar” threshold of 1044 erg s−1 in the 10−40 keV band to distinguish between faint and luminous X-ray BLs/NLs, we find that this is largely driven by the lower-luminosity objects with LX below the X-ray quasar threshold: only 35% (23/66) low LX lie inside the wedge, while 80% (16/20) of the high-LX NL AGNs have AGN-like MIR colors.
75
On the other hand, the bulk of the BL AGNs with LX > 1044 erg s−1 lie within the wedge (95%; 117/123 high LX). Of the LX < 1044 erg s−1 BL AGNs, 65% (40/62) have AGN-like MIR colors.
= 42% (36/86), respectively. Therefore, NL AGNs are less likely to be identified as AGNs based on MIR colors alone. If we use the “X-ray quasar” threshold of 1044 erg s−1 in the 10−40 keV band to distinguish between faint and luminous X-ray BLs/NLs, we find that this is largely driven by the lower-luminosity objects with LX below the X-ray quasar threshold: only 35% (23/66) low LX lie inside the wedge, while 80% (16/20) of the high-LX NL AGNs have AGN-like MIR colors.
75
On the other hand, the bulk of the BL AGNs with LX > 1044 erg s−1 lie within the wedge (95%; 117/123 high LX). Of the LX < 1044 erg s−1 BL AGNs, 65% (40/62) have AGN-like MIR colors.
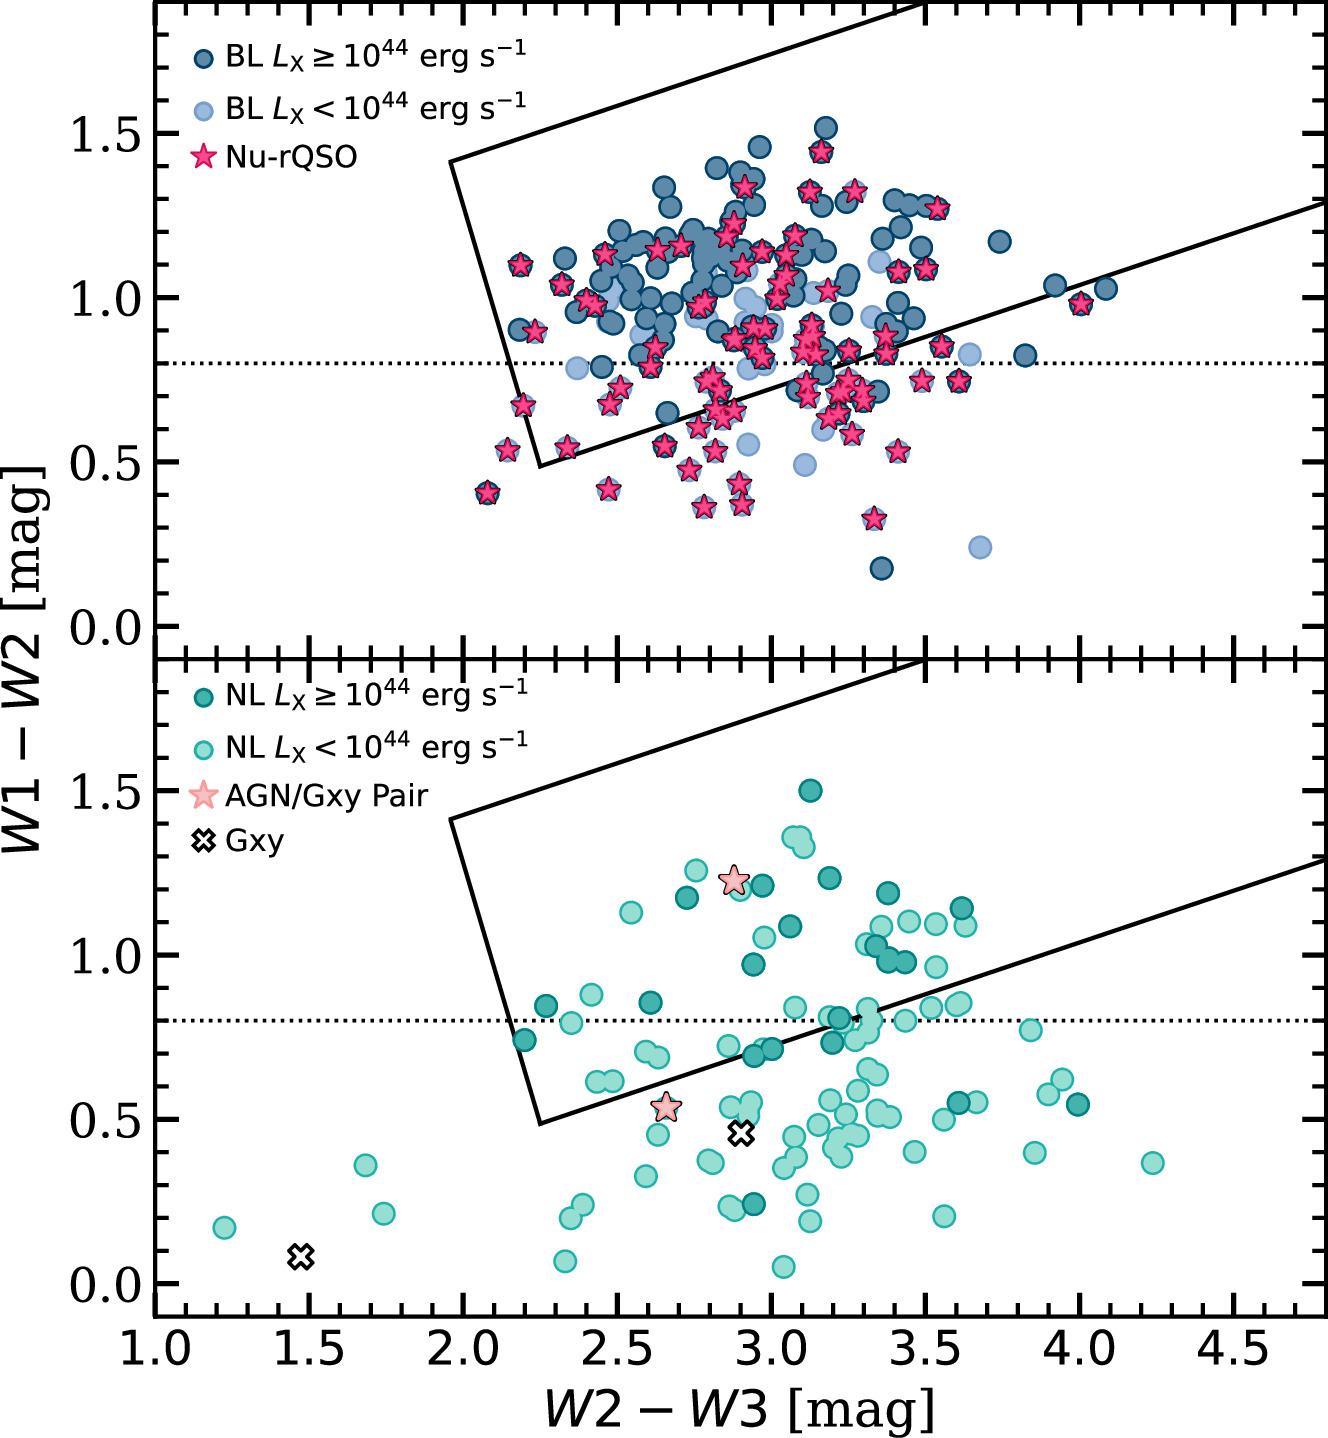
Figure 27. WISE color–color diagram for the extragalactic NSS80 sources color coded by X-ray luminosity and spectroscopic classification following the color scheme in Figure 29: BL objects (blue circle), NL objects (green circle), and AGN–galaxy pairs (peach star). BL and NL sources with L10−40 keV ≥ 1044 erg s−1 are indicated with dark blue and green circles, while the light blue and green circles codify the lower-luminosity BLs and NLs with L10−40 keV < 1044 erg s−1. The Mateos et al. (2012) wedge, which identifies AGNs with red MIR power-law SEDs with a spectral index α ≤ −0.3, is indicated with a solid black line. We also compare with the AGN color cut of Stern et al. (2012, W1 − W2 > 0.8; black dotted line). In the top panel we show the WISE colors of the BL AGNs subdivided into low (light blue) and high (dark blue) L10−40 keV. Our identified Nu-rQSOs (i.e., red BL AGNs) based on their g − i color are plotted with red stars; see Section 4.3 and Figure 29. The bottom panel shows the WISE colors for the NuSTAR NLs separated into L10−40 keV < 1044 erg s−1 (light green) and L10−40 keV ≥ 1044 erg s−1 (dark green). Two AGN–galaxy pairs are plotted with peach stars and two galaxies with white crosses.
Download figure:
Standard image High-resolution imageIf we subdivide the BL AGN sample on the basis of their g − i optical color (selecting the reddest 10%, as in Klindt et al. 2019; see Section 4.3 and Figure 29), we find a lower fraction of red BL AGNs (Nu-rQSOs) lie within the wedge than found for the control BL AGNs (Nu-cQSOs): 67% (49/73) versus 98% (101/103). Of the 49 Nu-rQSOs with AGN-like MIR colors, 33 sources have LX > 1044 erg s−1 (85% of the overall high-LX Nu-rQSOs) and the remaining 16 have LX values below the X-ray quasar threshold (47% of the overall low-LX Nu-rQSOs). Hence, we can deduce from the MIR colors that the majority of Nu-rQSOs (especially at low LX) are more host-galaxy dominated than the Nu-cQSOs. This is broadly consistent with our finding on the basis of optical analyses in the following section.
4.3. Optical Photometric and Spectroscopic Properties
Optical selection of quasars, using for example SDSS photometry, will miss the most reddened quasars due to their colors overlapping the stellar loci in most SDSS color–color diagrams, and a comparatively shallow optical survey flux limit (e.g., Richards et al. 2003). However, since X-rays penetrate circumnuclear obscuration with minimal contribution from the host galaxy, they provide the potential to construct a more complete census of the full quasar population, ranging from heavily obscured sources (e.g., extremely red quasars, ERQs; Goulding et al. 2018), thinly veiled red quasars (e.g., rQSOs; Klindt et al. 2019, hereafter K19), and host-galaxy-dominated systems. Here we focus on the optical photometric and spectroscopic properties of the NSS80 sources subdivided on the basis of X-ray luminosity and optical spectroscopic classification.
The NSS80 is the largest-area NuSTAR survey and picks up the most X-ray-luminous AGNs over ∼36 deg2. However, the NSS80 region is a factor ∼300× smaller than the SDSS and consequently will miss the most luminous systems. To place the NSS80 survey into context, and to further motivate our following analyses that make use of SDSS Data Release 7 (DR7) quasars, in Figure 28 we compare the bolometric luminosity–redshift plane of both surveys. For the NSS80 sources, we calculate bolometric luminosities from the rest-frame 10−40 keV luminosity, assuming that the 10−40 keV luminosity makes up 4% of the total luminosity (see, e.g., Lansbury et al. 2017a). The SDSS bolometric luminosities are available in Shen et al. (2011); however, they are inferred from rest-frame UV-optical continuum measurements and have not been corrected for dust extinction. Consequently, the Lbol values are likely to be significantly underestimated in the SDSS rQSOs (which makes up 10% or more of typical quasar samples; see, e.g., Richards et al. 2003). Overall, there is good overlap between NSS80 and SDSS at the lower-luminosity end, although, as expected, NSS80 misses the most luminous systems. The median Lbol for the extragalactic NSS80 sample is 7.62 × 1044 erg s−1 at the median redshift of the NLs (〈zNL〉 = 0.30), and 5.93 × 1045 erg s−1 at the BL median redshift (〈zBL〉 = 0.80). By comparison, the SDSS sample has median bolometric luminosities of 1.73 × 1045 erg s−1 (0.38 dex higher) and 1.07 × 1046 erg s−1 (0.26 dex higher) at redshifts equal to 〈zNL〉 and 〈zBL〉, respectively.
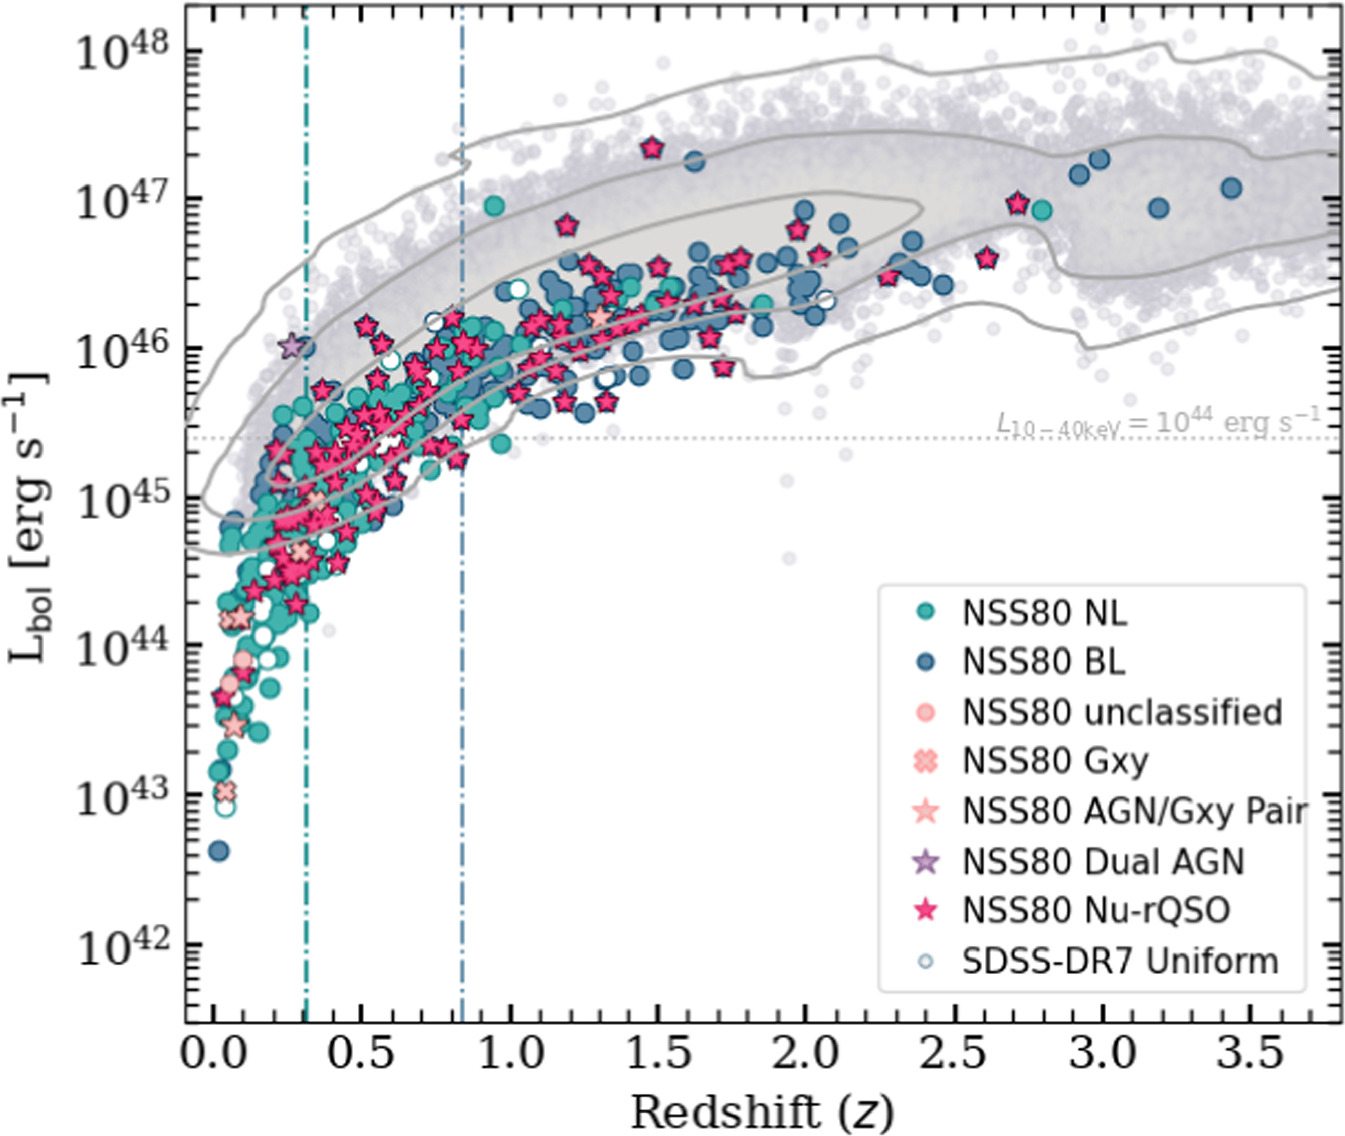
Figure 28. The bolometric luminosity–redshift plane for the (spectroscopically reliable) extragalactic NSS80 sources compared to SDSS optical quasars. The bolometric luminosity (Lbol) for the NSS80 sources is inferred from the rest-frame 10–40 keV luminosity using a bolometric correction of BC = 25 (assuming that L10−40 keV makes up ∼4% of Lbol). Following the color scheme in Figure 29, the following subsamples are plotted: BL objects (blue circle), NL objects (green circle), unclassified sources (peach circle), galaxies (Gxy; peach “×”), AGN–galaxy pairs (peach star), dual AGN (purple star), and sources with uncertain counterpart identification (white filled circles with green and blue edges). The g − i-selected rQSOs (see Figure 29) are highlighted with red stars and the SDSS DR7 quasars are plotted using shaded gray circles. Compared to the optically selected SDSS quasars, the X-ray-selected NuSTAR serendipitous sources are typically ∼0.3 dex less luminous. The gray dotted line indicates the X-ray quasar threshold of L10−40 keV = 1044 erg s−1. The median Lbol for the extragalactic NSS80 sample is 7.19 × 1044 erg s−1 at the median redshift of the NLs (〈zNL〉 = 0.3), and 5.94 × 1045 erg s−1 at the BL median redshift (〈zBL〉 = 0.82), as indicated with green and blue dashed–dotted lines, respectively. Gray lines show kernel density estimation contours of the SDSS DR7 quasars at 68%, 95%, and 99.7%, for comparison with the distribution of NSS80 sources.
Download figure:
Standard image High-resolution imageTo provide a basic characterization of the optical properties of the extragalactic NSS80 sources with reliable optical counterpart associations, in Figure 29 we show the g − i color versus redshift of the 371 extragalactic sources with constrained g − i colors and compare to the SDSS DR7 uniformly selected quasar sample and the rQSOs identified in K19; we note that the optical colors are corrected for Galactic extinction following K19. For quasar-dominated systems, g − i color provides a basic measurement of the amount of optical reddening due to dust (e.g., Fawcett et al. 2020), although emission from the host galaxy can have a significant impact on the optical colors for lower-luminosity and/or heavily obscured AGNs. At a given redshift, a range in g − i color is observed for the BLs and NLs. 76
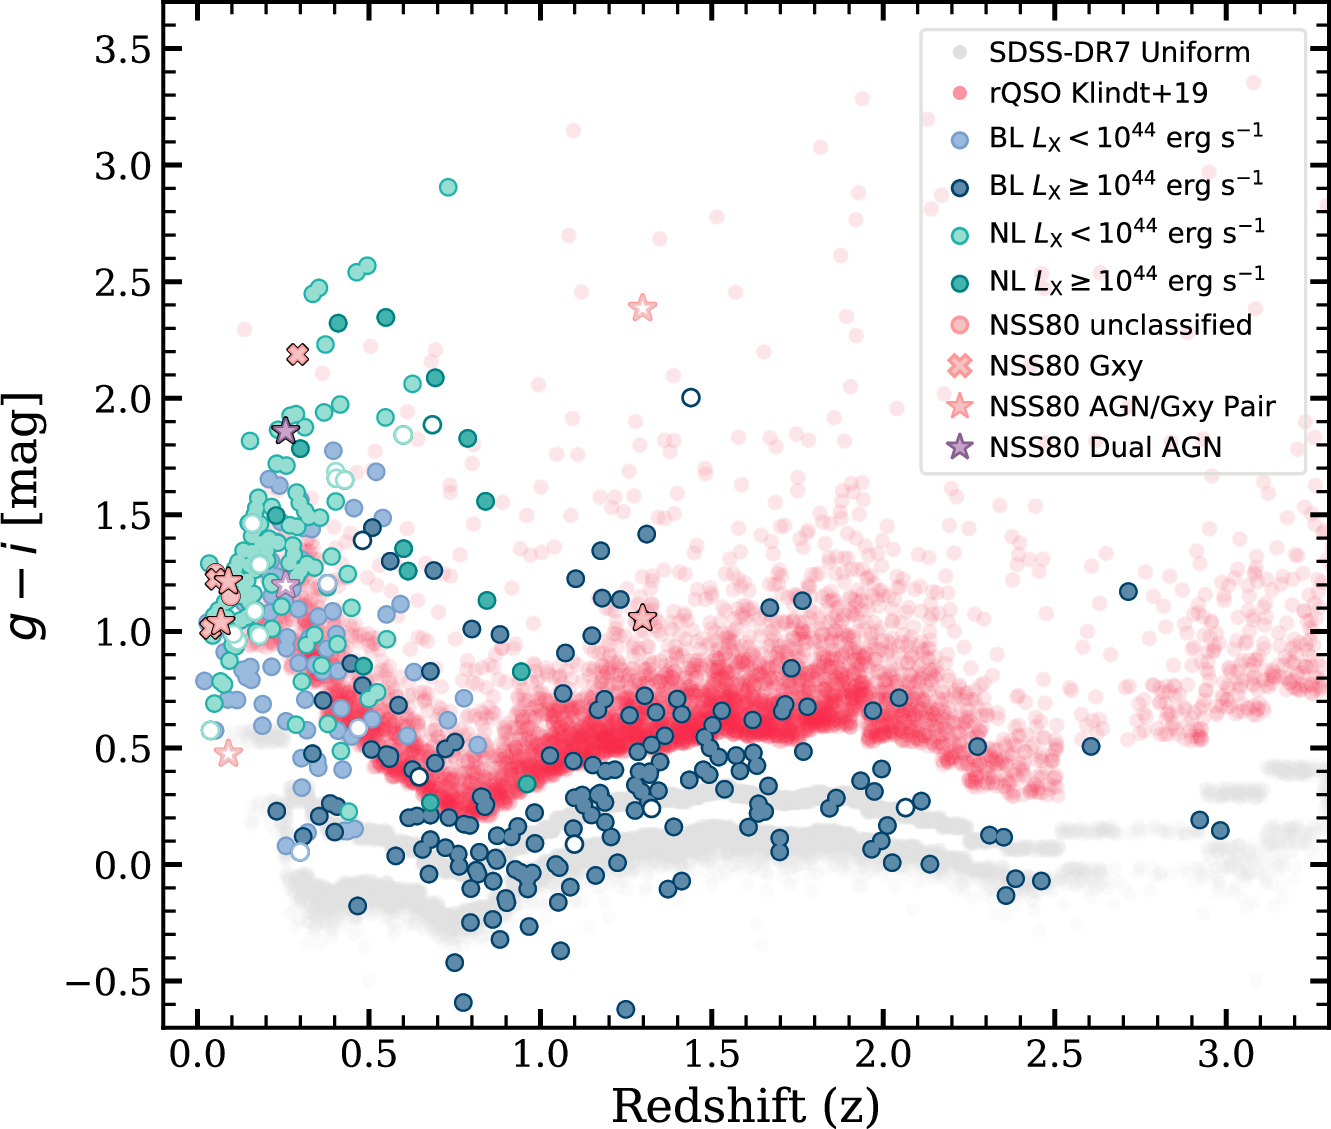
Figure 29. The g − i color vs. redshift for extragalactic NSS80 sources with reliable counterpart associations (also excluding those that are possibly associated with the primary NuSTAR science target), plotted in the different spectroscopic classifications: BL objects (blue circle), NL objects (green circle), unclassified sources (peach circle), galaxies (Gxy; peach “×”), AGN–galaxy pairs (peach star), dual AGN (purple star), and sources with uncertain counterpart identification (white filled circles with green and blue edges). The AGN–galaxy and dual AGN companions are plotted with white filled stars with peach and purple edges, respectively. BL and NL sources with L10−40 keV ≥ 1044 erg s−1 are indicated with dark blue and green circles, while the light blue and green circles codify the lower-luminosity BLs and NLs with L10−40 keV < 1044 erg s−1. SDSS-selected rQSOs (reddest 10% of the g − i distribution; K19) are superimposed on the distribution of the SDSS DR7 uniform sample (shaded gray circles). We use the rQSO track to identify 106 red NSS80 BL sources; of these, 67% (71/106) are at redshifts z ≤ 1. Using the same track, we identify a control sample comprising 145 BL AGN (52%, of which are at z ≤ 1). There is a bias against NLs at higher redshifts, given that all NLs (with constrained g and i magnitudes) are at z ≤ 1.
Download figure:
Standard image High-resolution imageWe use the g − i color threshold from K19 to identify red quasars (corresponding to the 10% most reddened in SDSS; threshold is shown as the bottom edge of rQSOs in Figure 29), finding that 42% (106/251) of the NSS80 BL AGNs with reliable counterpart associations and detections in the g and i bands have red g − i colors (we coin these sources as Nu-rQSOs); we note that in this basic comparison, we reasonably assume no significant differences in the g-band and i-band passbands between the various different optical photometric surveys. 77 Among these is the higher-redshift AGN pair (NuSTARJ091534+4054.6) at z = 1.298, with both BL AGNs identified as red quasars based on their g − i color. The remaining 145/251 BLs we use as a control sample which represents “normal” unobscured quasars (Nu-cQSOs). Of the 114 NLs with reliable counterpart associations and constrained g and i magnitudes, 105 are found to lie within the rQSO g − i region, meaning that 92% of the NLs appear red in their optical colors. Since no clear broad emission lines are seen in these sources, we expect the optical emission to be dominated by the host galaxy, a result also suggested from the optical spectroscopy (see Section 4.4). As the Nu-rQSOs have identified broad emission lines, to first order we would expect the optical colors to be typically due to dust reddening. Overall, the g − i optical color threshold adopted in Figure 29 corresponds to 10% of the SDSS quasars in K19, while 42% of the NuSTAR BL AGNs exceed this threshold. This larger fraction of rQSOs in NSS80 compared to the SDSS could be due to a greater contribution from dust-reddened quasars; however, since SDSS probes more luminous quasars than NSS80, we should keep in mind that a larger fraction could be optically red due to emission from the host galaxy. A combination of template fitting to the UV–MIR photometry, guided by the optical spectroscopic features (e.g., continuum shape, emission, and absorption lines) would be able to constrain the relative contributions to the reddening from the host galaxy and dust extinction, but is beyond the scope of the current study.
4.4. Composite Spectra of the NSS80 AGNs
To provide more direct constraints on the origin of the optical colors of the NSS80 sources, we utilize the spectroscopic data. In this analysis, we construct composite spectra for subsets of the NSS80 spectroscopic sample, divided on the basis of spectral type, optical color, and X-ray luminosity. These composite spectra allow us to search for subtle signatures missed in individual source spectra, such as the absorption features from the host galaxy (e.g., rest-frame Ca ii H+K, G band, Mg i, and Na i-d). The overall continuum shape of the spectra can provide insights on the relative contributions from dust reddening and host-galaxy emission/absorption: in comparison to typical quasars, a drop in continuum flux at blue wavelengths can indicate reddening due to dust, whereas an increase in flux at longer wavelengths can indicate reddening due to host-galaxy contamination.
In Figure 30, we show rest-frame composite spectra for the extragalactic NSS80 sources subdivided into 274 BLs (dark blue solid line; top panel) and 166 NLs (green solid line; middle panel). We compare these composites to the high-quality X-Shooter composite spectra of a subsample of the K19 rQSOs at 1.45 < z < 1.65, which are luminosity matched in rest-frame 6 μm luminosity and redshift to the K19 control quasars (cQSOs). The X-Shooter composite spectra are produced in Fawcett et al. (2022) using geometric mean stacks, and have a continuous spectral coverage from ∼3000−25000 Å. To stack the NSS80 spectra, we followed the same approach as Fawcett et al. (2022): the spectra were first corrected for Galactic extinction, using the Schlegel et al. (1998) map and the Fitzpatrick (1999) Milky Way extinction law, and shifted to rest-frame wavelengths. Each spectrum was then rebinned to a common wavelength grid and normalized at 4000 Å. It is worth noting that the spectra contributing to these stacks were obtained via different instruments and therefore will have different spectral resolutions. Therefore, any interpretation should be mainly limited to the spectral shape, with analysis of emission or absorption lines limited to broad comparisons. To ensure reasonably representative composite spectra, we only include data when at least 15 sources contribute at a given rest-frame wavelength. The scatter within each stack subset varies, e.g., the cQSOs have a lower scatter than rQSOs due to the nature of their populations. However, the scatter is not large enough in any subset to make the comparison of their average properties invalid.
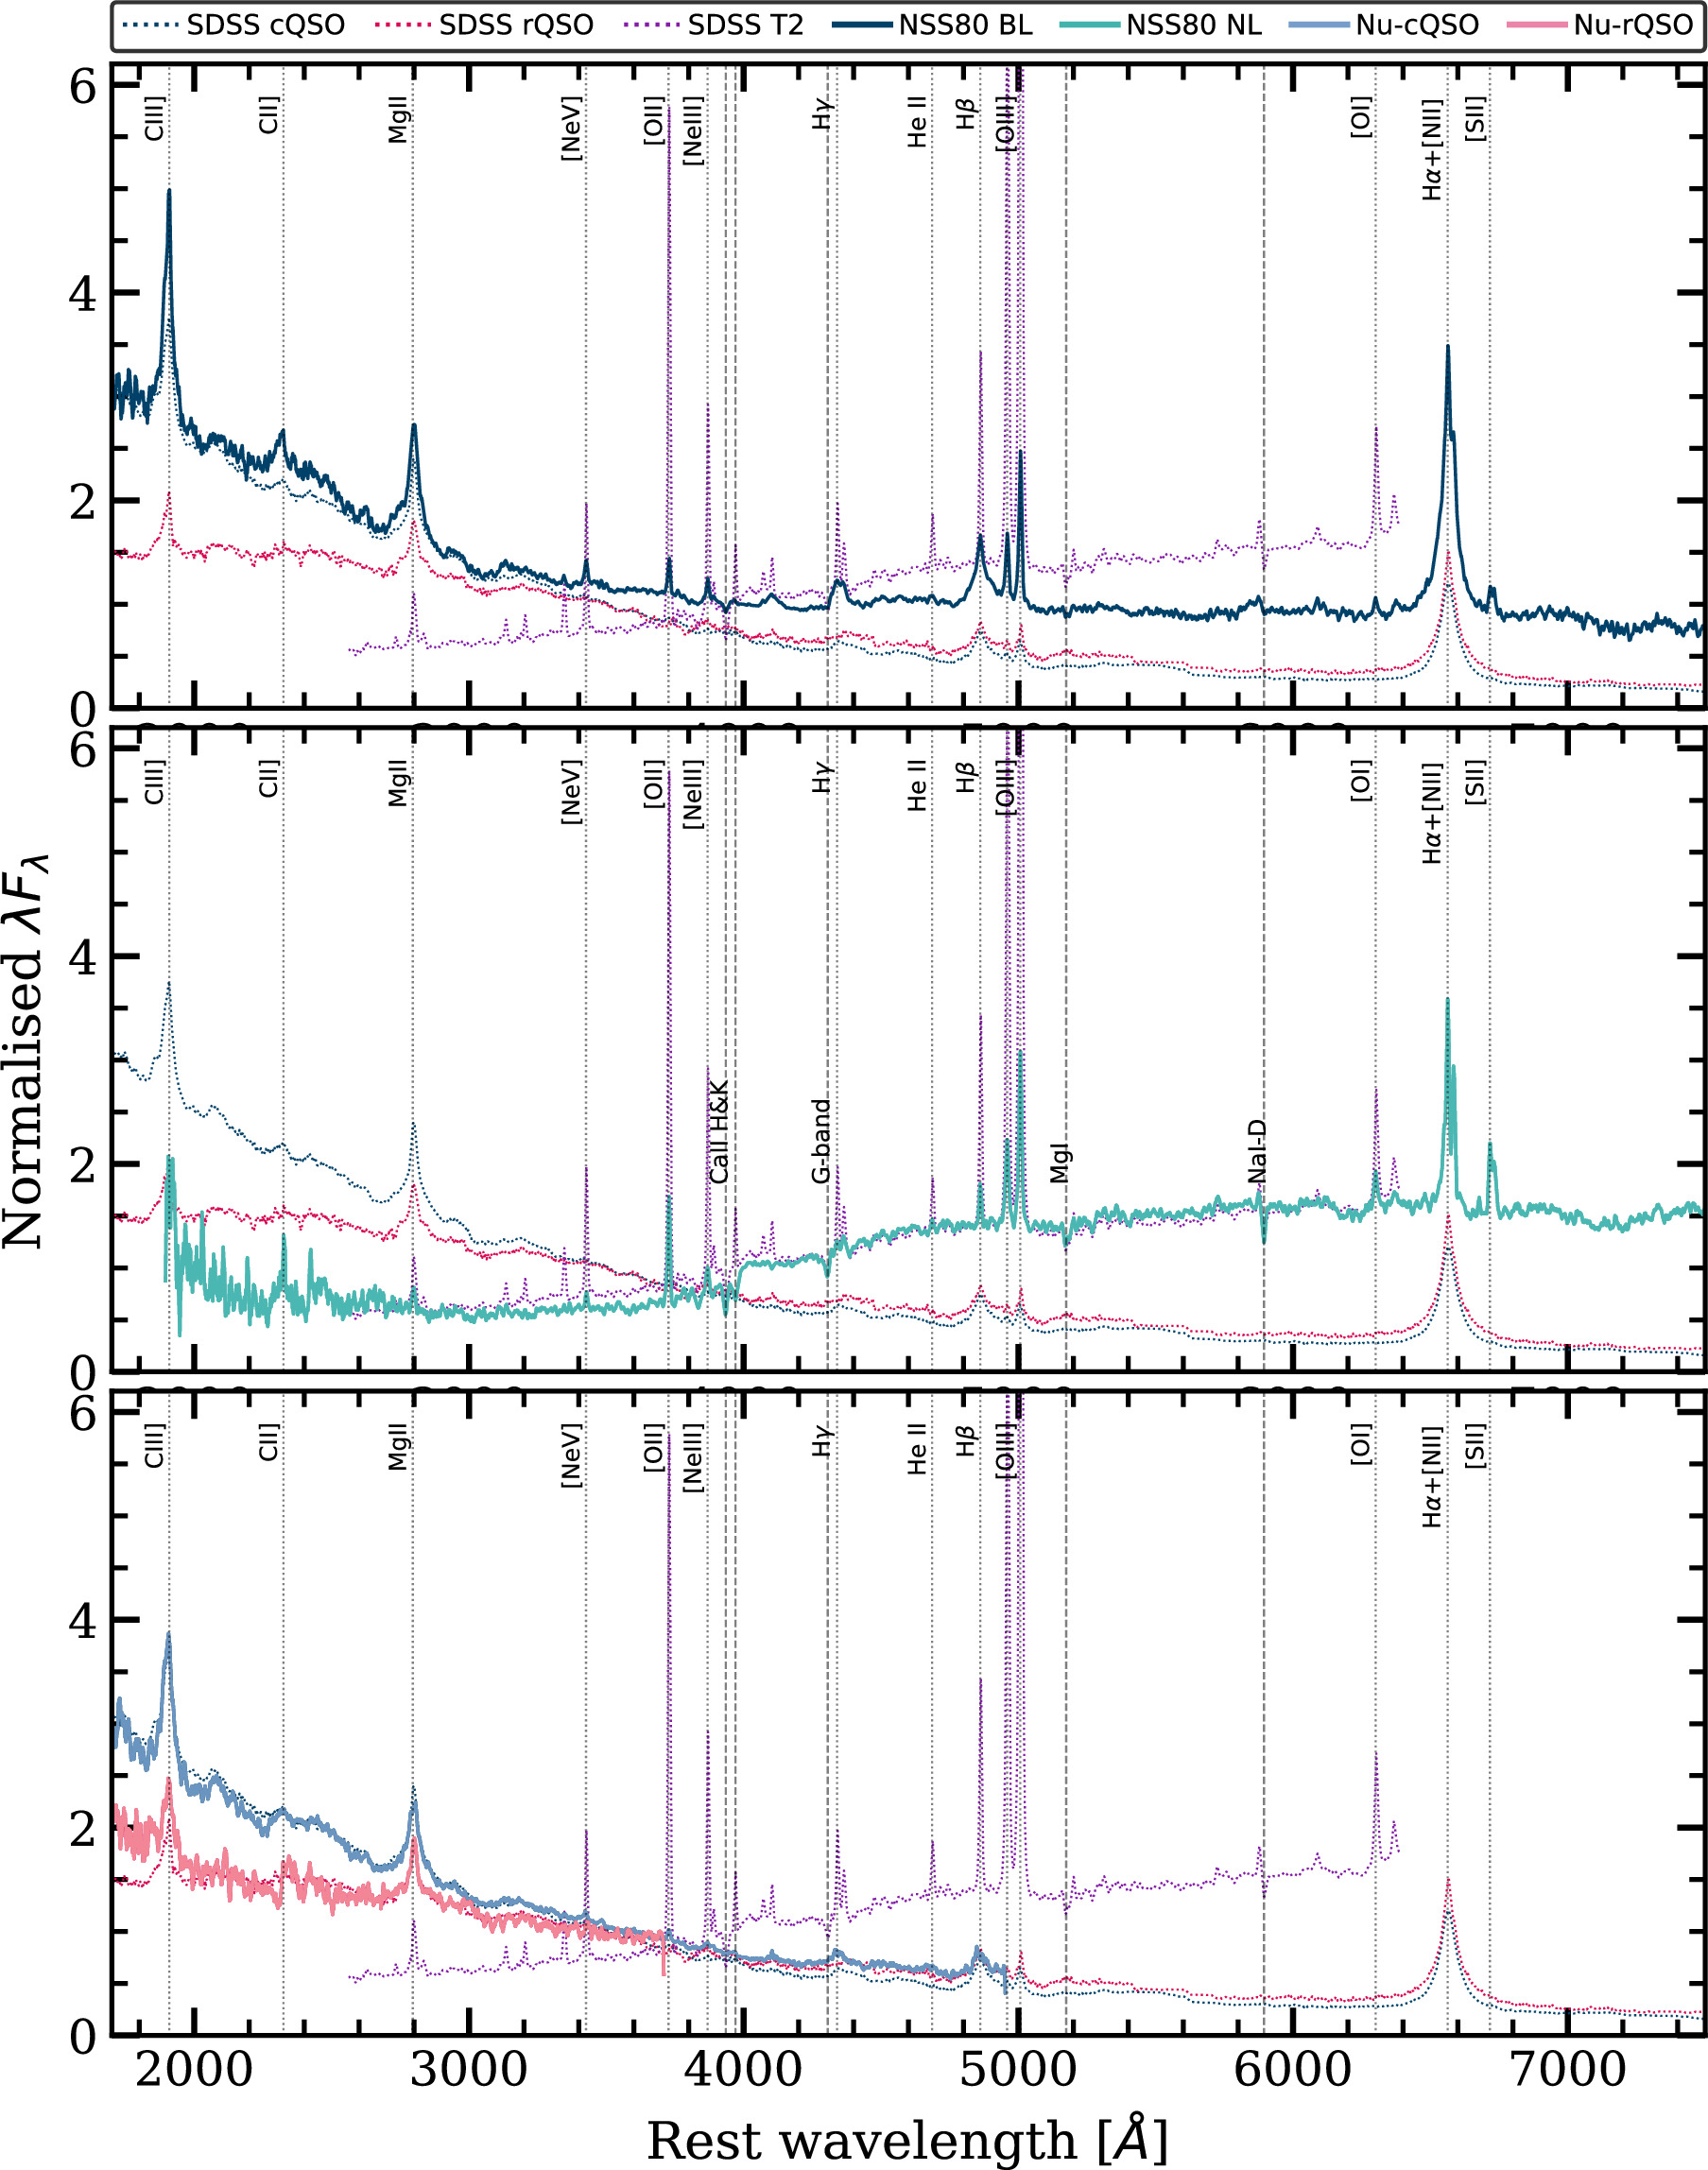
Figure 30. Composite spectra of the spectroscopically confirmed NSS80 BL (top panel; Nstack = 274) and NL (middle panel; Nstack = 166) samples. The BL sample is subdivided (bottom panel) into typical quasars (Nu-cQSO; solid blue line) and red quasars (Nu-rQSO; solid peach line). First, we compare to composite X-Shooter spectra of SDSS quasars, plotted with red and blue dotted lines (Fawcett et al. 2022). The signature AGN emission lines and galaxy absorption lines are plotted with gray dotted and dashed lines, respectively. We also compare to a composite of SDSS Type II AGNs from Yuan et al. (2016; purple dotted line). The spectra are shifted to rest-frame wavelengths and normalized at 4000 Å for illustrative purposes. The source threshold when (geometric mean) stacking the data is 15. Evidence for a larger host-galaxy contribution in the NuSTAR objects compared to SDSS are visible, while toward shorter wavelengths strong evidence for reddening in the NL objects, as well as some in the BL AGNs, can be seen.
Download figure:
Standard image High-resolution imageThe BL composite (dark blue) shows strikingly similar permitted lines to the SDSS quasar X-Shooter composites. However, the NuSTAR composite has stronger forbidden lines (e.g., [Ne v], [O ii], and [Ne iii]) and has a different overall continuum shape with a sharper decrease to UV-blue wavelengths and a rise to red wavelengths. These differences are consistent with that expected by a modest host-galaxy contribution not present in the more luminous SDSS quasars with a light screen of dust reddening suppressing the UV-blue emission. The NL composite (green) is distinctly different from the cQSO and rQSO SDSS composites, with weak UV-blue emission and strong red emission. It shows a continuum shape more consistent with a composite of Type-2 SDSS quasars (purple; Yuan et al. 2016). Furthermore, numerous strong forbidden lines, including [Ne v], [O ii], [Ne iii], [O iii], [O i], and [S ii], and narrow permitted lines are evident. The strong [Ne v] and [O iii], in particular, indicate the presence of an optical NL AGN. The spectral shape of the NL composite is consistent with that expected for a host-galaxy-dominated spectrum due to the AGN emission being completely obscured in the optical waveband, as expected given the lack of broad permitted lines. Direct evidence for a dominant host-galaxy component is vividly seen from the strong host-galaxy absorption features, i.e., Ca ii H+K, G band, Mg i, and Na i-d. Further differences are seen in the BL composite when we split it into Nu-rQSOs (peach) and Nu-cQSOs (light blue); see Figure 29. Both the Nu-rQSOs and Nu-cQSOs show evidence for modest dust reddening due to suppressed UV-blue emission: The weaker shorter-wavelength broad lines relative to Hα (Hβ, Mg ii, and C iii]) for the Nu-rQSOs suggest greater dust reddening than that seen in the Nu-cQSOs. These characteristics are qualitatively consistent with those seen in the SDSS X-Shooter composites. However, in stark constrast to the X-Shooter composites, the Nu-rQSOs and Nu-cQSOs show a rise in the continuum emission to red wavelengths, which is most prominent in the Nu-rQSOs, likely due to an increasing contribution from the host galaxy.
Given the evidence for host-galaxy contributions to the NSS80 composites and the lower overall bolometric luminosties of the NSS80 sources in comparison to the SDSS quasars, we subdivided the NSS80 AGNs according to their luminosities using the quasar X-ray threshold of L10−40 keV = 1044 erg s−1. Figure 31 shows the composites for the NL systems, Nu-cQSOs, and Nu-rQSOs split into low-LX (L10−40 keV < 1044 erg s−1) and high-LX (L10−40 keV > 1044 erg s−1) subsamples, with 3300–5300 Å zoom ins plotted in Figure 32 to emphasize the prominent AGNs and any host-galaxy absorption features. The rest-wavelength coverage for each composite is now more limited since the X-ray luminosity selection corresponds broadly to a redshift selection and hence effectively narrower redshift ranges than the overall composites in Figure 30. Despite this limitation, some similarities and differences are apparent across each of the composite pairs. Overall, the low-LX and high-LX systems within each spectral class have similar emission-line features and UV-blue continuum shapes. However, the low-LX systems all have increased emission at red wavelengths in comparison to the high-LX systems, consistent with a relative increase in the host-galaxy contribution for a decrease in the luminosity of the AGN. This result is qualitatively similar to that seen in the WISE MIR color analyses (see Figure 27 and Section 4.2). As for the overall composites, more direct evidence for a host-galaxy component is seen from the identification of strong host-galaxy absorption, most strikingly in the low-LX NL systems, but also evident from the sometimes weak identification of Ca ii H + K in all of the composites. Greater insight on the host-galaxy and AGN properties, including constraints on the stellar mass and populations, can be gained from detailed fitting of the composite spectra and SEDs using AGN and stellar population models. However, that goes beyond the scope of this study.
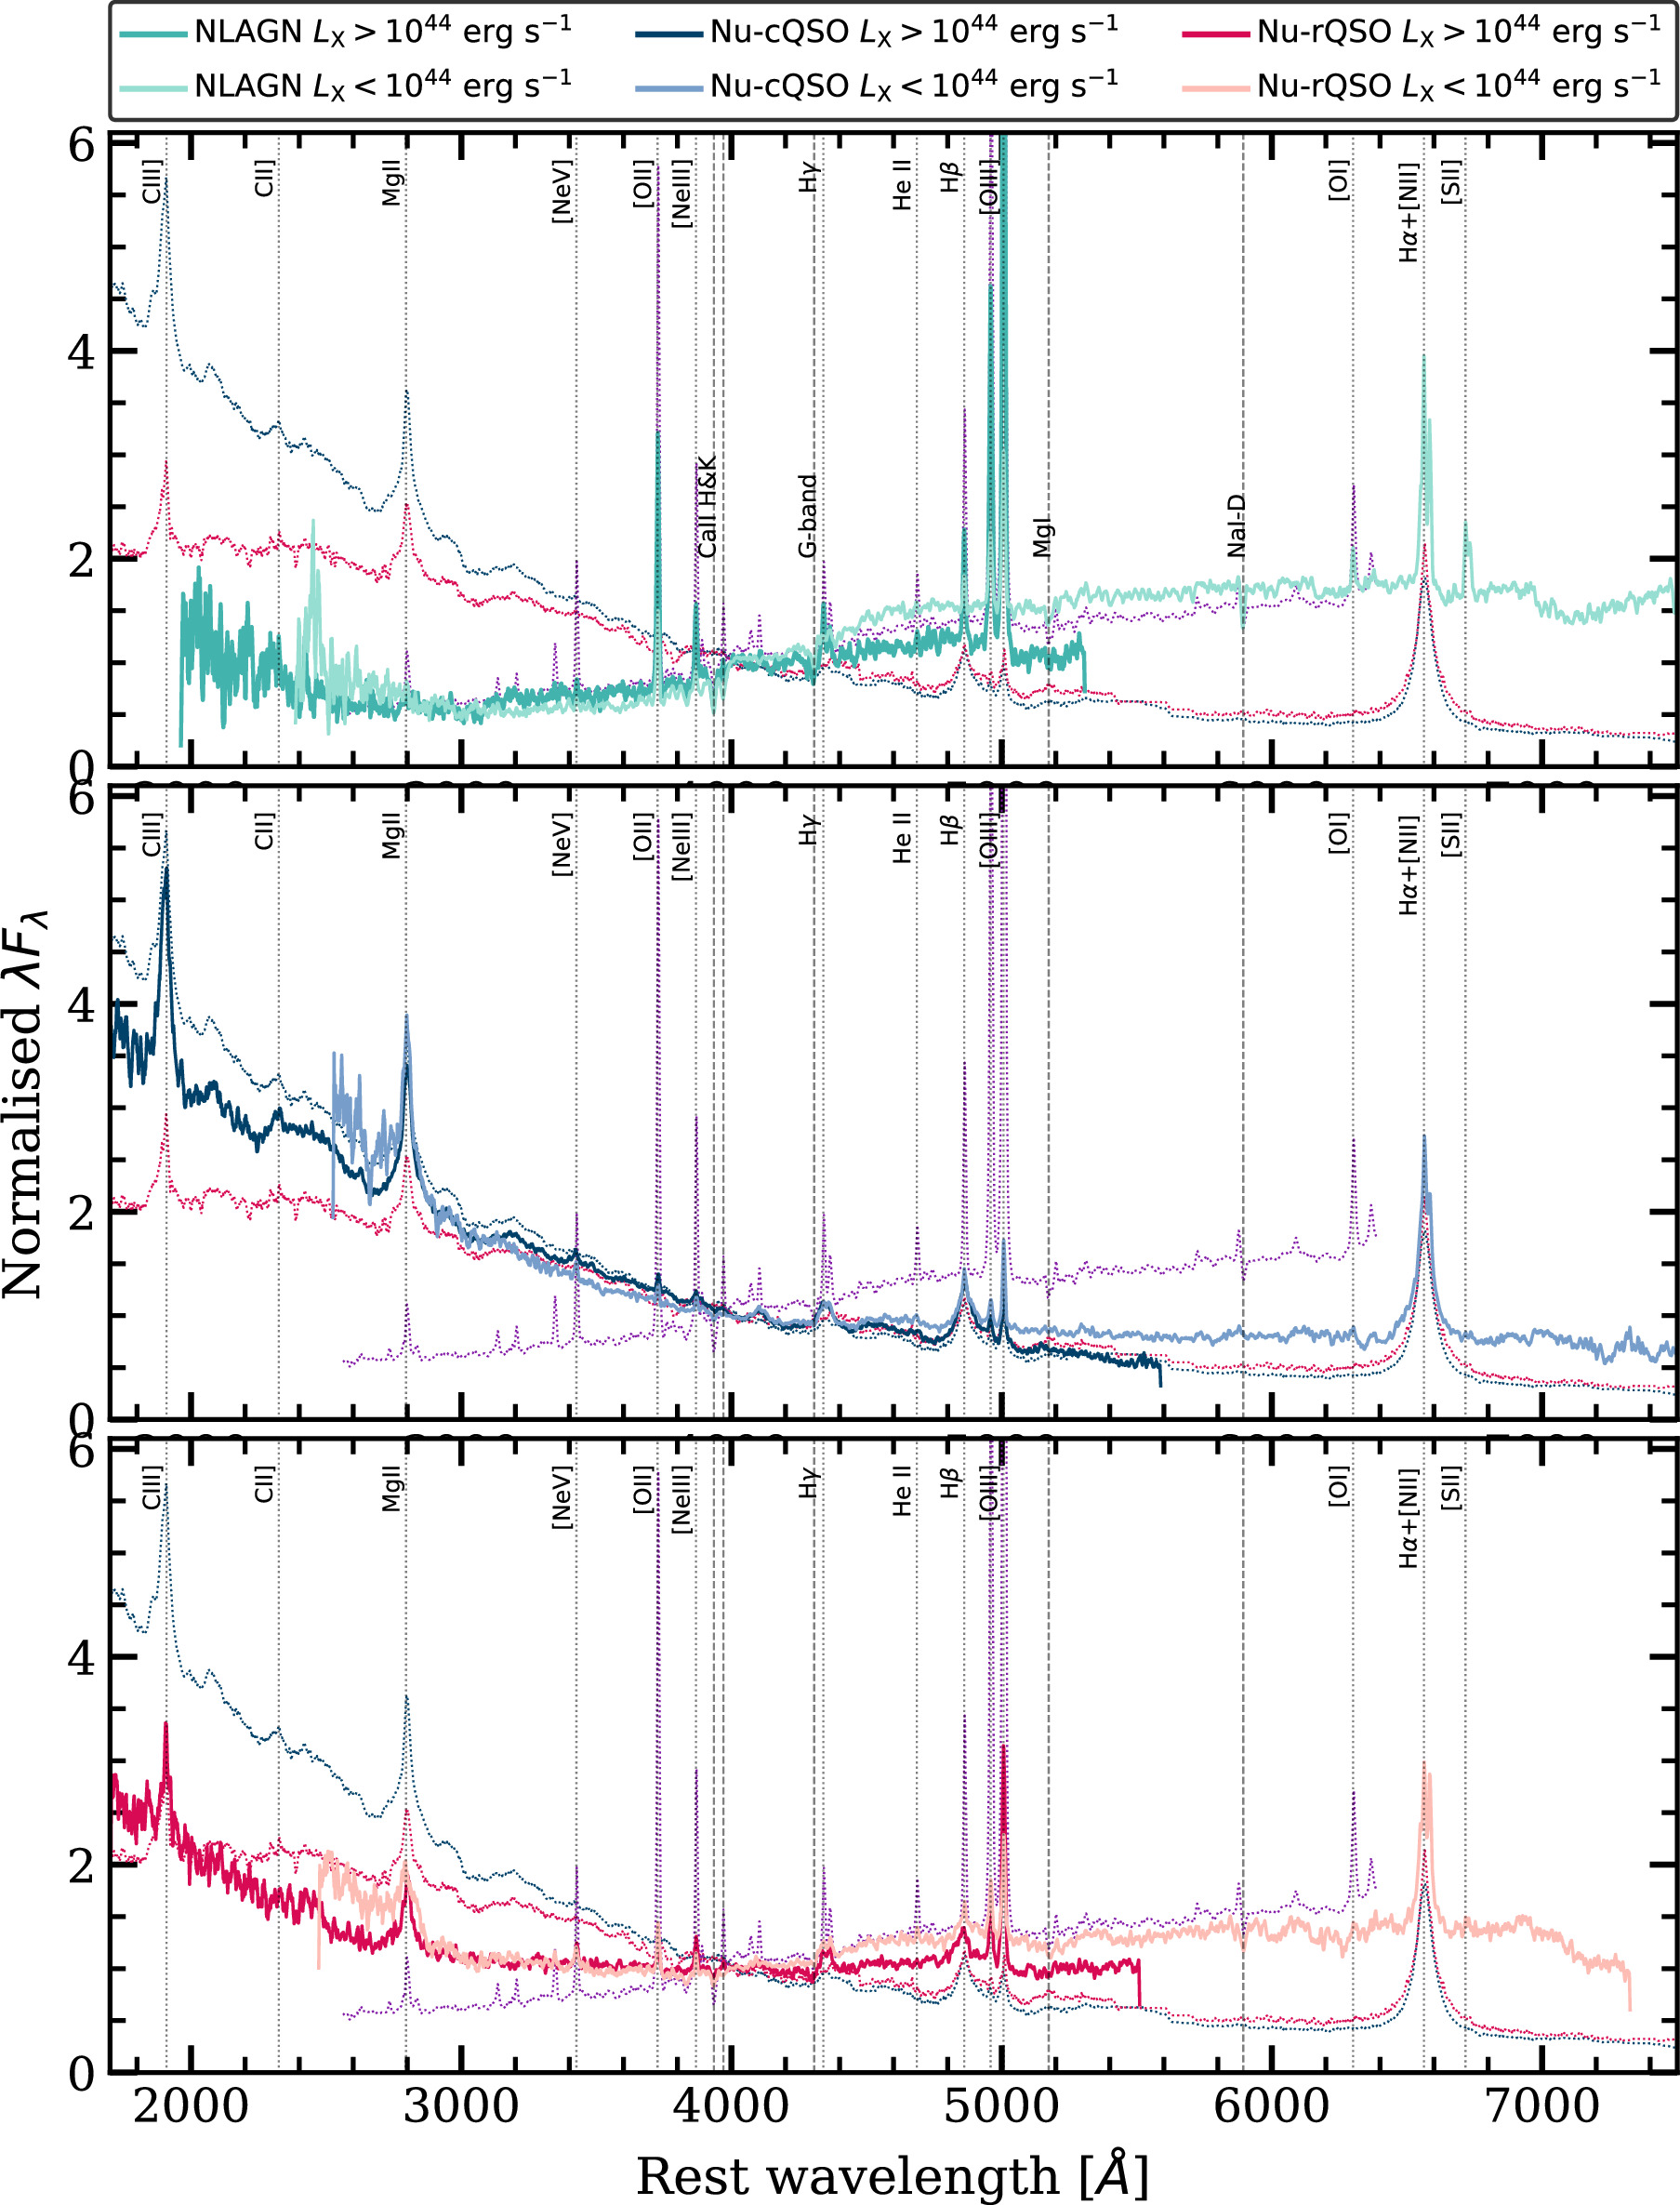
Figure 31. Composite spectra of the spectroscopically confirmed NL AGN (top), Nu-cQSO (middle), and Nu-rQSO (bottom) subdivided into low (light green, light blue, and peach, respectively) and high (dark green, dark blue, and red, respectively) luminosity bins. As in Figure 30, we compare to composite X-Shooter spectra of SDSS quasars, plotted with red and blue dotted lines (Fawcett et al. 2022), and composite spectra of SDSS Type-2 QSOs (Yuan et al. 2016), plotted with a purple dotted line. The signature AGN emission lines and galaxy absorption lines are plotted with gray dotted and dashed lines, respectively; see Figure 32 for zoom ins of the spectral lines. The spectra are shifted to rest-frame wavelengths and normalized at 4000 Å for illustrative purposes.
Download figure:
Standard image High-resolution image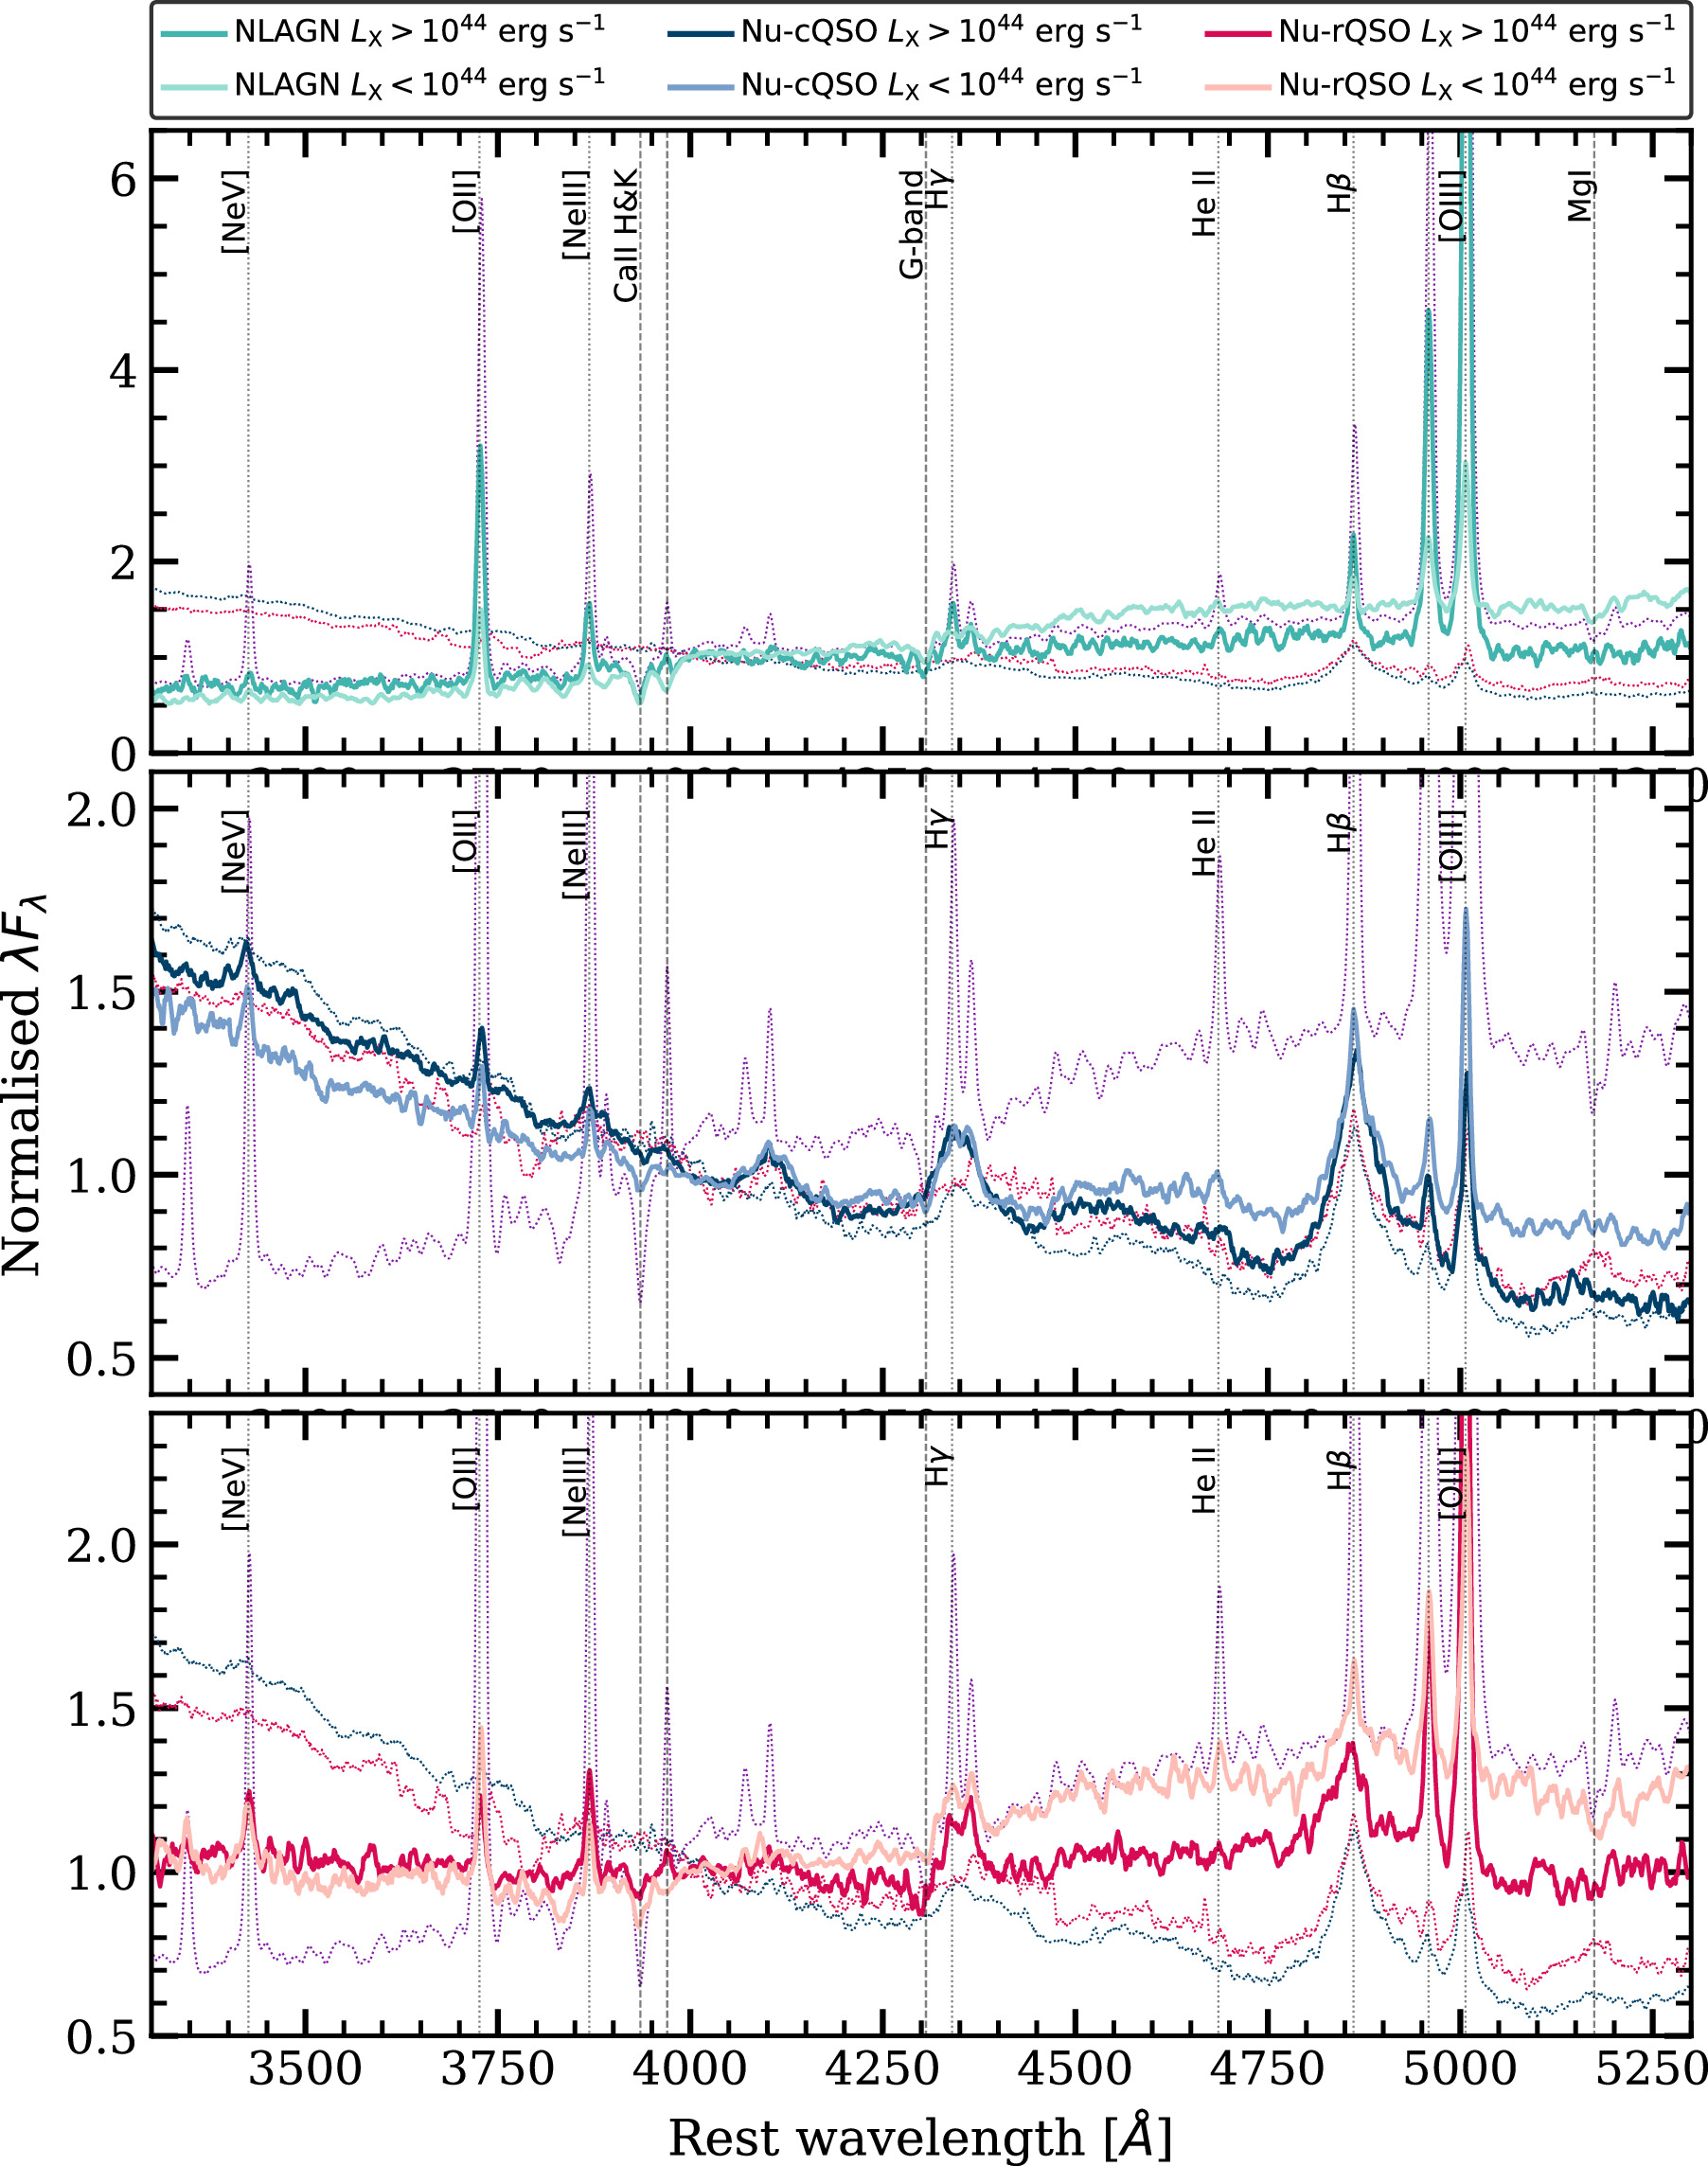
Figure 32. Zoom ins (3300–5300 Å) of the prominent AGN spectral lines in Figure 31 of the spectroscopically confirmed NL AGN, Nu-cQSO, and Nu-rQSO subdivided into low (light green, light blue, and peach, respectively) and high (dark green, dark blue, and red, respectively) luminosity bins. The composite X-Shooter spectra of luminosity–redshift matched SDSS rQSOs and cQSOs (Fawcett et al. 2022) are plotted in red and blue dotted lines, and composite spectra of SDSS Type 2 QSOs (Yuan et al. 2016) as a purple dotted line for comparison.
Download figure:
Standard image High-resolution imageIn K19, we showed that the red optical colors of SDSS rQSOs are predominantly due to reddening of a normal blue quasar, results which have been subsequently confirmed via detailed broadband UV-FIR SED fitting (Calistro Rivera et al. 2021) and broadband UV-near-IR spectral analysis (Fawcett et al. 2022). It is worth bearing in mind that these thinly veiled, dust-obscured optical quasars may represent the detectable end of a more heavily extinguished luminous AGN population which will be missed by SDSS because of their colors (e.g., Glikman et al. 2004; Banerji et al. 2012; Eisenhardt et al. 2012; Ross et al. 2015; Hamann et al. 2017; see Table 2.1 in Klindt 2022 for a summary of dust-reddened quasars). By comparison, our analyses of the Nu-rQSOs have shown that a substantial contribution of the red optical emission is due to a host-galaxy component rather than dust reddening of the quasar in the lower-luminosity objects. On the other hand, dust obscuration (which dominates the shape at the blue end of the spectrum) plays a key role in the excess red colors for the more luminous BL objects. Hence, it is important to keep in mind the differences in the typical luminosities between the SDSS quasars and the NSS80 sources (see Figure 28). Indeed, in their broadband SED fitting of SDSS quasars, Calistro Rivera et al. (2021) found that the host galaxy is likely to dominate in the lower-luminosity rQSOs (and to make a significant contribution in cQSOs), corresponding broadly to the luminosities of the NSS80 sources (see Figure 5 of Calistro Rivera et al. 2021). Consequently, caution must be applied when adopting a simple g − i optical color cut for lower-luminosity quasars and AGNs.
5. Summary
In this work, we present the NuSTAR serendipitous survey 80 month catalog (NSS80)—the most recent and largest survey undertaken with NuSTAR. The NSS80 succeeds the NSS40 catalog reported in Lansbury et al. (2017b) and incorporates data from the full 80 month period (2012 July–2019 March) of telescope operation. The data include 894 unique fields (563 newly published data from the post-NSS40 period), with a total areal coverage of 36 deg2, and a cumulative exposure time of ≈62 Ms. Due to an increase in the fraction of GO observations over the NSS40 catalog, the areal coverage, integrated exposure, number of fields, and number of sources in the NSS80 are a factor ≈3 larger than those presented in Lansbury et al. (2017b). Furthermore, we have characterized the NuSTAR-detected AGNs in terms of their X-ray, optical, and IR properties. Below, we summarize the main results:
- 1.Overall, we detect 1488 sources which are significant post-deblending (i.e., after accounting for contamination of the photon counts from nearby sources). To enable easy and efficient use of the NSS80, 214 NuSTAR sources residing in highly extended optical galaxies and galaxy clusters are placed in a secondary catalog, available in Appendix B, to complement the primary catalog, which constitutes 1274 X-ray sources (Appendix A), the majority of which are dominated by AGNs in fainter field galaxies. Of these, 412 are independently detected in the hard (8–24 keV) energy band; see Section 2.3.
- 2.Key improvements made in the construction of the NSS80 catalog over those adopted for the NSS40 catalog include (i) mosaicking of overlapping fields from different observational programs to increase the sensitivity, and (ii) masking of fields with large optical/IR hosts post processing to construct a secondary catalog of sources which previously were excluded altogether. Overall, we find 91% of NSS40 sources are retained in NSS80, while 36 NSS40 sources are undetected in NSS80. For the majority of these undetected sources, the deeper data have improved the false-probability estimates and, consequently, eliminate low-significance detections.
- 3.The full-band (3–24 keV) fluxes cover a range of f3−24 keV ≈ 10−14–10−11 erg s−1 cm−2, with a median value of 〈f3−24 keV〉 = 9.82 × 10⁻¹⁴ erg s−1 cm−2; see Section 4.1.1. The NuSTAR serendipitous survey has the largest areal coverage at all fluxes compared to the NuSTAR deep-field surveys in well-studied fields (e.g., COSMOS, ECDFS, EGS, GOODS-N, and UDS), reaching similar flux depths. Consequently, the combination of NSS80 with the deep-field surveys allows for a factor ≈2 improvement in analyses of the faint end of the hard X-ray source population compared to that from just the deep-field surveys; see Section 2.2. Furthermore, in Section 4.1.3 we show that NSS80 reaches ≈2 orders of magnitude fainter than the Swift-BAT all-sky survey.
- 4.A large range in the observed band ratios of the NSS80 spectroscopically confirmed AGNs is seen at 3–24 keV (Section 4.1.2). This implies a range of observed photon indices going from very soft Γeff ≈ 3 to very hard Γeff ≈ 0. Contrary to that previously found for lower-energy X-ray bands, our results show no evidence for an anticorrelation between band ratio and X-ray count rate.
- 5.To study the multiwavelength properties of the NuSTAR serendipitous sources, we required lower-energy X-ray (<10 keV) counterparts with higher positional accuracies to reliably match to optical and IR counterparts. To search for lower-energy X-ray counterparts, we utilized Chandra (CSC2), XMM-Newton (4XMM-DR10/s), and Swift-XRT (2SXPS). In total, we identified a lower-energy X-ray counterpart for 76% (964/1274) of the primary NSS80 catalog detected in surveys or archival data from the four lower-energy X-ray catalogs. The remaining 310 NSS80 sources lack lower-energy X-ray counterparts, which can be attributed to either insufficient or zero lower-energy X-ray coverage or, in the minority of cases, a false NuSTAR detection (e.g., sources with detection probabilities close to the threshold;
 ). We find that the lower-energy X-ray counterpart fluxes are generally in agreement with the NuSTAR fluxes for the 3–8 keV (soft) energy band. A maximum variation of a factor of ≈5 between the lower-energy X-ray and NuSTAR flux observations is identified, which can be attributed to source variability detected in the noncontemporaneous X-ray observations and Eddington bias; see Section 4.1. This variability can have two origins: either a change in intrinsic AGN luminosity or a change in the line-of-sight column density due to the nonuniform distribution of the obscuring material surrounding the accreting supermassive black hole.
 - 6.In NSS40 a relatively simple closest-neighbor approach was used to identify multiwavelength counterparts for follow-up spectroscopy. In the NSS80 catalog, however, we adopted a more sophisticated probabilistic approach with Nway to identify IR (CatWISE20) and optical (PS1-DR2) counterparts; see Section 3.2. The bulk of the NSS80 sources (95%) have at least one Nway match with a match probability >10%, 74% of which coincide with a lower-energy X-ray counterpart, and the remaining 26% have NuSTAR-only X-ray positions (due to insufficient or no lower-energy X-ray coverage). Overall, we find 953 high-probability CatWISE20/PS1 counterpart matches to the NSS80 sources, of which ∼76% are at extragalactic latitudes ∣b∣ > 20°.
- 7.Optical spectroscopic identifications (i.e., redshift measurements and source classifications) have successfully been obtained for 547 sources; see Section 3.3.3. An additional three sources have redshift estimates, but lack source classifications. We obtained spectroscopic identifications for the majority of sources (427) via our extensive campaign of ground-based spectroscopic follow-up, using a range of observatories at multiple geographic latitudes; see Section 3.3.2. We spectroscopically confirm 58 sources as Galactic objects. Of the 492 extragalactic sources (AGNs), 284 (57.7%) are classified as broad-line AGNs (BL), 194 (39.4%) are narrow-line sources (NL), 10 are galaxies (Gxy; absorption-line spectra), one is a galaxy cluster, and three are unclassified but have redshift measurements from the literature. Among these, there are three AGN pairs, of which one pair is a dual AGN system, two are AGN–galaxy pairs, and one a galaxy pair. For a further 43 sources a faint continuum (often red) is detected, lacking spectral features and, consequently, spectroscopic identifications. One of these sources is a BL Lac candidate, and another is a pair of (extremely faint) sources of unknown type. The remaining one source is a hotspot of 4C 74.26 (radio quasar), which was targeted as the primary NuSTAR science target. While similar numbers of NLs and BLs are identified at lower redshifts (z ≲ 1), there is a bias against detections of high-redshift NLs that are optically fainter, and against the detection of highly obscured AGNs; see Section 4.1.3.
- 8.The NSS80 AGNs have redshifts covering a wide range, from 0.012 to 3.43, with a median redshift of 〈z〉 = 0.56; see Section 4.1.3. The rest-frame 10–40 keV luminosities also span a wide range of L10−40 keV ≈ 1042−46 erg s−1, with a median value of 〈L10−40 keV〉 = 1.2 × 1044 erg s−1. Previous X-ray missions with sensitivity at >10 keV were able to sample the AGN population below the knee of the X-ray luminosity function (L*) for redshifts up to z ≈ 0.05, and NuSTAR extends this to z ≈ 1. Using the NuSTAR band ratio, we identify 22 CT candidate sources: seven are identified in the NSS40 catalog and 15 are newly identified sources with the post-NSS40 observations; see Section 4.1.2.
- 9.We use the distribution of WISE W1 − W2 and W2 − W3 colors for the extragalactic NSS80 sources, since the reprocessed emission from the AGNs’ circumnuclear dust is distinguishable from starlight (which peaks in the FIR regime) at MIR wavelengths (predominantly for high-luminosity AGNs); see Section 4.2. We find that 95% of high-LX BL AGNs will successfully be selected using the AGN wedge, while NL AGNs have a significantly lower chance of being identified as AGNs based on their MIR colors alone. This is largely driven by the lower-luminosity objects with 10−40 keV luminosities below the X-ray quasar threshold. It is notable that a number of luminous NuSTAR-selected BL AGNs are not selected in the MIR—this appears to be driven by the intrinsic AGN properties. Furthermore, from the MIR colors, we can deduce that >90% of the MIR light in two-thirds of the objects come from an AGN, while approximately a third are host dominated.
- 10.Given that hard X-rays are largely unbiased against dust obscuration up to CT levels, NuSTAR facilitates the discovery of rare and extreme sources such as red quasars. We therefore explore the optical and IR properties of the NSS80 AGN sample, with particular focus on red quasars and the narrative that X-rays may be telling about this peculiar subpopulation of AGNs; see Section 4.3. Forty-two percent (106/251) of the BL AGNs with robust counterpart associations have red g − i colors, half of which have luminosities exceeding the X-ray quasar threshold and therefore are potentially dust-reddened quasars. The remaining 145 BLs have g − i colors consistent with the typical quasar population. Furthermore, 92% of the NLs appear red in their optical colors; however, the majority are low-luminosity objects with L10−40 keV < 1044 erg s−1 and therefore will have host-galaxy-dominated emission. Altogether, the NSS80 AGNs are typically 0.3 dex less luminous than SDSS quasars, with a median bolometric luminosity of 〈Lbol,X〉 = 5.93 × 10⁴ erg s−1 at the median BL AGN redshift of 〈z〉 ≈ 0.8.
- 11.Finally, we present optical spectra composites to study the spectral properties of the NSS80 AGNs to investigate the driving force behind the colors of the NSS80 red quasars; see Section 4.4. Overall, for all spectral types the host-galaxy features are more prominent in the low-LX when compared to the high-LX systems: These signatures are enhanced emission at red wavelengths and host-galaxy absorption features, although these are weak in some of the composites. This is consistent with basic expectations for a decreasing AGN contribution relative to the host-galaxy emission. Hence, our spectroscopic analysis indicates that reddening from the presence of a host galaxy can have a large contribution to the optical colors in the hard-X-ray-selected population of lower-luminosity quasars.Our future work will focus on further follow-up studies of the current NSS80 sources, aiming to complete the spectroscopic follow-up of the catalog and to obtain detailed analysis of sources with >8 keV detections, which are unique to NuSTAR.
The NSS80 is a valuable legacy of the NuSTAR observatory and provides a powerful sample for future studies of the hard X-ray emitting population. Our total sample size (1488 sources) is relatively modest compared to the samples of hundreds of thousands of sources compiled with XMM-Newton, Chandra, or Swift (e.g., Webb et al. 2020; Evans et al. 2019, 2020)—achieved thanks to the larger fields of view, higher sensitivities, and longer lifetimes of these observatories compared to NuSTAR—or the much larger samples (at soft X-ray energies) that are now being provided by dedicated surveys with eROSITA (Merloni et al. 2012; Predehl et al. 2021; Brunner et al. 2022). In contrast to these prior studies, we have been careful to ensure our sample consists only of truly serendipitous detections and excludes any sources associated with the targets of the observations, which is vital for carrying out scientific studies that require an unbiased sampling of the population (see also Delaney et al. 2023). Our sample remains unique in accessing faint sources at hard (≳8 keV) X-ray energies with a high degree of spectroscopic completeness, providing important constraints on the obscured AGN population outside the local Universe.
Acknowledgments
This paper is jointly led by L.K. and C.L.G.: the original draft was primarily produced by L.K., and formed a major component of her PhD thesis, and the modifications made to the draft following an extensive referee report were carried out by C.L.G.. We acknowledge financial support from the following: a Faculty of Science Durham Doctoral Scholarship (L.K.), a European Southern Observatory (ESO) postdoctoral research fellowship (G.B.L. and M.H.), the Science and Technology Facilities Council (STFC; D.M.A. and D.J.R. through grant code ST/P000541/1; D.M.A. and C.L.G. through grant codes ST/T000244/1 and ST/X001075/1), and an STFC Ernest Rutherford Fellowship (J.A. through grant code ST/P004172/1). The work of D.S. and T.C. was carried out at the Jet Propulsion Laboratory, California Institute of Technology, under a contract with the National Aeronautics and Space Administration (grant No. 80NM0018D0004). F.E.B. acknowledges support from ANID-Chile BASAL AFB-170002, ACE210002, and FB210003, FONDECYT Regular 1200495 and 1190818, and Millennium Science Initiative Program - ICN12_009. P.G.B. acknowledges financial support from the Czech Science Foundation project No. 22-22643S. W.N.B. acknowledges financial support from the V.M. Willaman Endowment. V.A.F. acknowledges funding from a United Kingdom Research and Innovation grant (code: MR/V022830/1). E.S.K. acknowledges financial support from the Centre National d’Etudes Spatiales (CNES). S.M. acknowledges funding from the the INAF “Progetti di Ricerca di Rilevante Interesse Nazionale” (PRIN), Bando 2019 (project: “Piercing through the clouds: a multiwavelength study of obscured accretion in nearby supermassive black holes”). G.N. acknowledges funding support from the Natural Sciences and Engineering Research Council (NSERC) of Canada through a Discovery Grant and Discovery Accelerator Supplement, and from the Canadian Space Agency through grant No. 18JWST-GTO1. C.R. acknowledges support from Fondecyt Regular grant No. 1230345 and ANID BASAL project FB210003. E.R.C. and P.V. acknowledges the support of the South African National Research Foundation. E.T. acknowledges support from FONDECYT Regular 1190818 and 1200495, ANID grants CATA-Basal AFB-170002, ACE210002, and FB210003, and Millennium Nucleus NCN19_058. C.M.U. would like to acknowledge support from the National Aeronautics and Space Administration via ADAP grant No. 80NSSC18K0418.
We extend gratitude to Sam Tweety Anthony, Subhash Bose, Tea Freedman-Susskind, Tyler George, Elena González Egea, Feiyang Liu, Dan MacMillan, Jeff Maggio, Adric Riedel, Michael Rivkin, Manika Sidhu, Jamie Soon, Thomas Venville, Yerong Xu, and Emily Zhang for their support during the ground-based follow-up observations. We thank Victoria Fawcett for her valuable contribution by producing the composite spectra presented in Section 4.4.
This work was supported under NASA Contract No. NNG08FD60C, and made use of data from the NuSTAR mission, a project led by the California Institute of Technology, managed by the Jet Propulsion Laboratory, and funded by the National Aeronautics and Space Administration. We thank the NuSTAR Operations, Software and Calibration teams for support with the execution and analysis of these observations. This research has made use of the NuSTAR Data Analysis Software (NuSTARDAS) jointly developed by the ASI Science Data Center (ASDC, Italy) and the California Institute of Technology (USA).
Facilities: CXO - Chandra X-ray Observatory satellite, VLT:Antu - Very Large Telescope (Antu) (FORS2), Keck:I - KECK I Telescope, NuSTAR - The NuSTAR (Nuclear Spectroscopic Telescope Array) mission, Hale - Palomar Observatory's 5.1m Hale Telescope, SALT - Southern African Large Telescope, Sloan - Sloan Digital Sky Survey Telescope, Swift - Swift Gamma-Ray Burst Mission, WISE - Wide-field Infrared Survey Explorer, XMM - Newton X-Ray Multimirror Mission satellite.
Some of the data presented herein were obtained at the W. M. Keck Observatory, which is operated as a scientific partnership among the California Institute of Technology, the University of California and the National Aeronautics and Space Administration. The Observatory was made possible by the generous financial support of the W. M. Keck Foundation. Some of the observations reported in this paper were obtained with the Southern African Large Telescope (SALT) under programs 2017-1-SCI-053, 2017-2-SCI-037, and 2018-2-MLT-006 (PI: L. Klindt). The Wide-field Infrared Survey Explorer (WISE) is a joint project of the University of California, Los Angeles, and the Jet Propulsion Laboratory/California Institute of Technology, funded by the National Aeronautics and Space Administration. The National Radio Astronomy Observatory is a facility of the National Science Foundation operated under cooperative agreement by Associated Universities, Inc. Funding for the SDSS and SDSS-II has been provided by the Alfred P. Sloan Foundation, the Participating Institutions, the National Science Foundation, the U.S. Department of Energy, the National Aeronautics and Space Administration, the Japanese Monbukagakusho, the Max Planck Society, and the Higher Education Funding Council for England. The SDSS is managed by the Astrophysical Research Consortium for the Participating Institutions. The Participating Institutions are the American Museum of Natural History, Astrophysical Institute Potsdam, University of Basel, University of Cambridge, Case Western Reserve University, University of Chicago, Drexel University, Fermilab, the Institute for Advanced Study, the Japan Participation Group, Johns Hopkins University, the Joint Institute for Nuclear Astrophysics, the Kavli Institute for Particle Astrophysics and Cosmology, the Korean Scientist Group, the Chinese Academy of Sciences (LAMOST), Los Alamos National Laboratory, the Max-Planck-Institute for Astronomy (MPIA), the Max-Planck-Institute for Astrophysics (MPA), New Mexico State University, Ohio State University, University of Pittsburgh, University of Portsmouth, Princeton University, the United States Naval Observatory, and the University of Washington. This research uses services or data provided by the Astro Data Lab, which is part of the Community Science and Data Center (CSDC) program at NSF’s National Optical-Infrared Astronomy Research Laboratory. NOIRLab is operated by the Association of Universities for Research in Astronomy (AURA), Inc. under a cooperative agreement with the National Science Foundation.
Software: Astropy (Astropy Collaboration et al. 2013, 2018, 2022), Matplotlib (Hunter 2007), NumPy (Harris et al. 2020), and SciPy (Virtanen et al. 2020).
Appendix A: Description of the Primary NSS80 Source Catalog
The primary NuSTAR serendipitous survey source catalog, containing 1274 sources in total, is available as an electronic table on the NSS80 web page. Here we describe the columns of the catalog, which are summarized in Table 11.
Table 11. Column Descriptions for the Primary NSS80 Catalog
| Column Number | Column Name | Description |
|---|---|---|
| 1 | ID | The unique source identification number, in order of increasing R.A. |
| 2 | NSS80_Name | The unique NuSTAR source name, following the IAU-approved format: NuSTAR JHHMMSSDDMM.m, where “m” is the truncated fraction of 1′ for the arcseconds component of the decl. |
| 3 | Serendip | The unique NuSTAR field and source index. |
| 4 | IDL17 | The unique L17 source identification number. |
| 5 | Serendip_L17 | The unique L17 NuSTAR field and source index. |
| 6, 7 | RAJ2000,DECJ2000 | The NuSTAR R.A. and decl. coordinates (J2000), as described in Section 2.3. |
| 8, 9 | Gal_lat,Gal_Long | IAU 1958 Galactic latitude and longitude. |
| 10, 11, 12 | SFlag,HFlag,HFlag | A binary flag indicating the energy bands for which the source is detected for the three standard NuSTAR energy bands. |
| 13, 14, 15 | SdbFlag,HdbFlag,FdbFlag | Same as columns 10–12, post-deblending. |
| 16, 17, 18 | logSP,logHP,logFP | The logarithm of the false probabilities for the three standard NuSTAR energy bands. |
| 19 | logMinP | The NuSTAR detection likelihood. |
| 20, 21, 22 | logSdbP,logHdbP,logFdbP | The same as columns 16–18, post-deblending. |
| 23 | logMindbP | The same as column 19, post-deblending. |
| 24 | dbFlag | A binary flag indicating whether the source is significant post-deblending, for at least one energy band. |
| 25, 26 | Scts,e_Scts | Total source count for the soft energy band and associated errors. |
| 27 | SBck | Background count for the soft energy band. |
| 28, 29 | SNet,e_SNet | Net source count for the soft energy band and associated errors. |
| 30, 31 | Hcts, e_Hcts | Total source count for the hard energy band and associated errors. |
| 32 | HBck | Background count for the hard energy band. |
| 33, 34 | HNet,e_HNet | Net source count for the hard energy band and associated errors. |
| 35, 36 | Fcts, e_Fcts | Total source count for the full energy band and associated errors. |
| 37 | FBck | Background count for the full energy band. |
| 38, 39 | FNet,e_FNet | Net source count for the full energy band and associated errors. |
| 40 | Sdbcts | Total source count for the soft energy band, post-deblending. |
| 41 | SdbBck | Background count for the soft energy band, post-deblending. |
| 42, 43 | SdbNet,e_SdbNet | Net source count for the soft energy band, post-deblending and associated errors. |
| 44 | Hdbcts | Total source count for the hard energy band, post-deblending. |
| 45 | HdbBck | Background count for the hard energy band, post-deblending. |
| 46, 47 | HdbNet,e_HdbNet | Net source count for the hard energy band, post-deblending and associated errors. |
| 48 | Fdbcts | Total source count for the full energy band, post-deblending. |
| 49 | FdbBck | Background count for the full energy band, post-deblending. |
| 50, 51 | FdbNet,e_FdbNet | Net source count for the full energy band, post-deblending and associated errors. |
| 52, 53, 54 | Sexp,Hexp,Fexp | Net vignetting-corrected exposure times at the source position, for the combined A + B data. |
| 55, 56 | SCR,e_SCR | Total source count rate for the soft energy band and associated errors. |
| 57 | SCRBck | Background count rate for the soft energy band. |
| 58, 59 | SNetCR,e_SNetCR | Net source count rate for the soft energy band and associated errors. |
| 60, 61 | HCR,e_HCR | Total source count rate for the hard energy band and associated errors. |
| 62 | HCRBck | Background count rate for the hard energy band. |
| 63, 64 | HNetCR,e_HNetCR | Net source count rate for the hard energy band and associated errors. |
| 65, 66 | FCR,e_FCR | Total source count rate for the full energy band and associated errors. |
| 67 | FCRBck | Backgroung count rate for the full energy band. |
| 68, 69 | FNetCR,e_FNetCR | Net source count rate for the full energy band and associated errors. |
| 70, 71 | SdbNetCR,e_SdbNetCR | Deblended net source count rate for the soft energy band and associated errors. |
| 72, 73 | HdbNetCR,e_HdbNetCR | Deblended net source count rate for the hard energy band and associated errors. |
| 74,75 | FdbNetCR,e_FdbNetCR | Deblended net source count rate for the full energy band and associated errors. |
| 76 | H/S | Band ratio computed from using the NuSTAR hard and soft energy bands. |
| 77 | upH/S | Band ratio upper error. |
| 78 | lowH/S | Band ratio lower error. |
| 79 | gamma | Effective photon index. |
| 80 | upgamma | Effective photon index upper error. |
| 81 | lowgamma | Effective photon index lower error. |
| 82, 83 | SdbFlux,e_SdbFlux | Deblended fluxes in the soft energy band and associated errors. |
| 84, 85 | HdbFlux,e_HdbFlux | Deblended fluxes in the hard energy band and associated errors. |
| 86, 87 | FdbFlux,e_FdbFlux | Deblended fluxes in the full energy band and associated errors. |
| 88 | FLAG_softX_cov | Abbreviated code indicating the lower-energy X-ray coverage with Chandra, XMM-Newton, and/or Swift-XRT. |
| 89 | XOrig | Reference for the adopted lower-energy X-ray (Chandra, XMM-Newton, or Swift-XRT) counterpart. |
| 90, 91 | XRAdeg,XDEdeg | R.A. and decl. of the lower-energy X-ray counterpart. |
| 92 | e_Xdeg | Positional uncertainty of the lower-energy X-ray counterpart (where available, otherwise of the NuSTAR source) used for Nway. |
| 93 | XOff_NuSTAR | Angular separation between the NuSTAR and lower-energy X-ray counterpart positions. |
| 94 | E_SoftX_keV | Reference for the lower-energy X-ray flux used to compute the 3–8 keV fluxes (i.e., XFlux). |
| 95, 96, 97 | XFlux,XFlux_Lerr,XFlux_Uerr | 3–8 keV (CSC2, 4XMM-DR10/s, or 2SXPS) flux of the lower-energy X-ray counterpart, with associated lower and upper errors. |
| 98, 99, 100 | TXFlux,TXFlux_Lerr,TXFlux_Uerr | Total 3−8 keV flux of all (CSC2, 4XMM-DR10/s, or 2SXPS) sources within 30″ of the NuSTAR position, with associated lower and upper errors. |
| 101 | gal_ext_Av | Galactic extinction, Av. |
| 102, 103, 104 | gal_ext_g,gal_ext_r,gal_ext_i | Galactic line-of-sight absorption in the g, r, and i bands. |
| 105, 106 | Pbest_CatWISE,Pany_CatWISE | The Nway best-match probability and probability that any of the CatWISE20 sources is the right counterpart. |
| 107, 108 | RA_CatWISE,DEC_CatWISE | R.A. and decl. of the “best” Nway-identified CatWISE20 counterpart. |
| 109 | IROff_NuSTAR | Angular separation between the Nway-matched WISE counterpart position and the NuSTAR position. |
| 110 | IROff_SoftX | Angular separation between the Nway-matched WISE counterpart position and the adopted lower-energy X-ray counterpart. |
| 111, 112 | W1_CatWISE,e_W1_CatWISE | WISE W1 magnitude (3.4 μm), with associated errors. |
| 113, 114 | W2_CatWISE,e_W2_CatWISE | WISE W2 magnitude (4.6 μm), with associated errors. |
| 115, 116 | RA_AllWISE,DEC_AllWISE | R.A. and decl. of the closest AllWISE counterpart. |
| 117, 118 | W3_AllWISE,e_W3_AllWISE | WISE W3 magnitude (12 μm), with associated errors. |
| 119, 120 | W4_AllWISE,e_W4_AllWISE | WISE W4 magnitude (22 μm), with associated errors. |
| 121, 122 | Pbest_PS1,Pany_PS1 | The Nway best-match probability and probability that any of the PS1-DR2 sources is the right counterpart. |
| 123, 124 | RA_PS1,DEC_PS1 | R.A. and decl. of the “best” Nway-identified PS1-DR2 counterpart. |
| 125 | OOff_PS1_NuSTAR | Angular separation between the Nway-matched PS1-DR2 counterpart position and the NuSTAR position. |
| 126 | OOff_PS1_SoftX | Angular separation between the Nway-matched PS1-DR2 counterpart position and the adopted lower-energy X-ray position. |
| 127 | OOff_PS1_CatWISE | Angular separation between the Nway-matched PS1-DR2 and CatWISE20 counterpart positions. |
| 128, 129 | gmag_PS1,e_gmag_PS1 | g-band magnitude for the Nway-identified PS1-DR2 counterpart, with associated errors. |
| 130, 131 | rmag_PS1,e_rmag_PS1 | r-band magnitude for the Nway-identified PS1-DR2 counterpart, with associated errors. |
| 132, 133 | imag_PS1,e_imag_PS1 | i-band magnitude for the Nway-identified PS1-DR2 counterpart, with associated errors. |
| 134 | mag_type_PS1 | Three letter code indicating the type of PS1 magnitude in each band: “K” (Kron), “P” (PSF), “A” (aperture), or “-” (unavailable). |
| 135 | NWAY_RFlag | A binary flag indicating the Nway reliable sample following pCat/PS,best > 0.4 and pCat/PS,any > 0.5. |
| 136 | OOrig_cpart | Reference for the adopted optical counterpart, in order of preference: PS1-DR2, SDSS, NSC2, DES-DR2, or USNOB1. |
| 137, 138 | ORAdeg_cpart,ODEdeg_cpart | R.A. and decl. of the adopted optical counterpart. |
| 139, 140 | gmag_cpart,e_gmag_cpart | g-band magnitude for the adopted optical counterpart, with associated errors. |
| 141, 142 | rmag_cpart,e_rmag_cpart | r-band magnitude for the adopted optical counterpart, with associated errors. |
| 143, 144 | imag_cpart,e_imag_cpart | i-band magnitude for the adopted optical counterpart, with associated errors. |
| 145 | mag_type_cpart | Three letter code indicating the type of PS1 magnitude in each band (if used for counterpart): “K” (Kron), “P” (PSF), “A” (aperture), or “-” (unavailable). |
| 146 | OOff_NuSTAR | Angular separation between the adopted optical counterpart position and the NuSTAR position. |
| 147 | OOff_SoftX | Angular separation between the adopted optical counterpart position and the best soft X-ray position. |
| 148 | OOff_CatWISE | Angular separation between the adopted optical counterpart position and the best CatWISE20 position. |
| 149 | MainCAT | Flag indicating sources which are included in the unique primary catalog. |
| 150 | SpecCAT | Flag indicating sources which are included in the spectroscopic catalog. |
| 151, 152 | RAdeg_spec,DEdeg_spec | R.A. and decl. of the spectroscopic target. |
| 153 | OOff_Spec_Cpart | Angular separation between the spectroscopic target and the adopted optical counterpart. |
| 154 | zspec | Spectroscopic redshift. |
| 155 | zQuality | Quality flag of the spectroscopic redshift measurement. |
| 156, 157 | Classification,Class_extra | Spectroscopic classification and additional source class information. |
| 158, 159 | NWAY_CatWISE,NWAY_PS1 | A binary flag indicating a Nway CatWISE20/PS1-DR2 match to the spectroscopic target. |
| 160 | Cpart_RFlag | A flag indicating the reliability of the spectroscopic target as the correct counterpart. |
| 161 | SpecRef | Reference for the information used for the spectroscopic target. |
| 162, 163 | gmag_spec,e_gmag_spec | r-band magnitude for the spectroscopic target, with associated errors. |
| 164, 165 | rmag_spec,e_rmag_spec | r-band magnitude for the spectroscopic target, with associated errors. |
| 166, 167 | imag_spec,e_imag_spec | r-band magnitude for the spectroscopic target, with associated errors. |
| 168 | L10_40keV | Non-absorption-corrected, rest-frame 10–40 keV luminosity. |
| 169 | PFlag | A binary flag indicating sources that show evidence for being associated with the primary science targets of their respective NuSTAR observations. |
| 170 | CTFlag | A binary flag indicating Compton-thick candidates. |
Only a portion of this table is shown here to demonstrate its form and content. A machine-readable version of the full table is available.
Download table as: Machine-readable (MRT)Typeset images: 1 2 3
Column 1: The unique source identification number, in order of increasing R.A.
Column 2: The unique NuSTAR source name, following the IAU-approved format: NuSTAR JHHMMSSDDMM.m, where “m” is the truncated fraction of 1′ for the arcseconds component of the decl.
Column 3: The unique NuSTAR field and source index.
Column 4: The unique L17 source identification number.
Column 5: The unique L17 NuSTAR field and source index.
Columns 6, 7: The NuSTAR R.A. and decl. coordinates (J2000), as described in Section 2.3. Units: degrees.
Columns 8, 9: The IAU 1958 Galactic latitude and longitude. Units: degrees.
Columns 10–12: A binary flag indicating whether the source is detected with a false probability lower than the threshold of  = –6, for the soft (3−8 keV), hard (8−24 keV), and full (3−24 keV) bands. These three bands are abbreviated as SB, HB, and FB, respectively, throughout the source catalog.
Columns 13–15: The same as columns 10–12, after deblending has been performed to account for contamination of the source counts from very nearby sources (Section 2.3.2 of Mullaney et al. 2015). Deblending only affects a very small fraction of the overall sample (see, e.g., Section 2.4 in L17).
Columns 16–18: The logarithm of the false probabilities (Pfalse) of the NuSTAR-detected source, for the three standard energy bands.
Columns 19: The NuSTAR detection likelihood ( ).
).
Columns 20–22: The same as columns 16–18, after deblending has been performed.
Columns 23: The same as column 19, after deblending has been performed.
Column 24: A binary flag indicating whether the NuSTAR-detected source remains significant after deblending, in at least one of the three standard energy bands.
Columns 25–39: Photometric quantities, calculated at the NuSTAR source coordinates, and using a source aperture of 30″ radius (see Section 2.2). The values are non-aperture-corrected, i.e., they correspond to the 30″ values, and have not been corrected to the full PSF values. We provide the total counts (i.e., all counts within the source aperture) and associated errors (84% confidence level, CL), the background counts scaled to the source aperture, and the net source counts (i.e., total minus background) and associated errors. For the net source counts, we give 90% CL upper limits for sources not detected in a given band. Throughout the table, upper limits are flagged with a –99 value in the error column.
Columns 40–51: The same as columns 25–39, after deblending has been performed.
Columns 52–54: The average net, vignetting-corrected exposure time at the source coordinates (columns 3 and 4), for each energy band. These correspond to the A + B data, so should be divided by 2 to obtain the average exposure per FPM. Units: seconds.
Columns 55–69: The non-aperture-corrected total, background, and net count rates (and associated errors; 84% CL) determined from the photometric values in columns 25–39, and the exposure times in columns 52–54. Units: s−1.
Columns 70–75: The deblended net count rates and associated errors, determined from the photometric values in columns 40–51, and the exposure times in columns 52–54. Units: s−1.
Columns 76–78: The NuSTAR band ratio (BRNu) and associated errors. Upper limits, lower limits, and sources with no constraints are flagged with −99, −88, and −77 values, respectively, in the error columns.
Columns 79–81: The effective photon index (Γeff ) and associated errors, estimated from the band ratio values in columns 76–78.
Columns 82–87: The observed-frame fluxes and associated errors (84% CL) for the three standard energy bands, after deblending has been performed. These are aperture-corrected values (i.e., they correspond to the full NuSTAR PSF), and are calculated from the count rates in columns 70–75 using the conversion factors listed in L17. Units: erg s−1 cm−2.
Column 88: An abbreviated code indicating the lower-energy (< 10 keV) X-ray coverage. “C,” “X,” and “S” indicate sources which have Chandra, XMM-Newton, and Swift-XRT coverage, respectively.
Column 89: An abbreviated code indicating the origin of the adopted lower-energy X-ray counterpart: CSC2 indicates counterparts from the Chandra Source Catalog Release 2.0 (Evans et al. 2019), 4XMM-DR10 and 4XMM-DR10s indicate the Fourth XMM-Newton Serendipitous Source Catalog, Tenth Data Release (Webb et al. 2020) and its stacked version (Traulsen et al. 2020), and 2SXPS indicates the Swift-XRT Point Source Catalog (Evans et al. 2020), respectively. CXO_MAN, XMM_MAN, and XRT_MAN indicate sources manually identified using archival Chandra, XMM-Newton, and Swift-XRT data, respectively. Sources that lack a soft X-ray counterpart are indicated with the code “NULL”; Section 3.1 details the counterpart matching.
Columns 90, 91: The R.A. and decl. coordinates (J2000) of the adopted lower-energy X-ray counterpart. Sources that lack a lower-energy X-ray counterpart have R.A. and decl. values of (–999, –999). Units: degrees.
Column 92: Positional uncertainty for lower-energy (where available) or NuSTAR coordinates used for Nway matching. Units: degrees.
Column 93: The angular offset between the NuSTAR position (columns 6 and 7) and the lower-energy X-ray counterpart position (columns 90 and 91). Sources lacking a soft X-ray counterpart are flagged with a value of –77. Units: arcseconds.
Column 94: Reference for the lower-energy X-ray flux used to compute the 3−8 keV fluxes in columns 95–97: 2−7 keV, 0.5−7 keV, or 0.1−10 keV for CSC2 fluxes, 4.5−12 keV for 4XMM-DR10/s fluxes, and 2−10 keV for 2SXPS fluxes.
Columns 95–97: The observed-frame 3−8 keV flux of the lower-energy X-ray counterpart (with assocated lower and upper errors) for sources with counterparts in the CSC2, 4XMM-DR10/s, and 2SXPS catalogs. For CSC2 sources, we convert to the 3−8 keV flux from the 2−7 keV flux using a conversion factor of 0.83, for the 4XMM-DR10/s sources we convert from the 4.5−12 keV flux using a conversion factor of 0.92, and for the 2SXPS sources we convert from the 2−10 keV flux using a conversion factor of 0.62. Sources lacking a soft X-ray counterpart have values of 0. Units: erg s−1 cm−2.
Columns 98–100: The total combined 3−8 keV flux of all (CSC2, 4XMM-DR10/s, or 2SXPS) sources within 30″ of the NuSTAR position, with associated lower and upper errors. Sources lacking soft X-ray counterparts have values of 0. Units: erg s−1 cm−2.
Column 101: Galactic extinction, Av, i.e., the total absorption in magnitudes at V.
Columns 102–104: Galactic line-of-sight absorption in g, r, and i magnitudes.
Columns 105, 106: The Nway-calculated probability that each CaTWISE20 (Marocco et al. 2021) source is the correct counterpart to the (adopted lower-energy or NuSTAR) X-ray source (pCat,best for CatWISE20), and the probability that any of the CatWISE20 sources is the right counterpart (pCat,any for CatWISE20; a higher probability indicates a lower false-association likelihood.) Sources lacking a CatWISE20 counterpart are flagged with a value of –77.
Columns 107, 108: The CatWISE20 R.A. and decl. coordinates (J2000) for the most probable Nway-matched WISE counterpart. Sources that lack a CatWISE20 counterpart have R.A. and decl. values of (–999, –999). Units: degrees.
Column 109: The angular offset between the best Nway-matched CatWISE20 position and the NuSTAR position. Sources lacking a CatWISE20 match are flagged with a –77 value. Units: arcseconds.
Column 110: The angular offset between the best Nway-matched CatWISE20 position and the adopted lower-energy X-ray counterpart position. Sources that lack a CatWISE20 counterpart are flagged with values of –77. Units: arcseconds.
Columns 111–114: The CatWISE20 WISE profile-fit magnitudes and associated errors, for the two standard WISE bands available in CatWISE20: W1 (λ ≈ 3.4 μm) and W2 (λ ≈ 4.6 μm). Sources with no constraints are flagged with a –77 value, and upper limits are flagged with a –99 value in the error column. Units: Vega magnitudes.
Columns 115, 116: The AllWISE R.A. and decl. coordinates (J2000) for crossmatches with CatWISE20 coordinates. Sources that lack an AllWISE counterpart have R.A. and decl. values of (–999, –999). Units: degrees.
Columns 117–120: The AllWISE WISE profile-fit magnitudes and associated errors, for the two remaining standard WISE bands: W3 (λ ≈ 12 μm) and W4 (λ ≈ 22 μm). Sources with no constraints are flagged with a −77 value, and upper limits are flagged with a –99 value in the error column. Units: Vega magnitudes.
Columns 121, 122: The Nway-calculated probability that each PS1-DR2 (Flewelling 2018) source is the correct counterpart to the (adopted lower-energy or NuSTAR) X-ray source (ρPS1,best), and the probability that any of the PS1-DR2 sources is the right counterpart (ρPS1,any). A higher probability indicates a lower false-association likelihood. Sources lacking a PS1-DR2 counterpart are flagged with a value of –77.
Columns 123, 124: The PS1-DR2 R.A. and decl. coordinates (J2000) for the best Nway-matched Pan-STARRS counterpart. Sources that lack a PS1-DR2 Nway match have R.A. and decl. values of (–999, –999). Units: degrees.
Column 125: The angular offset between the best Nway-matched PS1-DR2 position and the NuSTAR position. Sources lacking a PS1-DR2 match are flagged with a –77 value. Units: arcseconds.
Column 126: The angular offset between the best Nway-matched PS1-DR2 position and the adopted lower-energy X-ray position. Sources lacking a PS1-DR2 match are flagged with a –77 value. Units: arcseconds.
Column 127: The angular offset between the best Nway-matched PS1-DR2 and CatWISE20 positions. Sources lacking a PS1-DR2/CatWISE20 match are flagged with a –77 value. Units: arcseconds.
Columns 128–134: The g-, r- and i-band magnitudes (with associated errors) of the best Nway-matched PS1-DR2 counterpart. Magnitudes are not corrected for Galactic extinction. All Pan-STARRS magnitudes quoted in the NSS80 catalog are, in order of preference, Kron, PSF, or the default aperture magnitudes, with the selected type for each band indicated in column 132. Sources with unconstrained magnitudes are denoted with –77, and limits with –99 values in the error columns. Units: AB magnitudes.
Column 135: A binary flag indicating the subsample of higher-probability CatWISE20 or PS1-DR2 matches (i.e., Nway reliable sample) with thresholds of pCat/PS1,best > 0.4 and pCat/PS1,any > 0.5. Section 3.2 details the IR/optical counterpart matching using Nway.
Column 136: Reference indicating the origin of the adopted principal optical counterpart to the NuSTAR source. The code “PS1-NWAY” indicates sources with lower-energy X-ray counterparts and successful Nway matches in the PS1-DR2 catalog (Flewelling 2018). The codes “PS1-MAN,” “SDSS,” “NSC2,” “DES2” and “USNOB1” indicate sources with lower-energy X-ray counterparts and successful matches in the PS1-DR2 catalog (where OOff_PS1_CatWISE > 27 and therefore rematched to search for nominally closer PS1 matches), the SDSS photometric catalog DR12 (Alam et al. 2015), the second data release of the NOIRLab Source Catalog (Nidever et al. 2021), the Dark Energy Survey DR2 (Abbott et al. 2016), and the USNOB1 catalog (Monet et al. 2003), respectively. “PS1-CatWISE,” “SDSS-CatWISE,” “NSC2-CatWISE,” “DES2-CatWISE,” and “USNOB1-CatWISE20” indicate the cases where there is no lower-energy X-ray counterpart to the NuSTAR position, but a CatWISE20 AGN candidate is identified within the NuSTAR error circle and successfully matched to the PS1-DR2, SDSS-DR12, NSC2, DES-DR2, or USNOB1 catalog. “PS1-softX,” “SDSS-softX,” “NSC2-softX,” “DES2-softX,” and “USNO1-softX” indicate the cases where there is a lower-energy X-ray counterpart to the NuSTAR position, but no CatWISE20 candidate is identified within the NuSTAR error circle. “NULL” indicates sources that lack an optical identification. We give a detailed description of the procedure used to identify optical counterparts in Section 3.2.
Columns 137, 138: The R.A. and decl. coordinates (J2000) of the adopted optical counterpart, for sources with PS1-DR2, SDSS-DR12, NSC2, DES-DR2, and USNOB1 matches. Sources that lack an identified optical counterpart have R.A. and decl. values of (–999, –999). Units: degrees.
Columns 139–145: The g-, r- and i-band magnitudes (and associated errors) of the adopted optical counterpart. If the counterpart is sourced from PS1-DR2, the selected magnitude type for each band is indicated in column 143. Sources with no constraints are flagged with a –77 value, and limits are flagged with –99, respectively, in the error column. Units: AB magnitudes.
Column 146: The angular offset between the adopted optical position and the NuSTAR position. Sources lacking an optical identification are flagged with a –77 value. Units: arcseconds.
Column 147: The angular offset between the adopted optical position and the adopted lower-energy X-ray position. Sources lacking a PS1-DR2 match are flagged with a –77 value. Units: arcseconds.
Column 148: The angular offset between the adopted optical position and the best Nway-identified CatWISE20 position. Sources lacking a PS1-DR2/CatWISE20 match are flagged with a –77 value. Units: arcseconds.
Column 149: A flag indicating whether the source is in the unique primary catalog, i.e., a single entry for each NuSTAR source with its principal optical counterpart. A value of 1 indicates principal counterpart entries; those that are secondary counterpart candidates are flagged with a value of 0.
Column 150: A flag indicating whether the source is in the main spectroscopic catalog presented in Table 14: a value of 1 indicates the unique source entries for the spectroscopic catalog; a value of –1 flags sources with photometric redshifts; and sources which have not been targeted during our spectroscopic campaign are flagged with a value of 0.
Columns 151, 152: The R.A. and decl. coordinates (J2000) of the spectroscopic target observed during the ground-based follow-up program; see Section 3.3. Untargeted sources have R.A. and decl. values of (–999, –999).Units: degrees.
Column 153: The angular offset between the spectroscopic target position and the adopted optical position. Sources lacking spectroscopic follow-up or an optical identification are flagged with a –77 value. Units: arcseconds.
Column 154: The spectroscopic redshift of the NuSTAR source. The large majority of the redshifts were obtained through our own campaign of ground-based spectroscopic follow-up of NuSTAR serendipitous survey sources (see Section 3.3). Sources which have been followed up but lack redshift measurements due to low-S/N spectra are flagged with –99 values, while unobserved sources have entries of –77.
Column 155: Quality flag of the spectroscopic redshift measurement. Single-line measurements are flagged as “quality B” redshift measurements, photometric redshifts obtained from literature are flagged as “quality C”, and sources with a faint continuum detected (but lack a redshift measurement) are flagged as “quality F.”
Column 156: Spectroscopic classification of the NuSTAR source: BL ≡ broad-line object (i.e., quasar); NL ≡ narrow-line object (AGN or galaxy); Gxy ≡ galaxy (absorption lines); Galactic ≡ Galactic sources at z = 0. See Section 3.3.3.
Column 157: Additional classification information for the duplicate source entries, e.g., AGN pairs (“BL_pair” and “NL_pair”), dual AGN (“Dual_AGN”), galaxy pairs (“Gxy_pair”), and more than one counterpart candidate (“2cpart_candidates”).
Columns 158, 159: Binary flags indicating whether the spectroscopic target position matches to the best Nway-identified counterpart for CatWISE20 and PS1-DR2.
Column 160: A flag indicating the reliability of the spectroscopic target as the correct counterpart: 1 ≡ correct counterpart; 0 ≡ counterpart uncertainty; −1 ≡ unobserved.
Column 161: Reference indicating the catalog origin of the spectroscopic counterpart.
Columns 162–167: The g-, r- and i-band magnitudes (with associated errors) of the spectroscopic target. Magnitudes are not corrected for Galactic extinction. Sources with unconstrained magnitudes are denoted with −77, and limits with –99 values in the error column. Units: AB magnitudes.
Column 168: The rest-frame 10−40 keV luminosity, estimated from the fluxes in columns 82–87. The luminosities are observed values, uncorrected for any absorption along the line of sight. The intrinsic luminosities may therefore be higher, for highly absorbed AGNs. Sources with no constraints are flagged with a –77 value. Units: erg s−1.
Column 169: A binary flag indicating the few sources that show evidence for being associated with the primary science target of their respective NuSTAR observations, according to the definition in Section 3.3.3 (Δ(cz) < 0.05 cz). 1 ≡ associated with primary target; 0 ≡ not associated; –1 ≡ no spectroscopy.
Column 170: A binary flag indicating the NuSTAR sources which are CT candidates (NH ≳ 1.5 × 1024 cm−2). These sources can be (crudely) identified from their extreme band ratios, as demonstrated in Section 4.1.2.
Appendix B: Description of the Secondary NSS80 Source Catalog
The secondary NuSTAR serendipitous survey source catalog contains 214 sources in total, and is available as an electronic table on the NSS80 web page. Here we describe the columns of the catalog, which are summarized in Table 12.
Table 12. Column Descriptions for the Secondary NSS80 Catalog
| Column Number | Description |
|---|---|
| 1 | Unique source identification number (ID). |
| 2 | Unique NuSTAR source name. |
| 3 | Unique NuSTAR field and source ID. |
| 4, 5 | Unique L17 NuSTAR source ID and field; the secondary L17 catalog is appended with an “S.” |
| 6, 7 | R.A. and decl. |
| 8–10 | Flags indicating the energy bands for which the source is detected. |
| 11–13 | Same as columns 10–12, post-deblending. |
| 14–16 | The logarithm of the false probabilities for the three standard NuSTAR energy bands. |
| 17 | The NuSTAR detection likelihood. |
| 18–20 | Same as columns 16–18, post-deblending. |
| 21 | The same as column 19, post-deblending. |
| 22 | Flag indicating whether the source is significant post-deblending, for at least one energy band. |
| 23–37 | Total, background, and net source counts for the three standard energy bands and associated errors. |
| 38–49 | Same as columns 25–39, post-deblending. |
| 50–52 | Net vignetting-corrected exposure times at the source position, for the combined A + B data. |
| 53–67 | Total, background, and net source count rates for the three standard energy bands and associated errors. |
| 68–73 | Deblended net source count rates for the three standard energy bands and associated errors. |
| 74–76 | Band ratio and upper and lower errors. |
| 77–79 | Effective photon index and upper and lower errors. |
| 80–85 | Deblended fluxes in the three standard bands and associated errors. |
| 86, 87 | Flags indicating optical mask and optical source name. |
Only a portion of this table is shown here to demonstrate its form and content. A machine-readable version of the full table is available.
Download table as: Machine-readable (MRT)Typeset image
Appendix C: Comparison to the NSS40 Catalog
Overall, we find a 91% match between the primary NSS80 catalog and NSS40 for a search radius of 25″ (which is the positional accuracy of NuSTAR for faint sources), with 36 primary NSS40 sources reported in L17 undetected in the NSS80. For the majority of these sources the deeper data has improved the false-probability estimates and, consequently, eliminates false detections. This is particularly noticeable for L17 sources with detections in a single energy band only. We summarize potential reasons to explain the undetected L17 sources in Table 13: 32 sources have improved false probabilities, one source lies in an excess background region, and three sources are on the peripheries of coadded fields.
Table 13. A List of the NSS40 Serendipitous Sources Reported in L17 that Are Undetected in the NSS80 Catalog
| ID | NuSTAR Name | Science Target Name | R.A. | Decl. | Type | zspec | Explanation |
|---|---|---|---|---|---|---|---|
| (deg) | (deg) | ||||||
| (1) | (2) | (3) | (4) | (5) | (6) | (7) | (8) |
| 2 | NuSTARJ001130+0057.8 | SDSSJ001111d97p005626d3 | 2.88 | 0.96 | BL | 1.492 | Pfalse condition not met in NSS80 reductions. |
| 5 | NuSTARJ001717+8127.3 | S50014p81 | 4.32 | 81.46 | ⋯ | ⋯ | Undetected in HB+FB; logSdbP ≈ −6. |
| 9 | NuSTARJ001953+5911.8 | IC10_X1 | 4.97 | 59.2 | ⋯ | ⋯ | Pfalse condition not met in NSS80 reductions. |
| 78 | NuSTARJ040730+0344.2 | 3C105 | 61.88 | 3.74 | ⋯ | ⋯ | Undetected in SB+FB; logHdbP ≈ −6. |
| 79 | NuSTARJ042349+0410.9 | 2MASXJ04234080p0408017 | 65.96 | 4.18 | ⋯ | ⋯ | Pfalse condition not met in NSS80 reductions. |
| 81 | NuSTARJ042509−5709.5 | 1H_0419m577 | 66.29 | −57.16 | ⋯ | ⋯ | Undetected in SB+HB; logFdbP ≈ −6. |
| 89 | NuSTARJ043724−4722.2 | PSRJ0437m4715 | 69.35 | −47.37 | ⋯ | ⋯ | Undetected in SB+HB; logFdbP ≈ −6. |
| 99 | NuSTARJ052100−2528.8 | IRAS05189m2524 | 80.25 | −25.48 | BL | 1.666 | Possible false detection on the edge of an exposure. |
| 121 | NuSTARJ065922−5558.6 | Bullet_Bullet_shock | 104.84 | −55.98 | ⋯ | ⋯ | Undetected in SB+HB; logFdbP ≈ −6. |
| 179 | NuSTARJ095440+6942.6 | SN2014J | 148.67 | 69.71 | ⋯ | ⋯ | Undetected in SB+HB; logFdbP ≈ −6. |
| 192 | NuSTARJ095801+6859.4 | M81_X9 | 149.51 | 68.99 | ⋯ | ⋯ | Undetected in SB+HB; logFdbP ≈ −6. |
| 193 | NuSTARJ095806+6910.3 | M81_X9 | 149.53 | 69.17 | ⋯ | ⋯ | Undetected in HB+FB; logSdbP ≈ −6. |
| 196 | NuSTARJ095853+6901.3 | M81_X9 | 149.72 | 69.02 | ⋯ | ⋯ | Undetected in SB+HB; logFdbP ≈ −6. |
| 211 | NuSTARJ102318+0036.5 | PSRJ1023p0038 | 155.83 | 0.61 | Gal | 0.0 | Undetected in SB+HB; logFdbP ≈ −6. |
| 212 | NuSTARJ102328+0043.9 | PSRJ1023p0038 | 155.87 | 0.73 | ⋯ | ⋯ | Undetected in SB+HB; logFdbP ≈ −6. |
| 219 | NuSTARJ102802−4351.0 | NGC3256 | 157.01 | −43.85 | BL | 1.784 | Pfalse condition not met in NSS80 reductions. |
| 227 | NuSTARJ105931+2429.8 | IRAS_10565p2448 | 164.88 | 24.5 | BL | 0.908 | Pfalse condition not met in NSS80 reductions. |
| 233 | NuSTARJ110632+7225.9 | NGC3516 | 166.64 | 72.43 | ⋯ | ⋯ | Undetected in SB+FB; logHdbP ≈ −6. |
| 236 | NuSTARJ110752+7230.7 | NGC3516 | 166.97 | 72.51 | BL | 0.901 | Undetected in SB+HB; logFdbP ≈ −6. |
| 256 | NuSTARJ120242+4437.2 | NGC4051 | 180.68 | 44.62 | NL? | 0.296 | Possible false detection on the edge of an exposure. |
| 261 | NuSTARJ120613+4957.2 | 2MASXJ12055599p4959561 | 181.56 | 49.95 | BL | 0.784 | Undetected in SB; logFdbP ≈ −6. |
| 302 | NuSTARJ125657+5644.6 | Mrk231 | 194.24 | 56.74 | NL | 2.073 | Undetected in SB+HB; logFdbP ≈ −6. |
| 303 | NuSTARJ130108−6356.2 | 2RXPJ130159d6m635806 | 195.28 | −63.94 | ⋯ | ⋯ | Undetected in SB+FB; logHdbP ≈ −6. |
| 313 | NuSTARJ133311−3406.8 | ESO383_18 | 203.3 | −34.11 | NL? | 0.091 | Possible false detection on the edge of an exposure. |
| 330 | NuSTARJ141215−6519.6 | Circinus_XMM2 | 213.07 | −65.33 | ⋯ | ⋯ | Undetected in SB+HB; logFdbP ≈ −6. |
| 375 | NuSTARJ165346+3953.7 | Mkn501 | 253.44 | 39.9 | NL | 0.354 | Undetected in SB+FB; logHdbP ≈ −6. |
| 376 | NuSTARJ165351+3938.5 | Mkn501 | 253.46 | 39.64 | Gal | 0.0 | Undetected in SB+HB; logFdbP ≈ −6. |
| 384 | NuSTARJ171718−6239.1 | NGC6300 | 259.33 | −62.65 | ⋯ | ⋯ | Undetected in SB+HB; logFdbP ≈ −6. |
| 389 | NuSTARJ172755−1417.4 | PDS_456 | 261.98 | −14.29 | ⋯ | ⋯ | Undetected in HB+FB; logSdbP ≈ −6. |
| 390 | NuSTARJ172803−1423.0 | PDS_456 | 262.02 | −14.38 | BL | 1.555 | Contaminated by stray light. |
| 395 | NuSTARJ172843−1419.0 | PDS_456 | 262.18 | −14.32 | ⋯ | ⋯ | Undetected in HB+FB; logSdbP ≈ −6. |
| 407 | NuSTARJ182447−2444.5 | PSR_B1821m24 | 276.2 | −24.74 | ⋯ | ⋯ | Pfalse condition not met in NSS80 reductions. |
| 414 | NuSTARJ183422−0840.6 | HESSJ1834m087_TeV | 278.59 | −8.68 | ⋯ | ⋯ | Pfalse condition not met in NSS80 reductions. |
| 413 | NuSTARJ183422−0841.4 | HESSJ1834m087_TeV | 278.59 | −8.69 | ⋯ | ⋯ | Pfalse condition not met in NSS80 reductions. |
| 485 | NuSTARJ224302+2942.1 | Ark_564 | 340.76 | 29.7 | ⋯ | ⋯ | Undetected in SB+FB; logHdbP ≈ −6. |
| 491 | NuSTARJ231811−4228.8 | NGC7582 | 349.55 | −42.48 | ⋯ | ⋯ | Undetected in SB+HB; logFdbP ≈ −6. |
Notes. Columns: (1): unique source identification number in L17. (2): unique NuSTAR source name in L17. (3): object name for the primary science target of the NuSTAR observation in L17. (4): R.A. as recorded in L17. (5): decl. as recorded in L17. (6): spectroscopic classification of the optical counterpart. (7): spectroscopic redshift. (8): explanation for nondetection of the NSS40 serendipitous source in the NSS80 catalog.
Download table as: ASCIITypeset image
Appendix D: Comparison of CatWISE20 Counterparts to Spectroscopic Targets
Our assessment of the reliability of the followed-up spectroscopic sources takes into account the positional offset between the best CatWISE20 counterpart and the spectroscopic counterpart in combination with the CatWISE20 probability. In Figure D1, we plot the offset between the best CatWISE20 counterpart and the followed-up spectroscopic target as a function of the Nway best-match probability, color coded by the different spectral classifications. Each spectroscopic class is further divided into NSS80 sources with lower-energy X-ray (solid symbols) and without lower-energy X-ray (white filled, color-edged symbols) counterparts. Overall, there is a good match to Nway for the majority of the spectroscopically classified sources, indicating that the correct spectroscopic counterpart has been identified: the positional offset for the majority of the sources is < 5 ″; we consider 5″ as a reasonable threshold since it broadly corresponds to the CatWISE20 positional uncertainty. The reliability of the targets with larger positional offsets is less certain. The Nway probability for the best CatWISE20 counterpart is strongly dependent on the availability of a lower-energy X-ray counterpart. For example, the dual AGN system in the NSS80 catalog (NuSTARJ054231+6054.4; open, purple-edged star) is the correct counterpart based on its AGN-like WISE colors, but it has a low Nway probability due to the lack of lower-energy X-ray information (Swift-XRT coverage, but undetected). Most of the large-offset NSS80 sources without lower-energy X-ray counterparts have low-to-intermediate Nway probabilities, and sensitive lower-energy X-ray observations are required to improve the counterpart identification. By comparison, most of the large-offset NSS80 sources with lower-energy X-ray counterparts have high Nway probabilities, but Nway has selected a different source as the best match, typically a brighter lower-energy X-ray counterpart to that spectroscopically followed up (see, e.g., Figure 20). To better determine the reliability between the best CatWISE20 counterpart and the followed-up counterpart of these more uncertain sources requires further investigation including, for example, spectroscopic follow-up of the best CatWISE20 counterpart.
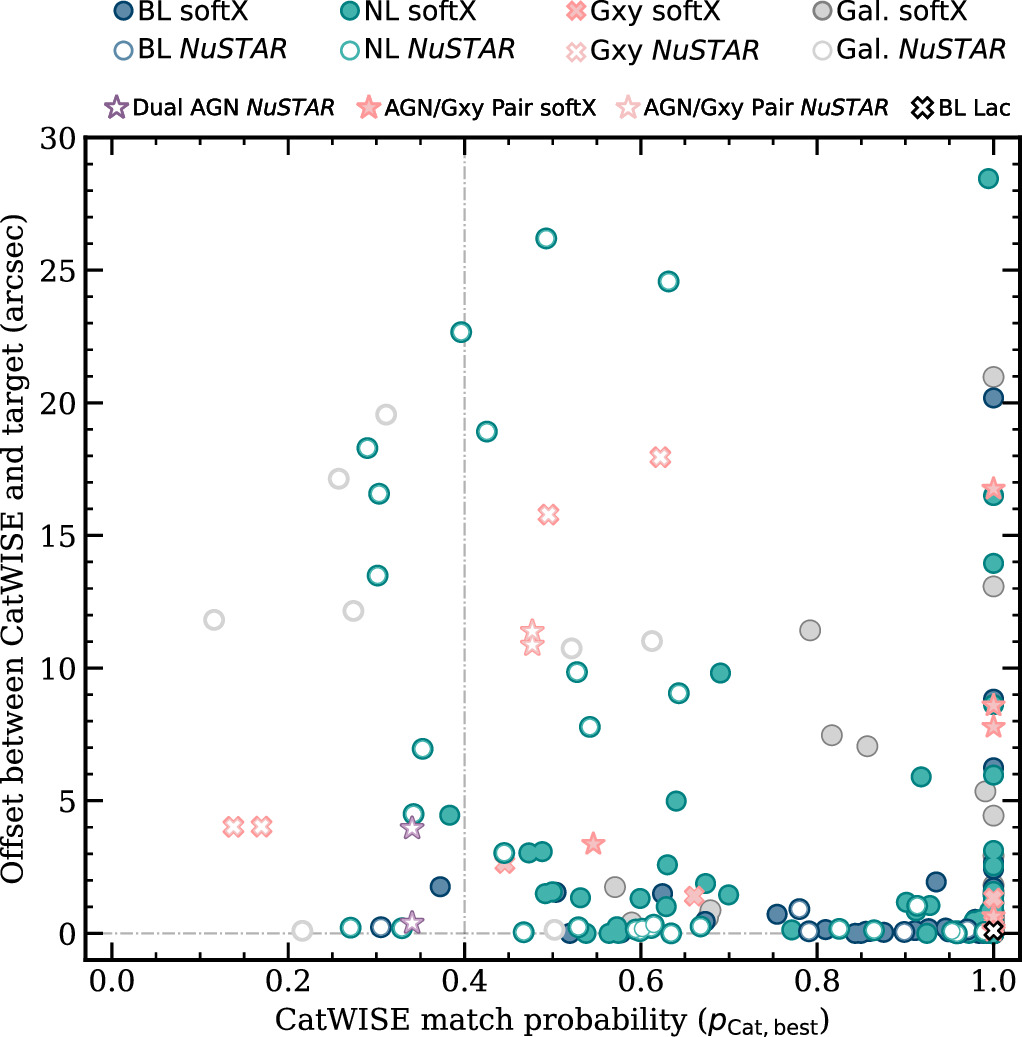
Figure D1. Separation in arcseconds between the Nway-identified CatWISE20 counterpart and the spectroscopic target vs. the best CatWISE20 match probability, color coded by spectral classifications: BL (blue circle), NL (green circle), galaxy (Gxy; peach “×”), Galactic sources (gray circle), AGN-Gxy pairs (peach star), dual AGN (purple star), and a BL Lac candidate (white, black-edged “×”). Solid symbols indicate NSS80 sources with lower-energy (i.e., soft) X-ray counterparts and white filled symbols mark NSS80 sources which lack lower-energy X-ray counterparts and, therefore, have a lower match probability given the large uncertainty in the NuSTAR position (i.e., ∼25″). The vertical black dashed–dotted line indicates the probability cut we applied in Section 3.2 to obtain reliable counterpart associations to the X-ray source.
Download figure:
Standard image High-resolution imageAppendix E: Optical Spectroscopic Properties of Individual post-NSS40 Objects
E.1. Optical Spectroscopic Properties of Individual post-NSS40 Objects
Here we provide details of the optical spectroscopic properties of individual sources from the NuSTAR serendipitous survey. As described in Section 3.3.1, these largely result from our dedicated follow-up campaign using the Keck, Palomar, VLT, and SALT facilities, and also from existing publicly available spectroscopy (primarily SDSS spectroscopy).
Details for individual sources are tabulated in Table 14, the columns of which are as follows:
- (1)Unique NuSTAR source identification number, in order of increasing R.A.
- (2)Unique NuSTAR source name as listed in source catalog.
- (3)The unique observing run identification number, as defined in Table 6 (“S” and “Lit” mark spectra obtained from the SDSS and from elsewhere in the literature, respectively).
- (4)Source redshift (mainly from spectroscopic data).
- (5)Source classification as described in Section 3.3.3 (sources with photometric redshift measurements are appended with a “C” symbol and sources with a level of ambiguity in the optical classification are appended with a ”?” symbol).
- (6)Quality flag of spectroscopic redshift. Single-line measurements are annotated with “B” and photometric redshift measurements with “C”; “F” annotates sources which lack a reliable redshift measurement (usually faint, red continuum spectra).
- (7)Nway association flag: 0 = mismatch between spectroscopic target and Nway source; 1 = match between spectroscopic target and Nway source; –99 = secondary post-NSS40 objects.
- (8)A binary flag indicating sources that show evidence for being associated with the primary science target of their respective NuSTAR observations, according to the definition Δ(cz) < 0.05 cz.
- (9)An abbreviated flag indicating a Nway CatWISE20 (“C”) and/or PS1-DR2 (“P”) counterpart match to the spectroscopic target.
- (10)Notes based on our visual assessment of the spectra.
Table 14. Summary of the Optical Spectroscopy for the post-NSS40 Serendipitous Survey Sources
| ID | NuSTAR Name | Run | z | Type | Quality | PFlag | Nway | FCpart | Notes |
|---|---|---|---|---|---|---|---|---|---|
| (1) | (2) | (3) | (4) | (5) | (6) | (7) | (8) | (9) | |
| 2 | NuSTARJ000303+7017.7 | 24 | 0 | Galactic | ... | 0 | C+P | 2 | Possibly incorrect counterpart due to high source density. |
| 3 | NuSTARJ000333+7013.7 | 20 | 0.391 | NL | ... | 0 | C+P | 1 | ... |
| 4 | NuSTARJ000423+7017.2 | 20 | 0.775 | BL | ... | 0 | C+P | 1 | ... |
| 5 | NuSTARJ000549+2013.0 | S | 1.974 | BL | ... | 0 | C+P | 1 | Mg ii BALQSO. |
| 6 | NuSTARJ000613+2018.3 | 23 | ... | ... | F | 0 | C+P | 1 | Continuum detected. |
| 10 | NuSTARJ001443+8131.9 | 24 | 0.365 | BL | ... | 0 | C+P | 1 | ... |
| 15 | NuSTARJ001952–7057.0 | 25 | 0.813 | BL | ... | 0 | C | 1 | ... |
| 17 | NuSTARJ002046–7057.6 | 30 | 0.271 | NL | ... | 0 | C | 1 | ... |
| 19 | NuSTARJ002112+5542.5 | 7 | 0.409 | BL | ... | 0 | C+P | 1 | ... |
| 20 | NuSTARJ002113–7053.5 | 28 | 0 | Galactic | ... | 0 | ... | 2 | Counterpart uncertainty; two potential candidates within XMM error circle. |
| 27 | NuSTARJ004220–1254.0 | 7 | 0.803 | NL | ... | 0 | C+P | 1 | ... |
| 28 | NuSTARJ004230–1255.3 | 1 | 0.521 | BL | ... | 0 | C+P | 1 | ... |
| 31 | NuSTARJ005219+1725.3 | 22 | 0.102 | NL | ... | 0 | C+P | 1 | [O iii] affected by chip gap. |
| 40 | NuSTARJ005538+4613.1 | 23 | 0 | Galactic | ... | 0 | C+P | 1 | ... |
| 41 | NuSTARJ005543+4605.6 | 23 | 0.452 | NL | ... | 0 | C+P | 1 | ... |
| 42 | NuSTARJ005730–2220.5 | 28 | ... | ... | F | 0 | C | 1 | Low S/N spectrum; potentially Hα at z = 0.195. |
| 43 | NuSTARJ005748–2218.8 | 27 | 1.260 | BL | B | 0 | C+P | 1 | ... |
| 45 | NuSTARJ010710–1732.4 | 32 | 0.369 | NL | ... | 0 | C+P | 1 | ... |
| 46 | NuSTARJ010718–1130.9 | 13 | 1.146 | BL? | B | 0 | C | 1 | Extremely faint; potential Mg ii detected. |
| 48 | NuSTARJ010736–1732.3 | L | 0.0217 | NL | ... | 1 | C+P | 1 | Emission-line galaxy (da Costa et al. 1998) associated with the NuSTAR science target (Strauss et al. 1992; Arp 1966 IC 1623). |
| 49 | NuSTARJ010739–1139.1 | 5 | 0.048 | NL | ... | 0 | C+P | 1 | UKST/6dF spectrum also available (Jones et al. 2009); reported in Swift-BAT BASS DR2 (Koss et al. 2022). |
| 56 | NuSTARJ011429–3241.9 | 27 | 0.693 | NL | ... | 0 | C | 1 | ... |
| 60 | NuSTARJ012227+0056.2 | S | 1.698 | BL | ... | 0 | C+P | 1 | ... |
| 62 | NuSTARJ012618+2559.2 | 16 | 0.410 | BL | ... | 0 | C+P | 1 | ... |
| 63 | NuSTARJ012633+2556.2 | S | 0.427 | BL | ... | 0 | C+P | 1 | ... |
| 64 | NuSTARJ012642+2554.9 | 18 | 0.208 | NL | ... | 0 | C+P | 1 | ... |
| 68 | NuSTARJ012947–6036.9 | 28 | ... | ... | F | 0 | C | 2 | Counterpart uncertainty due to deficient soft X-ray information; continuum detected. |
| 69 | NuSTARJ013003–4600.4 | 29 | 0.159 | NL | ... | 0 | C | 1 | Hα lost to A-band telluric feature. |
| 72 | NuSTARJ013859+2920.0 | 7 | 0 | Galactic | ... | 0 | ... | 2 | Counterpart uncertainty; target is bright in W3. |
| 73 | NuSTARJ014316+1337.7 | 1 | 0.844 | NL | ... | 0 | C+P | 1 | ... |
| 74 | NuSTARJ014333+1342.2 | 13 | 0.343 | Gxy | ... | 0 | P | 1 | Possibly an obscured AGN in an early-type galaxy; weak Hα detection. |
| 75 | NuSTARJ014904+2143.5 | 5 | 0.614 | NL | ... | 0 | C+P | 1 | ... |
| 78 | NuSTARJ015548+0227.2 | 22 | 0.481 | BL | ... | 0 | C+P | 1 | ... |
| 79 | NuSTARJ020344+1137.3 | 5 | 0.167 | NL | ... | 0 | C | 2 | Counterpart uncertainty due to deficient soft X-ray information; Hα affected by A-band telluric feature. |
| 82 | NuSTARJ020601–0011.7 | S | 1.337 | BL | ... | 0 | C+P | 1 | Strong [O ii] emission line. |
| 83 | NuSTARJ020614+6449.3 | 24 | ... | ... | F | 0 | C+P | 2 | Possibly two sources contributing to NuSTAR detection; continuum detected for both targets. |
| 84 | NuSTARJ020622–0023.5 | 23 | 2.793 | NL | B | 0 | C+P | 1 | Tentative Lyα and C iii] emission lines detected. |
| 87 | NuSTARJ021435–0042.7 | S | 0.437 | BL | ... | 0 | C+P | 1 | ... |
| 88 | NuSTARJ021449–0045.2 | 7 | 0.940 | NL | ... | 0 | C | 1 | Oxygen lines offset from a continuum source. |
| 89 | NuSTARJ021454–6425.9 | 30 | 0.068 | Gxy/pair | ... | 1 | ... | 2 | Galaxy companion at z = 0.075 which is associated with the NuSTAR science target (RBS 0295; Schwope et al. 2000); Hα affected by chip gap. |
| 90 | NuSTARJ021810+4236.0 | 12 | 0.967 | BL | ... | 0 | C+P | 1 | ... |
| 91 | NuSTARJ021902+7348.5 | 20 | 0 | Galactic | ... | 0 | C+P | 1 | Unusual WISE (bright in W3) optical colors for Galactic source. |
| 92 | NuSTARJ021934–0508.8 | S | 1.324 | BL | ... | 0 | C+P | 2 | Counterpart uncertainty; the nominally closer (but fainter) CXO source is a SDSS BL at z = 2.305. |
| 93 | NuSTARJ022023–0403.2 | 20 | 3.190 | BL | ... | 0 | C+P | 1 | C iv affected by telluric feature. |
| 94 | NuSTARJ022032–0403.3 | S | 0.822 | BL | ... | 0 | C+P | 1 | ... |
| 95 | NuSTARJ022222+2505.9 | 20 | 0.342 | NL | ... | 0 | C | 1 | ... |
| 97 | NuSTARJ022742+3331.5 | 20 | 0.090 | NL/pair | ... | 0 | C+P | 1 | Borderline AGN from BPT diagnostics; NL companion (star-forming from BPT) north of NuSTAR position at the same redshift. |
| 99 | NuSTARJ022746+3334.6 | 23 | 0.387 | BL | ... | 0 | C+P | 1 | ... |
| 101 | NuSTARJ022943–0857.8 | 24 | 1.182 | BL | B | 0 | C+P | 1 | ... |
| 102 | NuSTARJ022951–0856.4 | 24 | 0.300 | NL | ... | 0 | C+P | 1 | ... |
| 104 | NuSTARJ023013–0853.2 | 24 | 0.180 | NL | ... | 0 | ... | 2 | Counterpart uncertainty based on XMM position and WISE AGN candidate; target is an emission-line galaxy. |
| 105 | NuSTARJ023023–0857.7 | 22 | 0.449 | NL | ... | 0 | C+P | 1 | ... |
| 106 | NuSTARJ023030–0856.9 | 24 | 0.631 | BL | ... | 0 | C+P | 1 | ... |
| 110 | NuSTARJ024111+0711.1 | 28 | 2.983 | BL | ... | 0 | C | 1 | C iii] affected by A-band telluric feature. |
| 111 | NuSTARJ024143+0708.4 | 30 | 0.403 | NL | ... | 0 | C+P | 1 | [O iii] affected by chip gap. |
| 112 | NuSTARJ024144+0512.3 | 22 | 0.070 | NL | ... | 1 | C+P | 1 | 2MASX J02414414+0512203 (Bilicki et al. 1996); associated with the NuSTAR science target (2MASX J02420381+0510061; Gu et al. 1997). |
| 113 | NuSTARJ024213+0516.1 | 23 | 0.441 | NL | ... | 0 | C+P | 1 | Narrow Mg ii. |
| 114 | NuSTARJ024213–0001.5 | S | 0.687 | BL | ... | 0 | C+P | 1 | ... |
| 116 | NuSTARJ024243–0006.4 | 23 | 0 | Galactic | ... | 0 | C+P | 1 | ... |
| 117 | NuSTARJ024254–0004.6 | S | 1.850 | BL | B | 0 | C+P | 1 | ... |
| 119 | NuSTARJ024304+0000.1 | S | 1.995 | BL | ... | 0 | C+P | 1 | C iv BALQSO; C iii] affected by telluric feature. |
| 125 | NuSTARJ025932+3642.3 | 13 | ... | ... | F | 0 | C | 1 | Continuum detected. |
| 126 | NuSTARJ030008+4415.0 | 8 | 0 | Galactic | ... | 0 | C+P | 2 | Counterpart uncertainty; difficult to assess due to deficient soft X-ray information. |
| 131 | NuSTARJ031015–7651.5 | L | 1.187 | BL | ... | 0 | C | 1 | (Figure 1 of Fiore et al. 2000). |
| 147 | NuSTARJ032419+3413.8 | 24 | ... | ... | F | 0 | ... | 2 | Nway disagreement; faint red continuum source next to bright star. |
| 149 | NuSTARJ032439+3415.1 | 24 | 1.412 | BL | ... | 0 | C+P | 1 | ... |
| 156 | NuSTARJ033331–0506.9 | 31 | 0.458 | BL | ... | 0 | C+P | 1 | Hβ affected by chip gap. |
| 160 | NuSTARJ033835+0110.4 | 19 | 0.171 | NL | ... | 0 | C | 1 | Hα affected by A-band telluric feature. |
| 170 | NuSTARJ035542–6252.8 | 26 | 0.408 | NL | ... | 0 | C | 1 | ... |
| 175 | NuSTARJ035902–3011.7 | 25 | 0.093 | NL | ... | 1 | C | 1 | Associated with the NuSTAR science target (SARS 059.33488–30.34397; Katgert et al. 1998). |
| 177 | NuSTARJ035918–3009.6 | 26 | 0.549 | NL? | ... | 0 | C | 1 | Low S/N spectrum; Hβ + [O iii] affected by A-band telluric feature. |
| 178 | NuSTARJ035951–3009.9 | 28 | 0.685 | NL | ... | 0 | ... | 2 | Counterpart uncertainty due to deficient soft X-ray information; [O iii] affected by telluric feature. |
| 179 | NuSTARJ040702+0346.8 | 24 | 0.088 | NL | B | 1 | C | 1 | Associated with the NuSTAR science target (3C 105 Nilsson 1998). |
| 183 | NuSTARJ041426+2805.9 | 24 | 0 | Galactic | ... | 0 | C+P | 2 | Known T-Tauri star (Luhman et al. 2010); the brighter companion is also a known T-Tauri star; counterpart uncertainty. |
| 184 | NuSTARJ041656+0058.0 | 7 | 0.438 | NL | ... | 0 | C+P | 1 | ... |
| 194 | NuSTARJ042914–2110.2 | 27 | 0.818 | BL | ... | 0 | C+P | 1 | ... |
| 206 | NuSTARJ044901+1123.2 | 2 | 0.872 | NL | ... | 0 | C+P | 1 | Type-2 quasar. |
| 212 | NuSTARJ045348+0408.6 | 2 | 1.357 | NL | ... | 0 | C | 1 | Likely Type-2 quasar. |
| 213 | NuSTARJ050449–1016.6 | 19 | 0.342 | BL | ... | 0 | C+P | 1 | ... |
| 214 | NuSTARJ050501–1010.4 | 19 | 0 | Galactic | B | 0 | ... | 2 | Counterpart uncertainty due to deficient soft X-ray information. |
| 218 | NuSTARJ050559–2349.9 | 2 | 0.137 | NL | ... | 1 | ... | 2 | Counterpart uncertainty; NL at z = 0.036 is associated with the NuSTAR science target (LEDA178130; Jones et al. 2004, 2009; Lansbury et al. 2017b). |
| 222 | NuSTARJ050919+0544.1 | 20 | 1.492 | BL | ... | 0 | C+P | 1 | ... |
| 227 | NuSTARJ050941+0541.7 | 20 | 0.796 | BL | ... | 0 | C+P | 1 | ... |
| 232 | NuSTARJ051926–4546.0 | 26 | 0 | Galactic | B | 0 | C | 1 | Continuum detected. |
| 233 | NuSTARJ051926–3242.8 | 25 | 0.915 | BL | ... | 0 | C | 1 | ... |
| 234 | NuSTARJ051935–3235.9 | 26 | 0 | Galactic | ... | 0 | ... | 2 | Counterpart uncertainty. |
| 235 | NuSTARJ051937–3233.3 | 25 | 0.640 | BL | ... | 0 | C | 1 | ... |
| 236 | NuSTARJ051945–3235.2 | 25 | 1.174 | BL | ... | 0 | C | 1 | ... |
| 237 | NuSTARJ052056–2524.1 | 25 | 0.111 | NL | ... | 0 | C+P | 1 | ... |
| 241 | NuSTARJ052116–2514.1 | 30 | ... | ... | F | 0 | C+P | 1 | Continuum detected with red configuration. |
| 243 | NuSTARJ052438–2341.7 | 27 | 0.322 | Gxy | ... | 0 | ... | 2 | Counterpart uncertainty due to deficient soft X-ray information; require deeper optical/IR imaging. |
| 245 | NuSTARJ052613–2118.7 | 31 | 0.214 | NL | ... | 0 | C+P | 1 | Hβ and Hα affected by chip gaps. |
| 249 | NuSTARJ053120+2132.9 | 24 | 0.379 | NL? | ... | 0 | ... | 2 | Faint, red Type-2 AGN (no blue extraction); Counterpart uncertainty due to deficient soft X-ray information. |
| 261 | NuSTARJ053823+2225.7 | 24 | 0.153 | NL? | ... | 0 | C | 1 | Targeted W3-detected WISE source; deficient soft X-ray information; Hα affected by A-band telluric feature. |
| 264 | NuSTARJ054231+6054.4 | 20 | 0.257 | NL/Dual | ... | 0 | C+P | 1 | Dual AGN; pair of merging, obscured AGNs. |
| 267 | NuSTARJ054349–5536.7 | 29 | 0.272 | BL | ... | 1 | C | 1 | Associated with the NuSTAR science target (2FGL J0543.9–5532; Chang et al. 2019). |
| 281 | NuSTARJ061820+2234.2 | 24 | 0.776 | BL | ... | 0 | C+P | 1 | ... |
| 295 | NuSTARJ063325+0549.3 | 20 | 0.347 | NL | ... | 0 | C+P | 1 | ... |
| 304 | NuSTARJ064331+5530.4 | 24 | 0.167 | NL? | ... | 0 | P | 1 | Hα affected by A-band telluric feature. |
| 335 | NuSTARJ073530–6936.7 | 31 | 1.055 | BL? | B | 0 | C | 1 | Low S/N spectrum; C II] + Mg ii affected by chip gaps. |
| 337 | NuSTARJ073651–6935.9 | 30 | 0 | Galactic | ... | 0 | ... | 2 | Counterpart uncertainty due to deficient soft X-ray information. |
| 343 | NuSTARJ074113–5442.6 | 26 | 0 | Galactic | ... | 0 | C | 1 | ... |
| 345 | NuSTARJ074317+6509.5 | 24 | 0.760 | BL | ... | 0 | C | 1 | ... |
| 360 | NuSTARJ081003–7527.2 | 30 | ... | BL Lac? | F | 0 | C | 1 | Continuum detected; bright X-ray source with featureless power-law spectrum. |
| 363 | NuSTARJ081323+2541.1 | 9 | 0.899 | BL | ... | 0 | C+P | 1 | Also observed in SDSS-DR16 but with lower S/N; WISEA J081322.80+254119.0. |
| 382 | NuSTARJ084149+0101.0 | 20 | 0.560 | NL | ... | 0 | C+P | 1 | Hβ affected by A-band telluric line. |
| 384 | NuSTARJ084337+3555.1 | 3 | 0.699 | NL | ... | 0 | C+P | 1 | ... |
| 385 | NuSTARJ084407+3552.8 | S | 0.467 | BL | ... | 0 | C | 1 | ... |
| 387 | NuSTARJ084725–2337.5 | 26 | 0.216 | BL | ... | 0 | C+P | 1 | ... |
| 390 | NuSTARJ085429+6424.3 | 9 | 0.806 | Gxy | ... | 0 | P | 2 | Counterpart uncertainty due to deficient soft X-ray information; likely spurious NuSTAR detection. |
| 395 | NuSTARJ090529+6930.1 | 20 | 0.418 | NL | ... | 0 | C+P | 1 | ... |
| 396 | NuSTARJ090602+6933.1 | 20 | 0.777 | BL | ... | 0 | C+P | 1 | ... |
| 404 | NuSTARJ091519+2931.9 | S | 1.099 | BL | ... | 0 | ... | 2 | Counterpart uncertainty; the fainter WISE-XMM source is a SDSS BL at z = 1.099 Richards et al. (2009). |
| 405 | NuSTARJ091534+4054.6 | S | 1.298 | BL/pair | ... | 0 | C+P | 1 | BL AGN pair; SDSS quasar companion at same redshift matches to Nway. |
| 408 | NuSTARJ091912+5527.8 | S | 0.049 | NL | ... | 0 | C+P | 1 | Possibly Sy2 (Véron-Cetty & Véron 2006; Ahn et al. 2012). |
| 418 | NuSTARJ094133+3441.5 | S | 1.779 | BL | ... | 0 | C+P | 1 | ... |
| 422 | NuSTARJ094847+0023.6 | 9 | 0.262 | BL | ... | 0 | C+P | 1 | ... |
| 423 | NuSTARJ094907+0026.2 | S | 2.461 | BL | ... | 0 | C+P | 1 | ... |
| 424 | NuSTARJ094910+0022.9 | 14 | 0.093 | NL | ... | 0 | C+P | 1 | Nearby extended source is an emission-line galaxy at z = 0.11; possibly both sources contributing to NuSTAR detection. |
| 441 | NuSTARJ095709+2511.6 | S | 0.902 | BL | ... | 0 | C | 1 | ... |
| 457 | NuSTARJ100620–3350.1 | 27 | 0 | Galactic | ... | 0 | C | 1 | ... |
| 458 | NuSTARJ100642–3355.1 | 27 | 0.069 | NL | ... | 0 | C | 2 | Counterpart uncertainty; WISE AGN candidate on edge of CXO error circle. |
| 459 | NuSTARJ100648+6535.4 | 3 | 0.983 | BL | ... | 0 | C+P | 1 | Mg ii affected by chip gap. |
| 460 | NuSTARJ100700+6530.1 | 3 | 0.117 | NL | ... | 0 | ... | 2 | Emission-line galaxy; counterpart uncertainty. |
| 474 | NuSTARJ102313+1956.7 | S | 1.087 | BL | ... | 0 | C+P | 1 | ... |
| 489 | NuSTARJ103135–4206.0 | L | 0.0615 | NL | ... | 0 | C | 1 | Paturel et al. (2005). |
| 492 | NuSTARJ103456+3939.6 | S | 0.151 | NL | ... | 0 | C+P | 1 | Ahn et al. (2012). |
| 493 | NuSTARJ103514+3939.0 | S | 0.107 | NL | ... | 0 | C+P | 1 | Abazajian et al. (2009). |
| 501 | NuSTARJ104950+2301.6 | S | 0.143 | BL | ... | 0 | C+P | 1 | ... |
| 503 | NuSTARJ110021+6458.4 | S | 0.882 | BL | ... | 0 | C+P | 1 | ... |
| 505 | NuSTARJ110333–2333.8 | 26 | 1.372 | BL | B | 0 | C+P | 1 | ... |
| 506 | NuSTARJ110349–2326.2 | 26 | 0.173 | NL | ... | 0 | C | 1 | Hα affected by A-band telluric feature. |
| 507 | NuSTARJ110354–2324.8 | 28 | ... | ... | F | 0 | C+P | 1 | Continuum detected. |
| 510 | NuSTARJ110415–2328.6 | 26 | 0 | Galactic | ... | 0 | C+P | 1 | ... |
| 513 | NuSTARJ110526+7238.1 | L | 1.399 | BL | ... | 0 | C+P | 1 | Chu et al. (1998) |
| 528 | NuSTARJ111518+7935.7 | 9 | 0.693 | BL | ... | 0 | C+P | 1 | ... |
| 529 | NuSTARJ111822–6127.0 | 25 | 0 | Galactic | ... | 0 | ... | 2 | Counterpart uncertainty; two potential soft X-ray counterparts associated with non-AGN WISE sources. |
| 537 | NuSTARJ112026+1340.4 | S | 0.984 | BL | ... | 0 | C+P | 1 | ... |
| 540 | NuSTARJ112745–2911.0 | 29 | 0.190 | BL | ... | 0 | C+P | 1 | Hβ + [O iii] affected by chip gap. |
| 547 | NuSTARJ113253+5303.6 | S | 0.509 | BL | ... | 0 | C+P | 1 | ... |
| 563 | NuSTARJ114934–0413.6 | 30 | 0.341 | NL | ... | 0 | C+P | 1 | ... |
| 564 | NuSTARJ114948+5323.1 | 3 | 0.499 | NL | ... | 0 | C | 1 | ... |
| 566 | NuSTARJ114957+5320.1 | 3 | 0.233 | NL | ... | 0 | ... | 2 | Counterpart uncertainty due to deficient soft X-ray information. |
| 568 | NuSTARJ115658+5508.2 | S | 0.080 | NL | ... | 0 | C+P | 1 | Albareti et al. (2017). |
| 570 | NuSTARJ115809+5532.4 | S | 1.607 | BL | ... | 0 | C+P | 1 | C iv BALQSO. |
| 586 | NuSTARJ120530+1649.9 | 3 | 0.216 | BL/pair | ... | 1 | C+P | 1 | AGN pair; WISEA J120530.63+164941.4 (Ahn et al. 2012; Toba et al. 2014); NL companion is on the edge of BPT composite region; associated with the NuSTAR science target (2MASX J12054771+1651085; Darling & Giovanelli 2006). |
| 587 | NuSTARJ120539+1657.0 | 3 | 0.548 | NL | ... | 0 | C | 1 | Hβ + [O iii] affected by A-band telluric feature. |
| 588 | NuSTARJ120551+1657.9 | 3 | 0.416 | NL | ... | 0 | C | 1 | Emission-line galaxy. |
| 593 | NuSTARJ121249+0659.7 | S | 0.210 | BL | ... | 0 | C+P | 1 | ... |
| 612 | NuSTARJ121932+4717.8 | 3 | 1.233 | BL | ... | 0 | C+P | 1 | ... |
| 613 | NuSTARJ122119+3015.8 | S | 0.646 | BL | ... | 0 | C | 2 | Counterpart uncertainty; the closer CXO source to the NuSTAR detection is a SDSS BL at z = 0.531. |
| 615 | NuSTARJ122222+0416.4 | S | 1.190 | BL | ... | 0 | C+P | 1 | ... |
| 624 | NuSTARJ123755+1147.0 | 10 | ... | ... | F | 0 | C+P | 1 | Continuum detected. |
| 625 | NuSTARJ123849–1614.4 | 30 | ... | ... | F | 0 | P | 2 | Possibly incorrect counterpart based on WISE colors deficient soft X-ray information; continuum detected. |
| 633 | NuSTARJ125442–2657.1 | L | 0.0586 | Gxy | ... | 1 | C+P | 1 | Paturel et al. (2005); associated with the NuSTAR science target (2MASX J12545637–2657021 Parisi et al. 2014). |
| 634 | NuSTARJ125524+5656.2 | S | 1.189 | BL | ... | 0 | C | 1 | ... |
| 641 | NuSTARJ125631+5649.5 | S | 1.188 | BL | ... | 0 | C+P | 1 | Albareti et al. (2017). |
| 651 | NuSTARJ130432–1024.5 | 9 | 1.059 | BL | ... | 0 | C | 1 | ... |
| 653 | NuSTARJ130519–4934.2 | 31 | 0 | Galactic | ... | 0 | C | 1 | Flux calibration failure. |
| 654 | NuSTARJ130617–4021.5 | 26 | 1.052 | BL | ... | 0 | C | 1 | ... |
| 672 | NuSTARJ132139+0023.9 | S | 1.621 | BL | ... | 0 | C+P | 1 | ... |
| 673 | NuSTARJ132231–1647.4 | 25 | 0.349 | BL | ... | 0 | C+P | 1 | ... |
| 674 | NuSTARJ132240–1642.7 | 3 | 2.386 | BL | ... | 0 | C+P | 1 | ... |
| 675 | NuSTARJ132250–1645.1 | 3 | 0.656 | BL | ... | 0 | C+P | 1 | Possibly spurious feature at 4800 Å due to cosmic ray. |
| 676 | NuSTARJ132253–1636.7 | 25 | 1.631 | BL | ... | 0 | C+P | 1 | ... |
| 678 | NuSTARJ132455–3822.4 | 28 | 0 | Galactic | ... | 0 | ... | 1 | Bright in WISE W3-band. |
| 680 | NuSTARJ132525–3821.0 | 28 | 0 | Galactic | ... | 0 | C | 1 | ... |
| 681 | NuSTARJ132533–3828.7 | 28 | 0 | Galactic | ... | 0 | ... | 2 | Counterpart uncertainty; WISE-XMM candidate identified with Nway matches to a faint optical source. |
| 682 | NuSTARJ132535–3830.7 | 28 | 0 | Galactic | ... | 0 | C | 1 | ... |
| 683 | NuSTARJ132535–3825.6 | L | 0.445 | GClstr | ... | 0 | C | 2 | Counterpart uncertainty; Cluster of Galaxies; Burke et al. (2003). |
| 689 | NuSTARJ132939+4719.2 | S | 1.028 | BL | ... | 0 | C+P | 1 | ... |
| 690 | NuSTARJ133213–0511.7 | 10 | 0.481 | BL | ... | 0 | ... | 2 | Counterpart uncertainty; XRT-WISE AGN candidate identified with Nway; [O iii]/Hβ agrees with Type-2 AGN relation, but broad Mg ii evident. |
| 692 | NuSTARJ133343–3400.1 | 27 | 2.715 | BL | ... | 0 | C | 1 | BALQSO; C iv absorption. |
| 694 | NuSTARJ133401–3403.6 | 27 | 0.145 | NL | ... | 0 | C | 1 | Hα affected by A-band telluric feature. |
| 699 | NuSTARJ133843+4818.1 | S | 1.732 | BL | ... | 0 | P | 1 | Albareti et al. (2017). |
| 700 | NuSTARJ134547+7317.0 | 9 | 0.579 | NL | ... | 0 | C | 2 | Counterpart uncertainty; Hβ affected by A-band telluric feature. |
| 710 | NuSTARJ135345–0209.2 | 10 | 0.627 | NL | ... | 0 | C | 1 | ... |
| 711 | NuSTARJ135351–0204.2 | 28 | ... | ... | F | 0 | C | 1 | Continuum detected; counterpart uncertainty due to deficient soft X-ray information. |
| 713 | NuSTARJ140459+2552.2 | 10 | 1.363 | BL | ... | 0 | C+P | 1 | NALQSO; C iv and Mg ii doublet absorption lines. |
| 717 | NuSTARJ140536+2551.7 | S | 0.943 | BL | ... | 0 | C | 1 | ... |
| 729 | NuSTARJ141842+2100.1 | S | 1.122 | BL | ... | 0 | C+P | 1 | ... |
| 730 | NuSTARJ141857+2105.1 | 4 | 0.895 | NL | ... | 0 | C+P | 1 | Emission-line galaxy. |
| 731 | NuSTARJ141914+2104.2 | S | 0.109 | NL | ... | 0 | C+P | 1 | Galaxy spectrum with narrow Hα Emission-line; Albareti et al. (2017). |
| 736 | NuSTARJ142510+3320.4 | S | 0.258 | BL | ... | 0 | C+P | 1 | Ahn et al. (2012). |
| 738 | NuSTARJ142904+0120.4 | S | 0.101 | NL | ... | 0 | C+P | 1 | Star-forming galaxy (Driver et al. 2011). |
| 745 | NuSTARJ143442–0144.6 | 3 | 0.285 | NL | ... | 0 | ... | 2 | Counterpart uncertainty due to deficient soft X-ray information WISE AGN candidates. |
| 746 | NuSTARJ143517–0146.5 | 4 | 0.690 | NL | ... | 0 | C+P | 1 | Early-type galaxy with strong oxygen lines. |
| 750 | NuSTARJ143707+3639.5 | S | 0.861 | BL | ... | 0 | C+P | 1 | ... |
| 759 | NuSTARJ144932–4012.3 | L | 0.057 | NL | ... | 0 | C | 1 | Jones et al. (2009). |
| 762 | NuSTARJ145034+0508.3 | S | 1.635 | BL | ... | 0 | C | 1 | ... |
| 769 | NuSTARJ145452+0331.2 | 21 | 2.606 | BL | ... | 0 | C+P | 1 | C iv affected by chip gap; potentially C iv BALQSO from SALT spectrum. |
| 772 | NuSTARJ145513+0322.7 | S | 0.423 | BL | ... | 0 | C+P | 1 | ... |
| 774 | NuSTARJ145528+0324.4 | 21 | ... | ... | F | 0 | C+P | 1 | Continuum detected. |
| 775 | NuSTARJ145812–3133.4 | 31 | ... | ... | F | 0 | ... | 1 | Continuum detected. |
| 785 | NuSTARJ150225–4208.3 | L | 0.054 | Gxy | ... | 0 | C | 1 | Jones et al. (2009). |
| 787 | NuSTARJ150334–4152.5 | L | 0.335 | BL | ... | 0 | C | 1 | Winkler & Long (1997). |
| 788 | NuSTARJ150516+0324.0 | 11 | 0.533 | BL | ... | 0 | C+P | 1 | [O iii] affected by A-band telluric feature. |
| 789 | NuSTARJ150529+0322.6 | S | 2.358 | BL | ... | 0 | C+P | 1 | ... |
| 792 | NuSTARJ150915+5702.2 | 15 | 0 | Galactic | ... | 0 | C+P | 2 | Counterpart uncertainty; require deeper optical/IR imaging. |
| 794 | NuSTARJ150937+5703.6 | S | 0.308 | BL | ... | 0 | C+P | 1 | ... |
| 796 | NuSTARJ151008+5705.8 | S | 0.548 | NL | ... | 0 | C+P | 1 | The nominally closer W3-detected X-ray source is a galaxy at z = 0.272; Eckart et al. (2006). |
| 798 | NuSTARJ151148–1050.3 | 3 | 0.947 | NL | ... | 0 | C+P | 1 | ... |
| 803 | NuSTARJ151519+5615.6 | 9 | 0.490 | NL | ... | 0 | C+P | 2 | Counterpart uncertainty; XMM source is undetected with Keck; spectrum is a z = 0.490 emission-line galaxy at 3 |
| 807 | NuSTARJ151626+5620.7 | S | 1.349 | BL | ... | 0 | C+P | 1 | ... |
| 813 | NuSTARJ152548+4139.3 | S | 0.679 | BL | ... | 0 | C | 1 | ... |
| 815 | NuSTARJ152722+3600.2 | S | 0.269 | NL | ... | 0 | C+P | 1 | ... |
| 819 | NuSTARJ153601+5435.1 | 3 | 1.150 | BL | ... | 0 | C+P | 1 | ... |
| 820 | NuSTARJ153602–5749.0 | 28 | 0 | Galactic | ... | 0 | C | 1 | ... |
| 821 | NuSTARJ153632–5751.2 | 25 | 0 | Galactic | ... | 0 | ... | 2 | Counterpart uncertainty due to deficient soft X-ray information and high source density at low Galactic latitude. |
| 824 | NuSTARJ153640+5435.1 | S | 0.447 | BL | ... | 0 | C+P | 1 | ... |
| 825 | NuSTARJ153700+5434.2 | 4 | 1.315 | BL | ... | 0 | C+P | 1 | ... |
| 829 | NuSTARJ154407+2827.1 | S | 0.303 | BL | ... | 0 | C | 1 | ... |
| 830 | NuSTARJ154430+2828.1 | S | 0.231 | BL | ... | 0 | C | 1 | ... |
| 849 | NuSTARJ160817+1221.4 | 10 | 0.181 | NL | ... | 0 | P | 2 | Counterpart uncertainty due to deficient soft X-ray information; W3-detected target seems correct. |
| 850 | NuSTARJ160832+1222.4 | 10 | 0.944 | NL | ... | 0 | C+P | 1 | Mg ii affected by chip gap; WISEA J160833.89+122216.7. |
| 852 | NuSTARJ161404+4702.8 | S | 0.551 | BL | ... | 0 | C+P | 1 | Albareti et al. (2017). |
| 853 | NuSTARJ161417+4701.8 | 23 | 0.151 | NL | ... | 0 | C+P | 1 | Hα affected by A-band telluric feature. |
| 854 | NuSTARJ161424+4709.3 | S | 1.502 | BL | ... | 0 | C+P | 1 | C iv BALQSO. |
| 855 | NuSTARJ161445+4659.3 | 23 | 0.153 | NL | ... | 0 | C+P | 1 | Hα affected by A-band telluric feature. |
| 857 | NuSTARJ161548+2210.9 | S | 1.698 | BL | ... | 0 | C+P | 1 | ... |
| 860 | NuSTARJ161723+3225.2 | 4 | 1.028 | NL | ... | 0 | ... | 2 | Counterpart uncertainty; Nway disagreement; a post-starburst galaxy. |
| 867 | NuSTARJ162035+8530.3 | 10 | 0.258 | BL | ... | 0 | C+P | 1 | ... |
| 881 | NuSTARJ163108+2350.1 | 11 | 0.038 | NL | ... | 0 | ... | 2 | Counterpart uncertainty; associated with a known local starburst; difficult to assess due to deficient soft X-ray information. |
| 882 | NuSTARJ163114+2358.1 | S | 0.038 | Gxy | ... | 0 | C | 1 | Albareti et al. (2017). |
| 883 | NuSTARJ163126+2357.0 | 10 | 0.751 | BL | ... | 0 | C+P | 1 | ... |
| 886 | NuSTARJ164323+3948.4 | S | 0.0306 | NL | ... | 0 | C+P | 1 | Galaxy spectrum with narrow Hα emission line. |
| 890 | NuSTARJ164503+2624.9 | S | 0.127 | NL | ... | 0 | P | 1 | Broad + narrow Hα emission line; galaxy shining through. |
| 892 | NuSTARJ164511+2620.4 | S | 1.168 | BL | ... | 0 | C | 1 | ... |
| 894 | NuSTARJ164718+2103.5 | 4 | 0.882 | BL | ... | 0 | C+P | 1 | NALQSO; Mg ii λ λ2796,2803 absorption doublets. |
| 895 | NuSTARJ164724+2105.5 | 4 | 0.788 | NL | ... | 0 | C | 1 | |
| 897 | NuSTARJ165059+0440.5 | 10 | 0.299 | BL | ... | 0 | ... | 2 | Counterpart uncertainty; two AGN-like WISE candidates within XRT error circle. |
| 913 | NuSTARJ165315–0158.3 | 9 | 0.189 | BL | ... | 0 | C+P | 1 | ... |
| 915 | NuSTARJ165349–0154.8 | 11 | 0.627 | BL | ... | 0 | C+P | 1 | ... |
| 916 | NuSTARJ165414+3949.9 | S | 1.636 | BL | ... | 0 | C+P | 1 | ... |
| 917 | NuSTARJ165417+3946.8 | S | 0.354 | NL? | ... | 0 | C | 1 | Adelman-McCarthy et al. (2008). |
| 924 | NuSTARJ165825+5855.8 | 23 | 0.105 | NL | ... | 0 | ... | 2 | Counterpart uncertainty; CXO source (Nway) is the more probable counterpart. |
| 929 | NuSTARJ170632–6138.4 | 26 | 0 | Galactic | ... | 0 | ... | 2 | Counterpart uncertainty based on WISE colors and multiple candidates within XRT error circle. |
| 947 | NuSTARJ172405+5058.4 | 23 | 0.298 | NL | ... | 0 | C+P | 1 | ... |
| 968 | NuSTARJ175307–0123.7 | 28 | 0 | Galactic | ... | 0 | C+P | 1 | ... |
| 974 | NuSTARJ180958–4552.6 | L | 0.070 | BL | ... | 0 | C | 1 | Flat-Spectrum Radio Source; blazar (Healey et al. 2007; Jones et al. 2009); reported in Swift-BAT BASS DR2 (Koss et al. 2022). |
| 978 | NuSTARJ181313–1240.0 | 17 | ... | ... | F | 0 | C+P | 1 | Continuum detected; heavily reddened source. |
| 997 | NuSTARJ182622–1446.6 | 15 | 0 | Galactic | ... | 0 | C+P | 2 | Counterpart uncertainty; all three bright objects are Galactic sources. |
| 1001 | NuSTARJ183042+0931.1 | 6 | 0 | Galactic | ... | 0 | C+P | 1 | ... |
| 1002 | NuSTARJ183052+0925.3 | 6 | 0 | Galactic | ... | 0 | C+P | 1 | ... |
| 1005 | NuSTARJ183250–0913.9 | 13 | 0 | Galactic | ... | 0 | ... | 2 | Counterpart uncertainty due to high source density at low Galactic latitude problematic WISE imaging. |
| 1009 | NuSTARJ183428+3239.4 | 4 | 0.292 | Gxy | ... | 0 | C+P | 1 | Possibly two sources contributing to NuSTAR detection; early-type galaxy with hints of [Nii] emission. |
| 1018 | NuSTARJ183511+4357.9 | 23 | 0 | Galactic | ... | 0 | C | 1 | Unusual WISE (bright in W3) optical colors for Galactic source. |
| 1043 | NuSTARJ184449+7212.1 | 23 | 1.298 | BL | ... | 0 | C | 1 | ... |
| 1045 | NuSTARJ184552+8428.2 | 23 | 0.233 | NL/pair | ... | 1 | ... | 1 | NL AGN with an early-type galaxy companion at the same redshift (Nway position); associated with the NuSTAR science target (1RXS J184642.2+842506; Bauer et al. 2000; Koss et al. 2022). |
| 1047 | NuSTARJ184628+7214.2 | 23 | 0.750 | BL | ... | 0 | C+P | 1 | ... |
| 1048 | NuSTARJ185528+0123.7 | 21 | ... | ... | F | 0 | P | 1 | Red continuum |
| 1049 | NuSTARJ185544+0124.7 | 32 | 0 | Galactic | ... | 0 | ... | 2 | Counterpart uncertainty and Nway disagreement; require deeper optical/IR data. |
| 1055 | NuSTARJ190642+0917.5 | 15 | 0 | Galactic | ... | 0 | ... | 2 | Counterpart uncertainty due to high source density at low Galactic latitude. |
| 1057 | NuSTARJ190813–3925.7 | 31 | 0.075 | Gxy | ... | 1 | C | 1 | Hα lost to chip gap; associated with the NuSTAR science target (2MASX J19075035–3923315 Jones et al. 2009; Malizia et al. 2012). |
| 1061 | NuSTARJ192215–5844.9 | 30 | 0.231 | BL | ... | 0 | C | 1 | ... |
| 1069 | NuSTARJ192607+4134.1 | 23 | 0.777 | BL | ... | 0 | C+P | 1 | ... |
| 1092 | NuSTARJ194226–1016.0 | 5 | 0.449 | BL | ... | 0 | C+P | 1 | ... |
| 1093 | NuSTARJ194234–1011.9 | 13 | 0.849 | NL? | B | 0 | C+P | 1 | Emission-line galaxy; possible obscured AGN; tentative C iii], [Ne V] and [O iii] detections at z = 0.849. |
| 1098 | NuSTARJ195204+0234.6 | 23 | 1.168 | BL | ... | 0 | C+P | 1 | ... |
| 1100 | NuSTARJ195221+2930.2 | 7 | ... | ... | F | 0 | P | 2 | Counterpart uncertainty due to deficient soft X-ray information; red continuum. |
| 1108 | NuSTARJ200727–4431.6 | 26 | ... | ... | F | 0 | C | 1 | Continuum detected. |
| 1109 | NuSTARJ200735–4436.6 | 31 | 0.405 | NL | ... | 0 | C | 2 | Counterpart uncertainty due to deficient soft X-ray information; [O iii] affected by chip gap. |
| 1110 | NuSTARJ200755–4439.7 | 25 | 0.456 | BL | ... | 0 | C | 1 | ... |
| 1111 | NuSTARJ200821–4437.9 | 25 | 0.524 | NL | ... | 0 | C | 1 | ... |
| 1113 | NuSTARJ201501+3710.8 | 4 | 0 | Galactic | ... | 0 | ... | 2 | Counterpart uncertainty due to high source density; possibly incorrect based on XRT-WISE Nway candidate. |
| 1115 | NuSTARJ201536+3704.9 | 4 | 0 | Galactic | ... | 0 | ... | 2 | Counterpart uncertainty given the high source density at low Galactic latitude. |
| 1116 | NuSTARJ201545+3714.3 | 4 | 0 | Galactic | ... | 0 | ... | 1 | Ultra-red source; heavily embedded. |
| 1118 | NuSTARJ201645+5810.7 | 24 | 0 | Galactic | ... | 0 | P | 2 | Counterpart uncertainty due to deficient soft X-ray information. |
| 1119 | NuSTARJ201727+5815.5 | 24 | 0.278 | NL? | ... | 0 | C+P | 1 | Red continuum detected for the second source in the WISE error circle. |
| 1124 | NuSTARJ202029+4356.8 | 24 | 0 | Galactic | ... | 0 | C+P | 2 | Counterpart uncertainty; two stars, possibly not the X-ray emitter. |
| 1128 | NuSTARJ202108+6136.5 | 23 | 1.553 | BL | ... | 0 | C+P | 1 | ... |
| 1129 | NuSTARJ202226+6141.3 | 23 | 0.259 | NL | ... | 0 | C+P | 1 | ... |
| 1140 | NuSTARJ203353+6010.9 | 7 | 1.863 | BL | ... | 0 | C+P | 1 | ... |
| 1147 | NuSTARJ204256+7503.1 | 13 | ... | Hotspot | F | 0 | ... | 2 | Hotspot of 4C 74.26 (science target), a radio quasar at z = 0.104 (Erlund et al. 2010). |
| 1154 | NuSTARJ210737–0512.1 | 21 | 0.841 | BL? | ... | 0 | C+P | 1 | Strong [O iii] lines, but broad Mg ii detected; Akiyama et al. (2003). |
| 1156 | NuSTARJ211152+8210.4 | 11 | 0.421 | NL | ... | 0 | C+P | 1 | Hα affected by telluric feature. |
| 1157 | NuSTARJ211421+0605.5 | 24 | 0.216 | BL | ... | 0 | C+P | 1 | ... |
| 1168 | NuSTARJ212807+5649.5 | 12 | 0 | Galactic | ... | 0 | C+P | 1 | ... |
| 1171 | NuSTARJ212931–0431.4 | 4 | 0 | Galactic | ... | 0 | C+P | 1 | ... |
| 1172 | NuSTARJ212954–0425.4 | 4 | 2.065 | BL | ... | 0 | ... | 2 | Counterpart uncertainty due to multiple XMM/WISE AGN candidates; NALQSO; C iii] affected by telluric feature. |
| 1173 | NuSTARJ212956–0435.5 | 31 | 0 | Galactic | B | 0 | ... | 2 | Counterpart uncertainty due to deficient soft X-ray information; potentially spurious NuSTAR detection. |
| 1174 | NuSTARJ213005–0427.4 | 4 | 0.277 | BL | ... | 0 | C+P | 1 | Quasar with host galaxy showing through. |
| 1175 | NuSTARJ213309+5106.5 | 22 | 0 | Galactic | ... | 0 | C+P | 1 | ... |
| 1176 | NuSTARJ213347+5112.1 | 23 | 0.168 | BL | ... | 0 | C+P | 1 | Hα affected by A-band telluric feature. |
| 1178 | NuSTARJ213900–2640.4 | 28 | 0.551 | BL | ... | 0 | C+P | 1 | Hβ affected by telluric feature. |
| 1180 | NuSTARJ214239+4330.9 | 5 | 0.0174 | BL | ... | 0 | C+P | 1 | NED counterpart with same spec-z but quality B estimated; WISEA J214238.71+433057.9. |
| 1181 | NuSTARJ214320+4334.8 | 5 | 0.0131 | NL | ... | 0 | P | 1 | NED counterpart; UGC11797 (Seeberger et al. 1994). |
| 1185 | NuSTARJ214755+0651.8 | 24 | 0.182 | NL | ... | 0 | C+P | 1 | ... |
| 1186 | NuSTARJ214758–3502.4 | 29 | 0.439 | NL | ... | 0 | ... | 2 | Counterpart uncertainty due to deficient soft X-ray information; Hβ affected by chip gap. |
| 1194 | NuSTARJ220039+1039.7 | 24 | 1.389 | BL | ... | 0 | C+P | 1 | ... |
| 1204 | NuSTARJ221133+1841.5 | S | 0.578 | BL | ... | 0 | C | 1 | ... |
| 1205 | NuSTARJ221457–3842.5 | 28 | 0.800 | BL | ... | 0 | C | 1 | ... |
| 1206 | NuSTARJ221716+0051.1 | 19 | 1.934 | BL | ... | 0 | C+P | 1 | Also observed in SDSS-DR16 but with lower S/N; C iii] affected by chip gap. |
| 1207 | NuSTARJ221735–0820.7 | S | 0.085 | NL | ... | 0 | C+P | 1 | Galaxy shining through Adelman-McCarthy et al. (2008). |
| 1208 | NuSTARJ222348–0201.4 | 4 | 0.274 | NL | ... | 0 | P | 2 | Counterpart uncertainty; Nway disagreement; lack soft X-ray detection; emission-line galaxy. |
| 1212 | NuSTARJ223536+3359.0 | 21 | 0.485 | NL | ... | 0 | C+P | 1 | ... |
| 1213 | NuSTARJ223538–2554.9 | 27 | 0.429 | NL | ... | 0 | ... | 2 | Counterpart uncertainty; require spectrum of Nway candidate for further assessment. |
| 1214 | NuSTARJ223547–2558.7 | L | 0.304 | NL | ... | 0 | C+P | 1 | SyI galaxy (Caccianiga et al. 2008; Lin et al. 2012). |
| 1215 | NuSTARJ223630+3425.9 | 24 | 1.767 | BL | ... | 0 | C | 1 | Mg ii affected by A-band telluric feature. |
| 1216 | NuSTARJ223653+3423.6 | 24 | 0.149 | NL | ... | 0 | C+P | 1 | Hβ affected by chip gap. |
| 1220 | NuSTARJ223728+3425.6 | 24 | 1.571 | BL | ... | 0 | C+P | 1 | ... |
| 1224 | NuSTARJ224200–4539.3 | 28 | ... | ... | F | 0 | C | 2 | Counterpart uncertainty; difficult to assess due to deficient soft X-ray information. |
| 1228 | NuSTARJ224230+2939.4 | 23 | 0.120 | NL | ... | 0 | C+P | 1 | Hβ + [O iii] lost to chip gap. |
| 1230 | NuSTARJ224239–3707.9 | 28 | 0.222 | BL | ... | 0 | C | 1 | ... |
| 1232 | NuSTARJ224252+2941.5 | 24 | 0 | Galactic | ... | 0 | C+P | 1 | ... |
| 1233 | NuSTARJ224252+2937.0 | S | ... | ... | F | 0 | C | 1 | Continuum detected. |
| 1236 | NuSTARJ224306+2941.4 | 23 | 0.158 | Gxy | ... | 0 | ... | 2 | Counterpart uncertainty due to deficient soft X-ray information; Hβ lost to chip gap; Hα lost to A-band telluric feature. |
| 1237 | NuSTARJ224536+3947.1 | 8 | 0.081 | NL | ... | 1 | C+P | 1 | 2MASX J22453396+3946591 (Bilicki et al. 1996); associated with the NuSTAR science target (3C 452 Véron-Cetty & Véron 2006). |
| 1238 | NuSTARJ224618+3941.6 | 7 | 0.341 | NL | ... | 0 | C+P | 1 | ... |
| 1240 | NuSTARJ224925–1917.5 | 1 | 0.444 | NL | ... | 0 | C+P | 1 | ... |
| 1242 | NuSTARJ225513–0302.4 | 19 | 0.797 | BL | ... | 0 | C+P | 1 | ... |
| 1245 | NuSTARJ230147–5920.8 | 32 | 0.366 | BL? | ... | 0 | C | 1 | ... |
| 1246 | NuSTARJ230443+1216.4 | 4 | 1.410 | BL | ... | 0 | C+P | 1 | Véron-Cetty & Véron (2010). |
| 1255 | NuSTARJ232728–0047.1 | 19 | 0.217 | NL? | ... | 0 | C+P | 1 | ... |
| 1257 | NuSTARJ233200+0016.0 | S | 0.352 | BL | ... | 0 | C+P | 1 | Ahn et al. (2012). |
| 1258 | NuSTARJ233221+0020.8 | 19 | 1.853 | NL | ... | 0 | C+P | 1 | High-redshift Type-2 quasar. |
| 1261 | NuSTARJ233917–0537.2 | 7 | ... | ... | F | 0 | C | 1 | Continuum detected. |
| 1262 | NuSTARJ233948–0536.6 | 5 | 0 | Galactic | ... | 0 | ... | 2 | Counterpart uncertainty; other non-AGN WISE source in field is a galaxy at z = 0.413. |
| 1263 | NuSTARJ235538+3008.2 | 23 | 0.556 | NL | ... | 0 | ... | 2 | Counterpart uncertainty due to deficient soft X-ray information; Hβ affected by A-band telluric feature. |
| 1264 | NuSTARJ235553+3015.0 | 24 | 0.874 | BL? | ... | 0 | C+P | 1 | Faint continuum detected with tentatively broad Mg ii and weak oxygen lines. |
| 1272 | NuSTARJ235806–3237.9 | 25 | 0.795 | BL | B | 0 | C | 1 | ... |
Notes. Columns: (1): unique NuSTAR source ID. (2): unique NuSTAR source name. (3): spectroscopic follow-up observing code; see Table 6. (4): spectroscopic redshift. (5): spectroscopic classification: BL ≡ broad-line object (i.e., quasar); NL ≡ narrow-line object (AGN or galaxy); Gxy ≡ galaxy (absorption lines); Galactic ≡ Galactic sources at z = 0; see Section 3.3.3. (6): spectroscopic redshift quality: F ≡ faint continuum detected; B ≡ single-line redshift measurement; C ≡ photometric redshift. (7): binary flag to indicate association to the NuSTAR science target, i.e., sources with a velocity offset from the science target smaller than 5% of the total science target velocity. (8): flag indicating whether the spectroscopic target matches to the CatWISE20 and/or PS1 Nway-identified counterparts: C+P ≡ CatWISE20 + PS1; C ≡ CatWISE20 only; P ≡ PS1 only. (9): flag indicating the reliability of the identified spectroscopic counterpart: 0 ≡ unreliable; 1 ≡ reliable; 2 ≡ counterpart uncertainty.
The columns are described in Section E.1. Details for NSS40 sources are tabulated in Table 6 in L17.
Individual source spectra are available online and example spectra of the first four sources for the different spectral classes are shown in Figures E1–E5: BL AGNs, NL AGNs, galaxies, Galactic sources, and unclassified objects with a faint continuum detected, respectively. The spectra for each class are given in order of increasing R.A. Shown on the top are the unique NuSTAR ID and source name, in the upper-left corner the observing telescope and run identification number (corresponding to Table 6), and in the upper-right corner the source classification and redshift. All CatWISE detections are shown with “×” marks, colored green. The NuSTAR 25″ and 30″ error circles are plotted in a dashed–dotted and solid black line, respectively. All PS1-DR2 detections are shown with “plus” marks, colored pink. The X-ray position is marked with the respective error circle, the CatWISE20 position is indicated with a green 27 error circle, the PS1-DR2 position is shown with a purple 2″ error circle, and the spectroscopic target is marked with a red “crosshair” corresponding to the black spectrum in the left panel. Where a second spectrum is available, the spectrum, observation details, and target position are shown in peach.
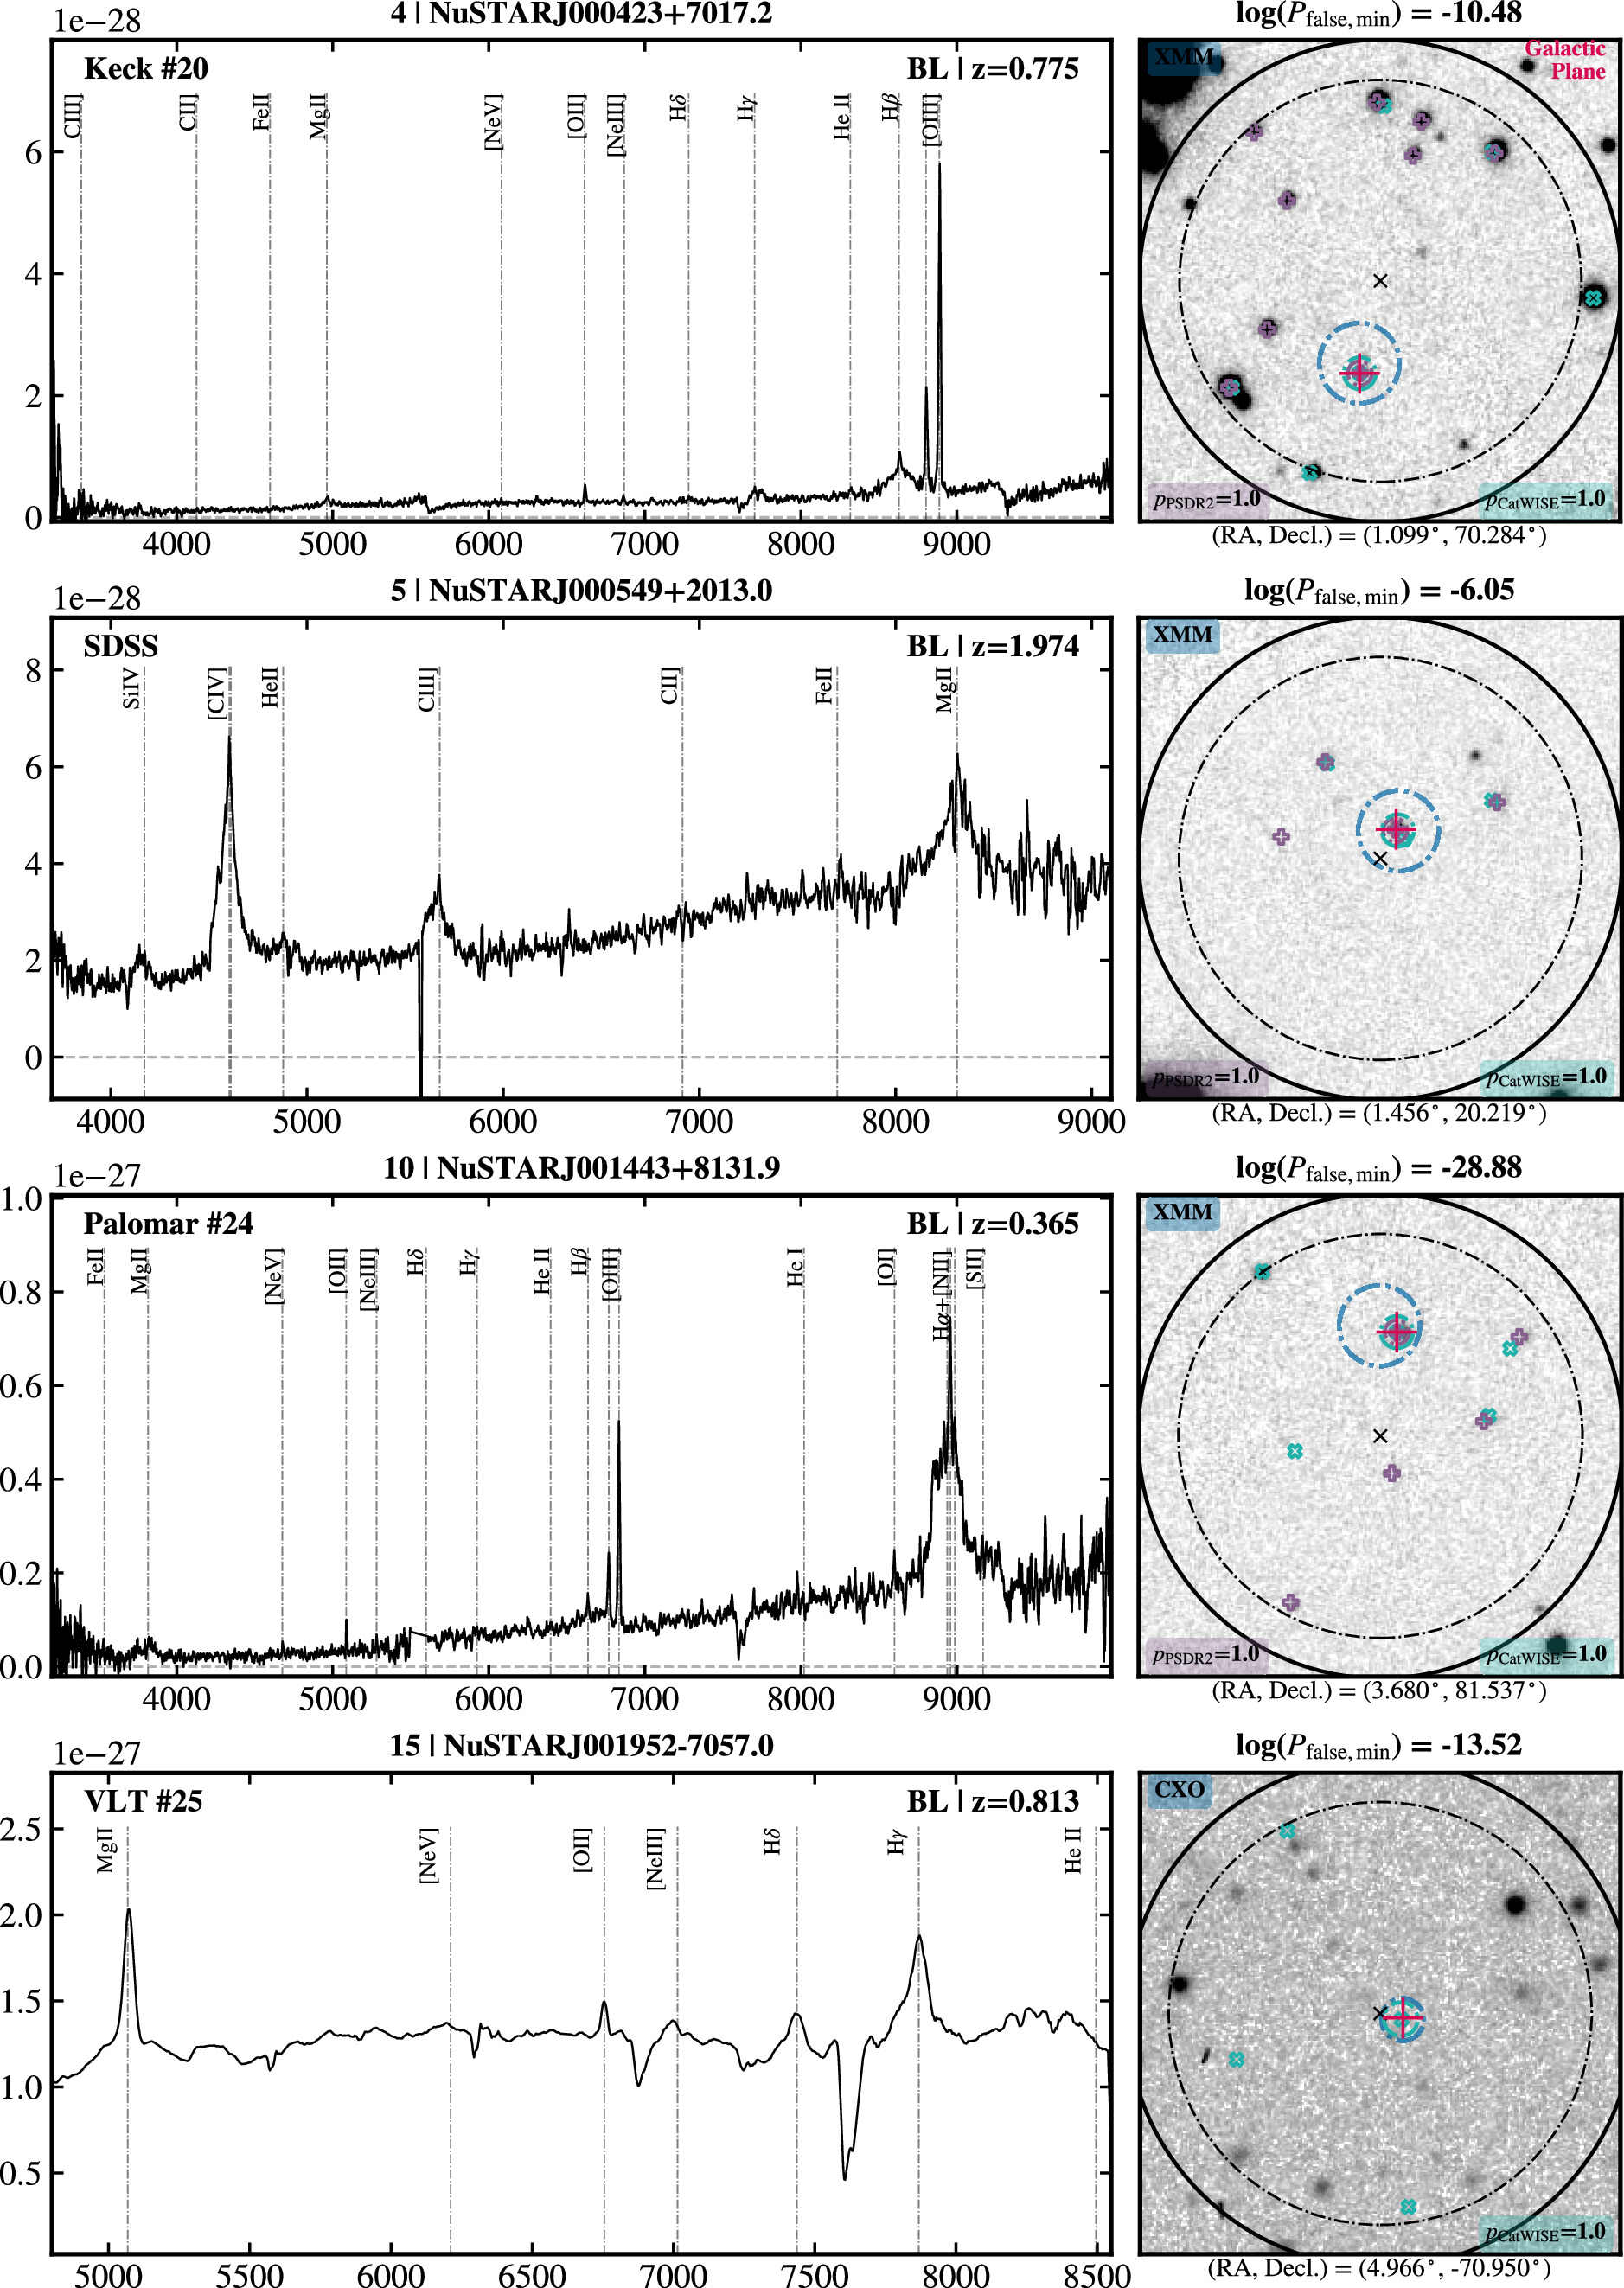
Figure E1. Optical spectra for the first four extragalactic post-NSS40 sources classified as BL AGNs in order of NuSTAR ID. The symbol key is described in Appendix E.1.
Download figure:
Standard image High-resolution image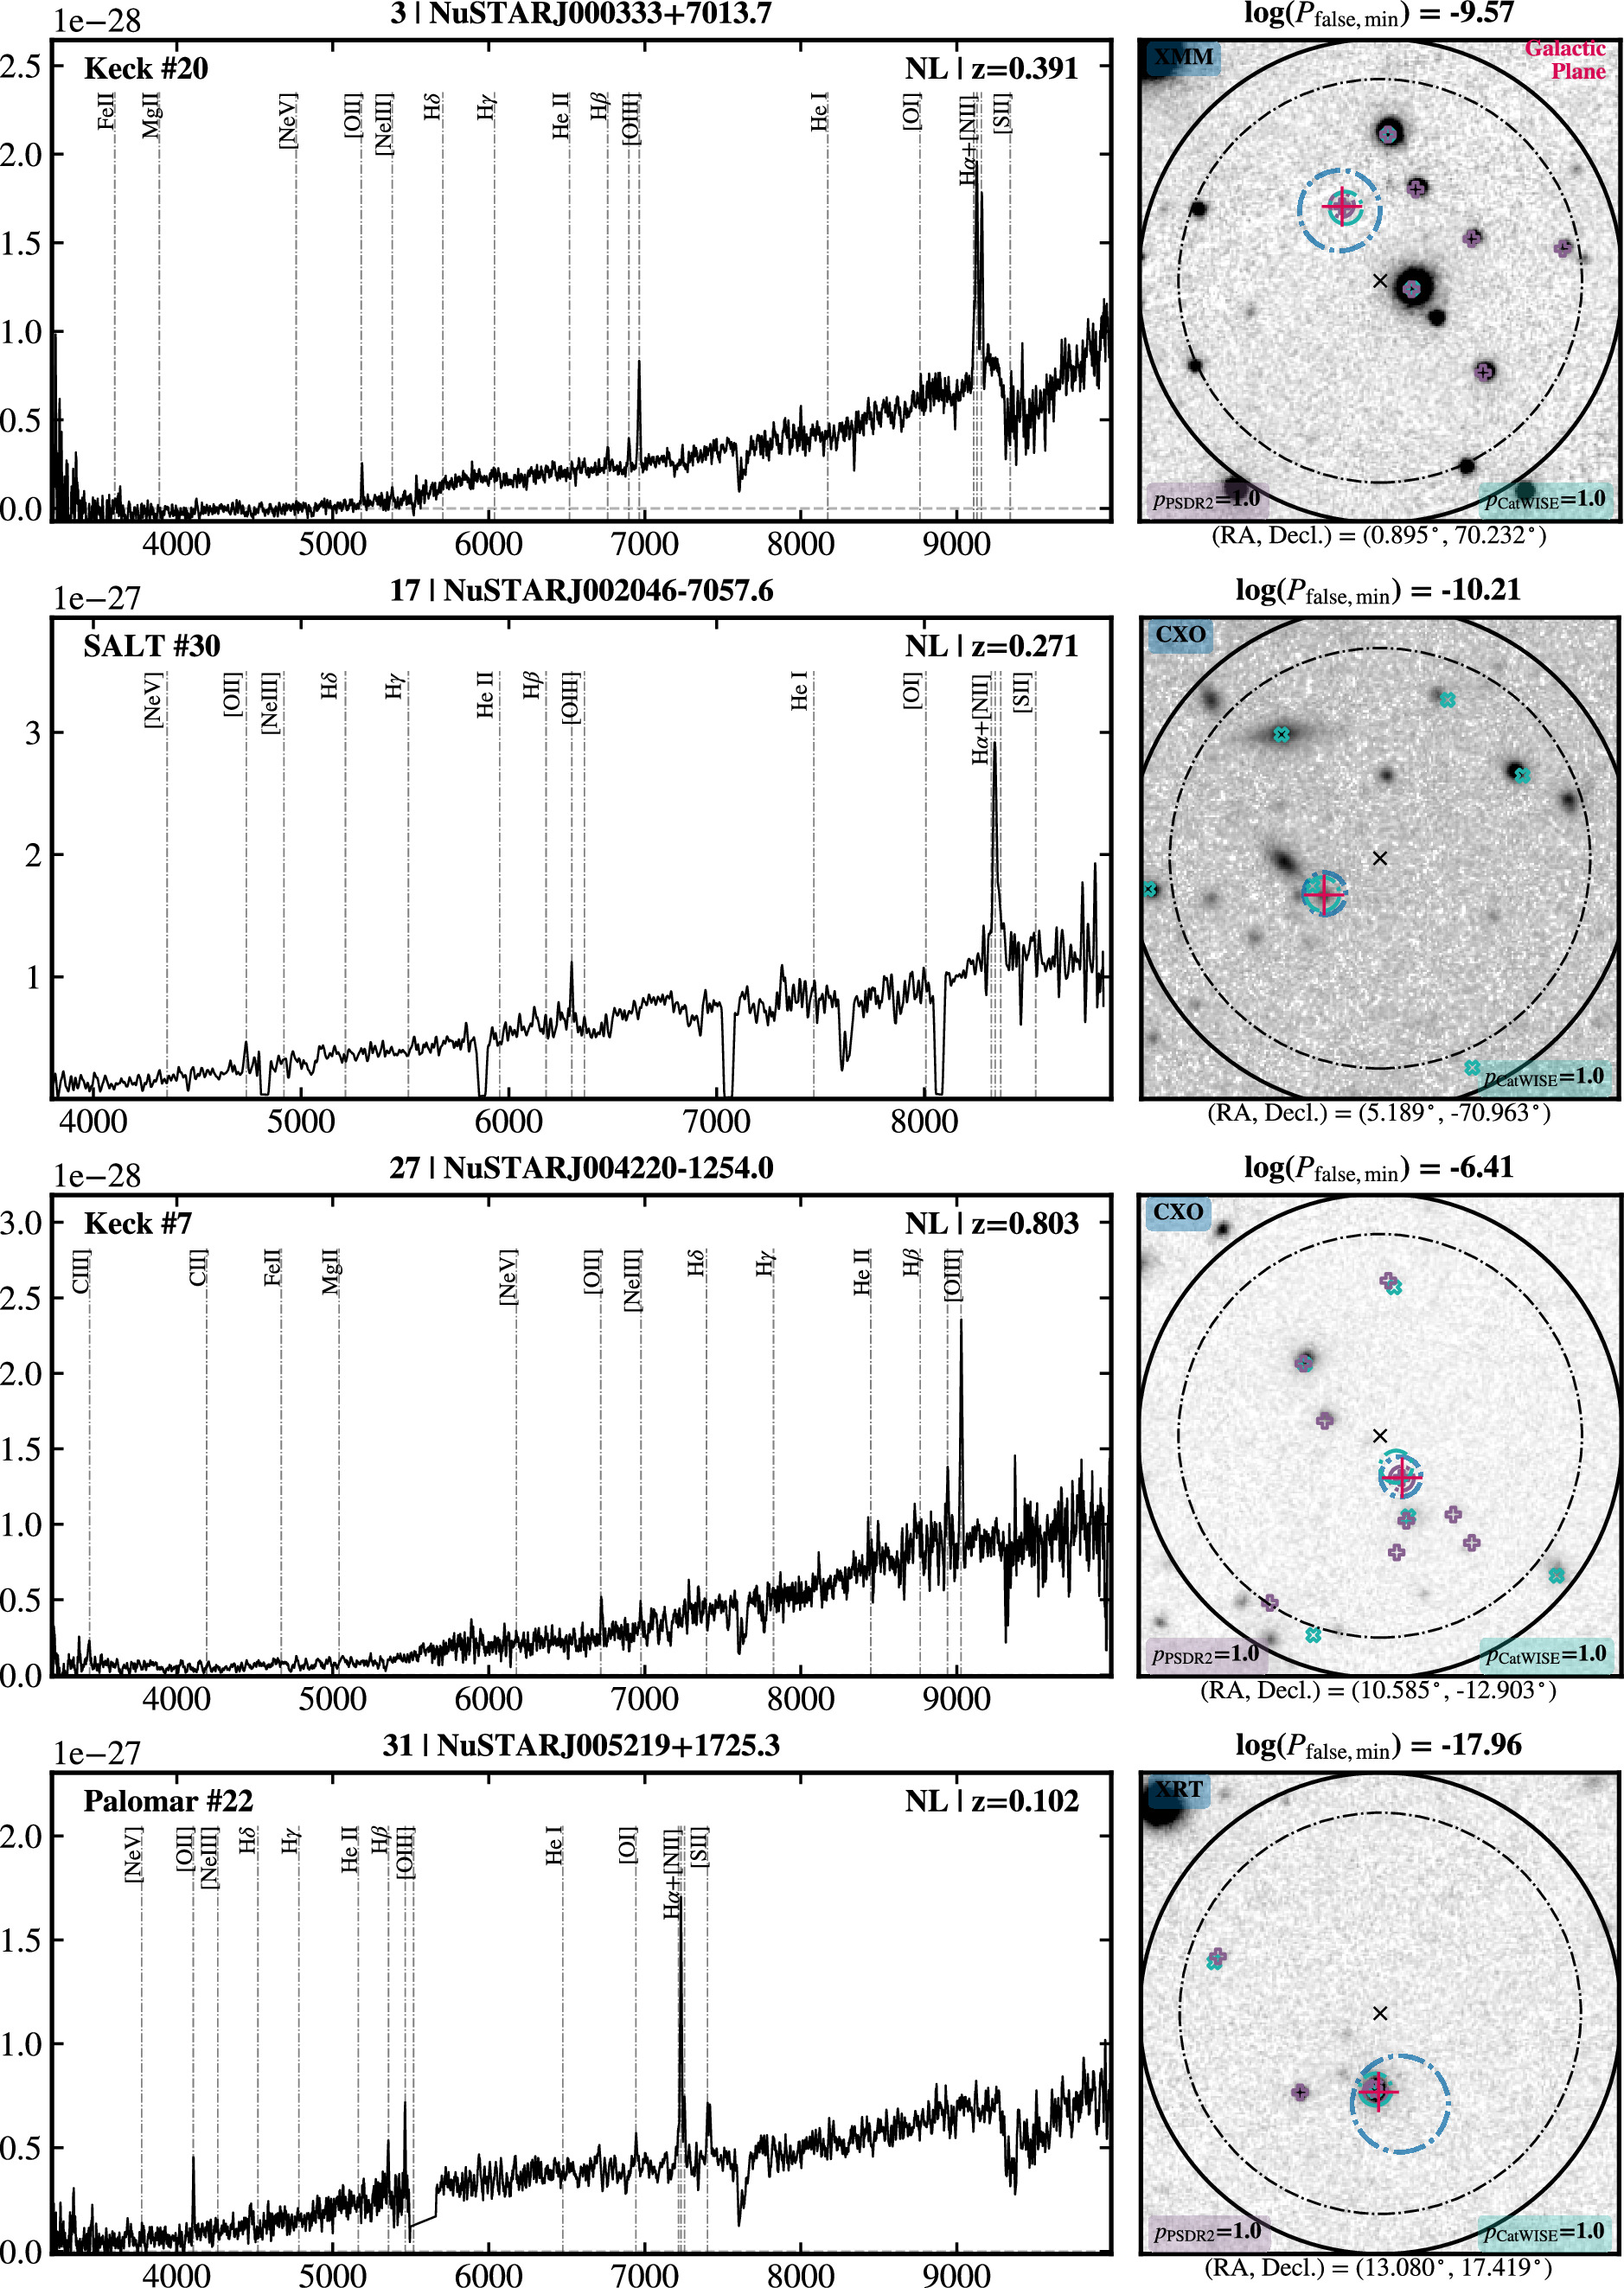
Figure E2. Optical spectra for the first four extragalactic post-NSS40 sources classified as NL AGNs. The symbol key is described in Appendix E.1.
Download figure:
Standard image High-resolution image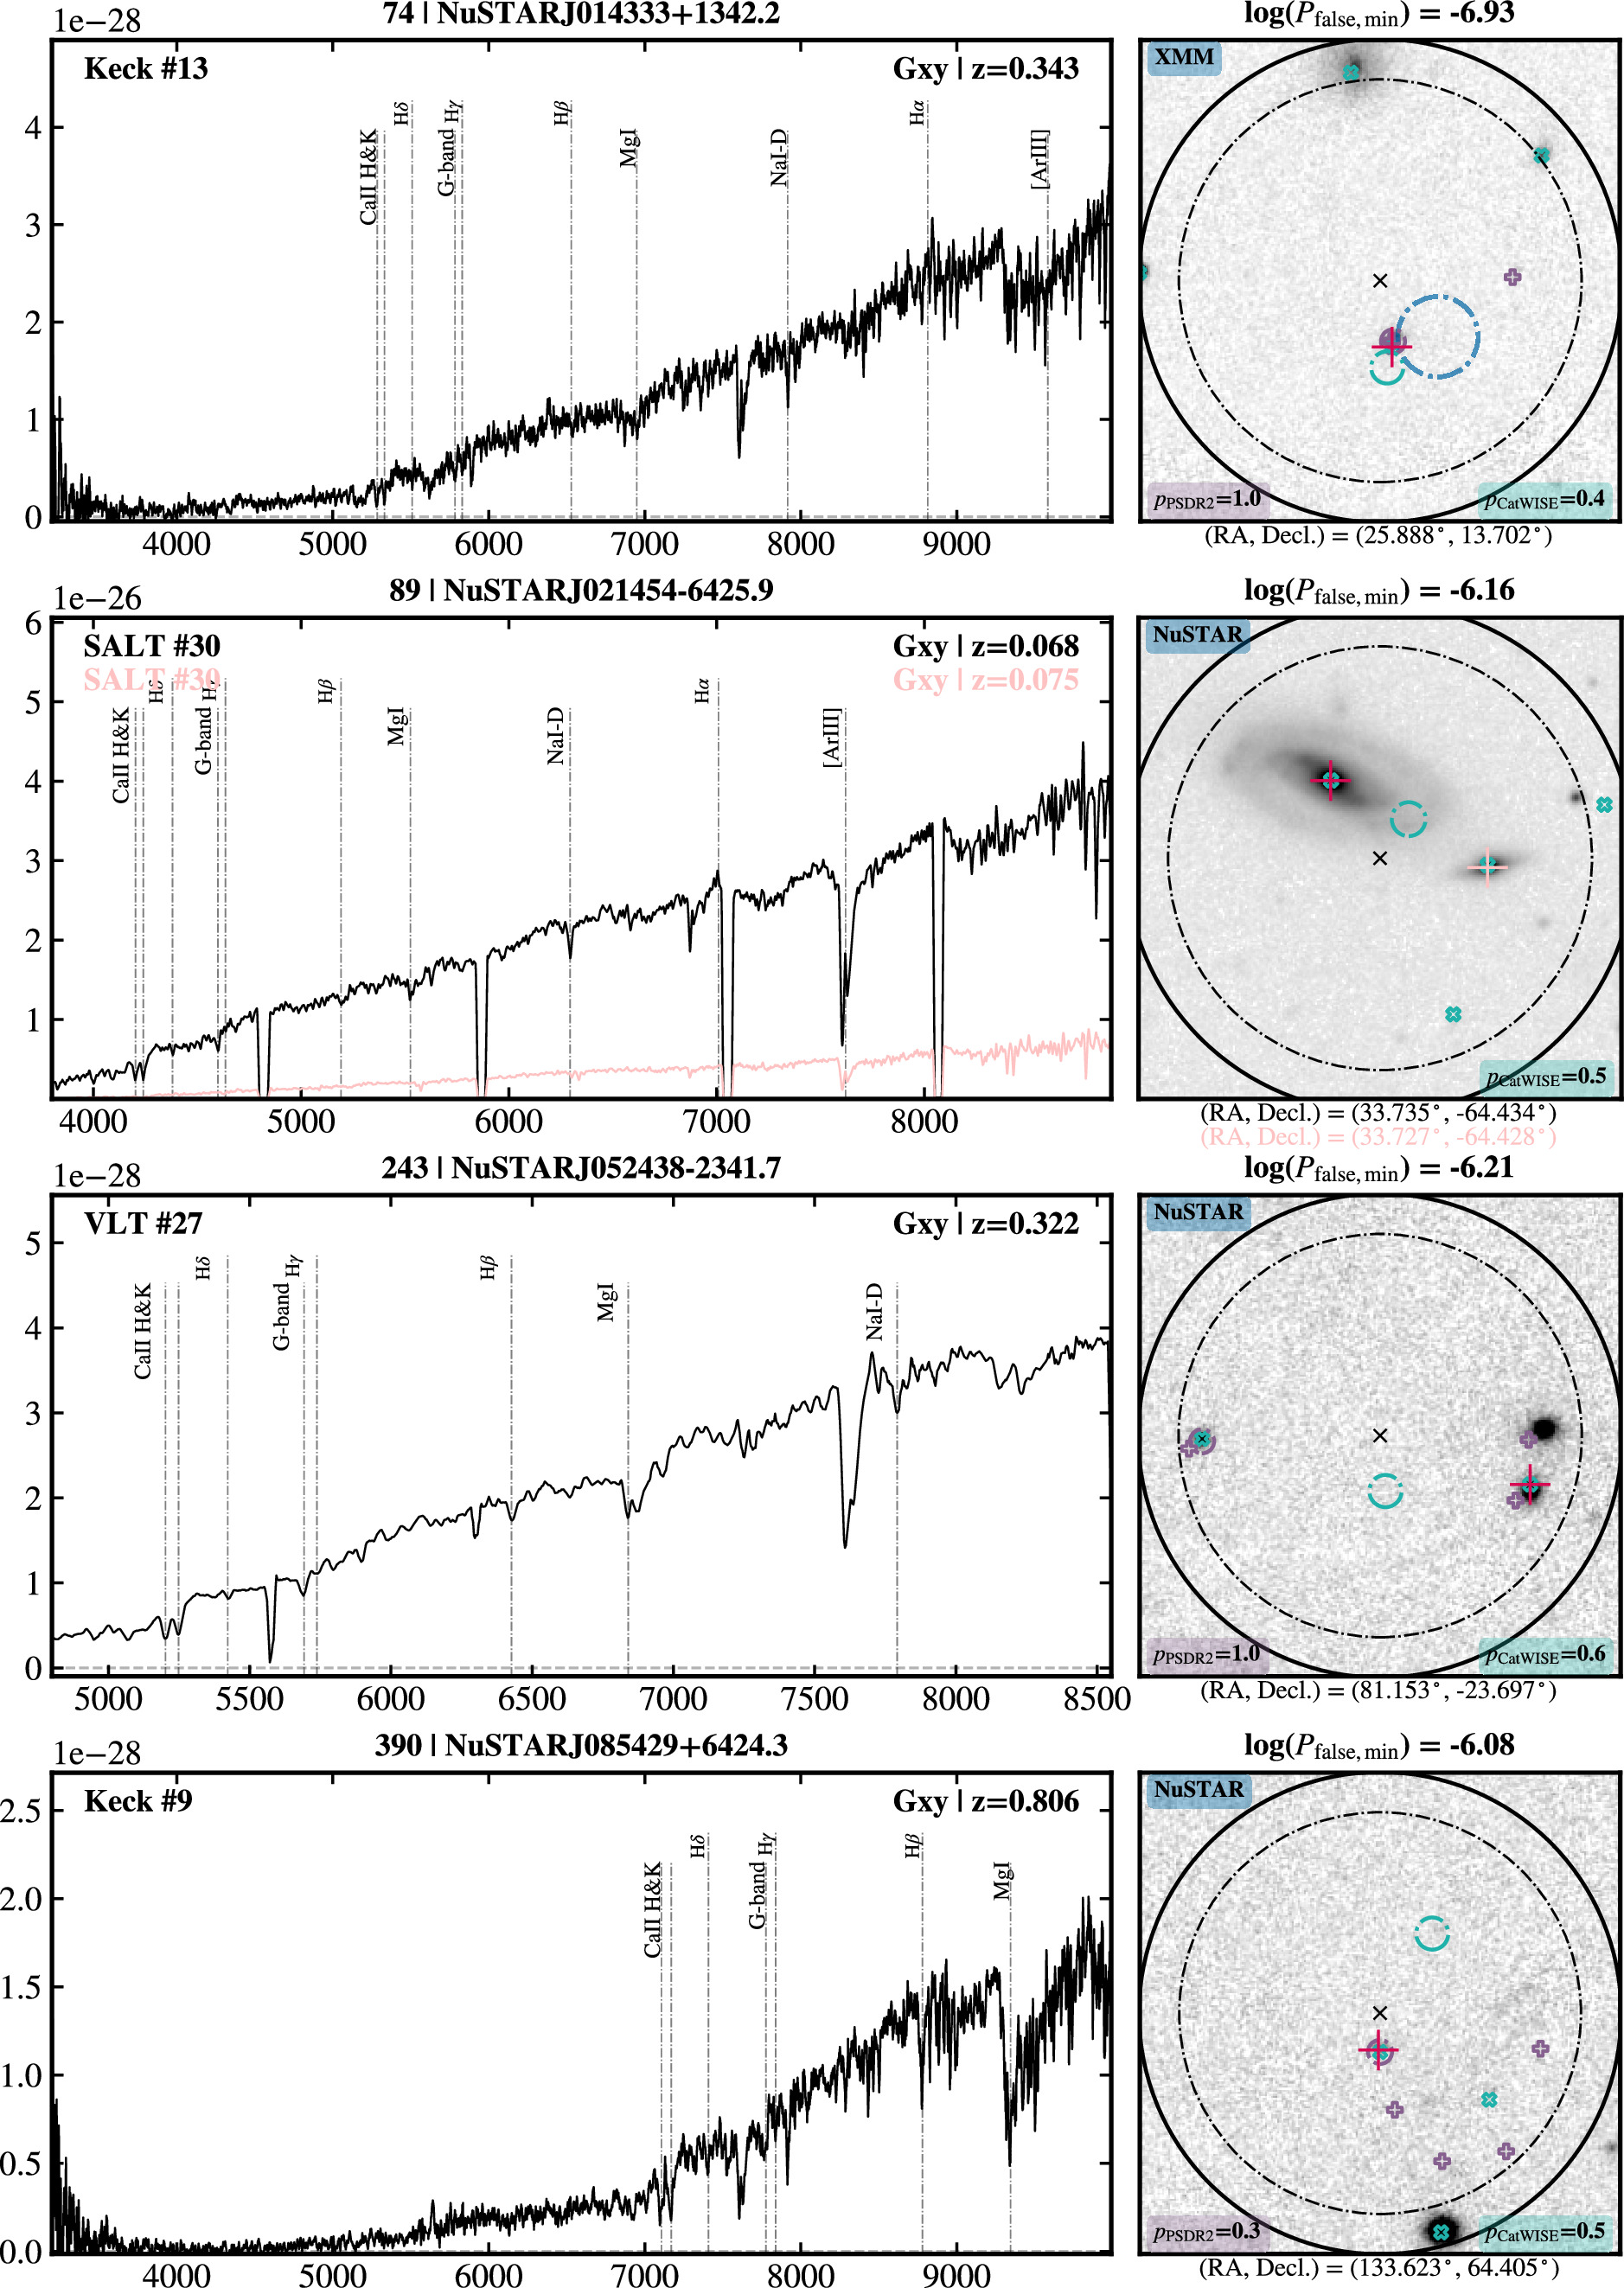
Figure E3. Optical spectra for the first four extragalactic post-NSS40 sources classified as galaxies (i.e., absorption spectral features). The symbol key is described in Appendix E.1.
Download figure:
Standard image High-resolution image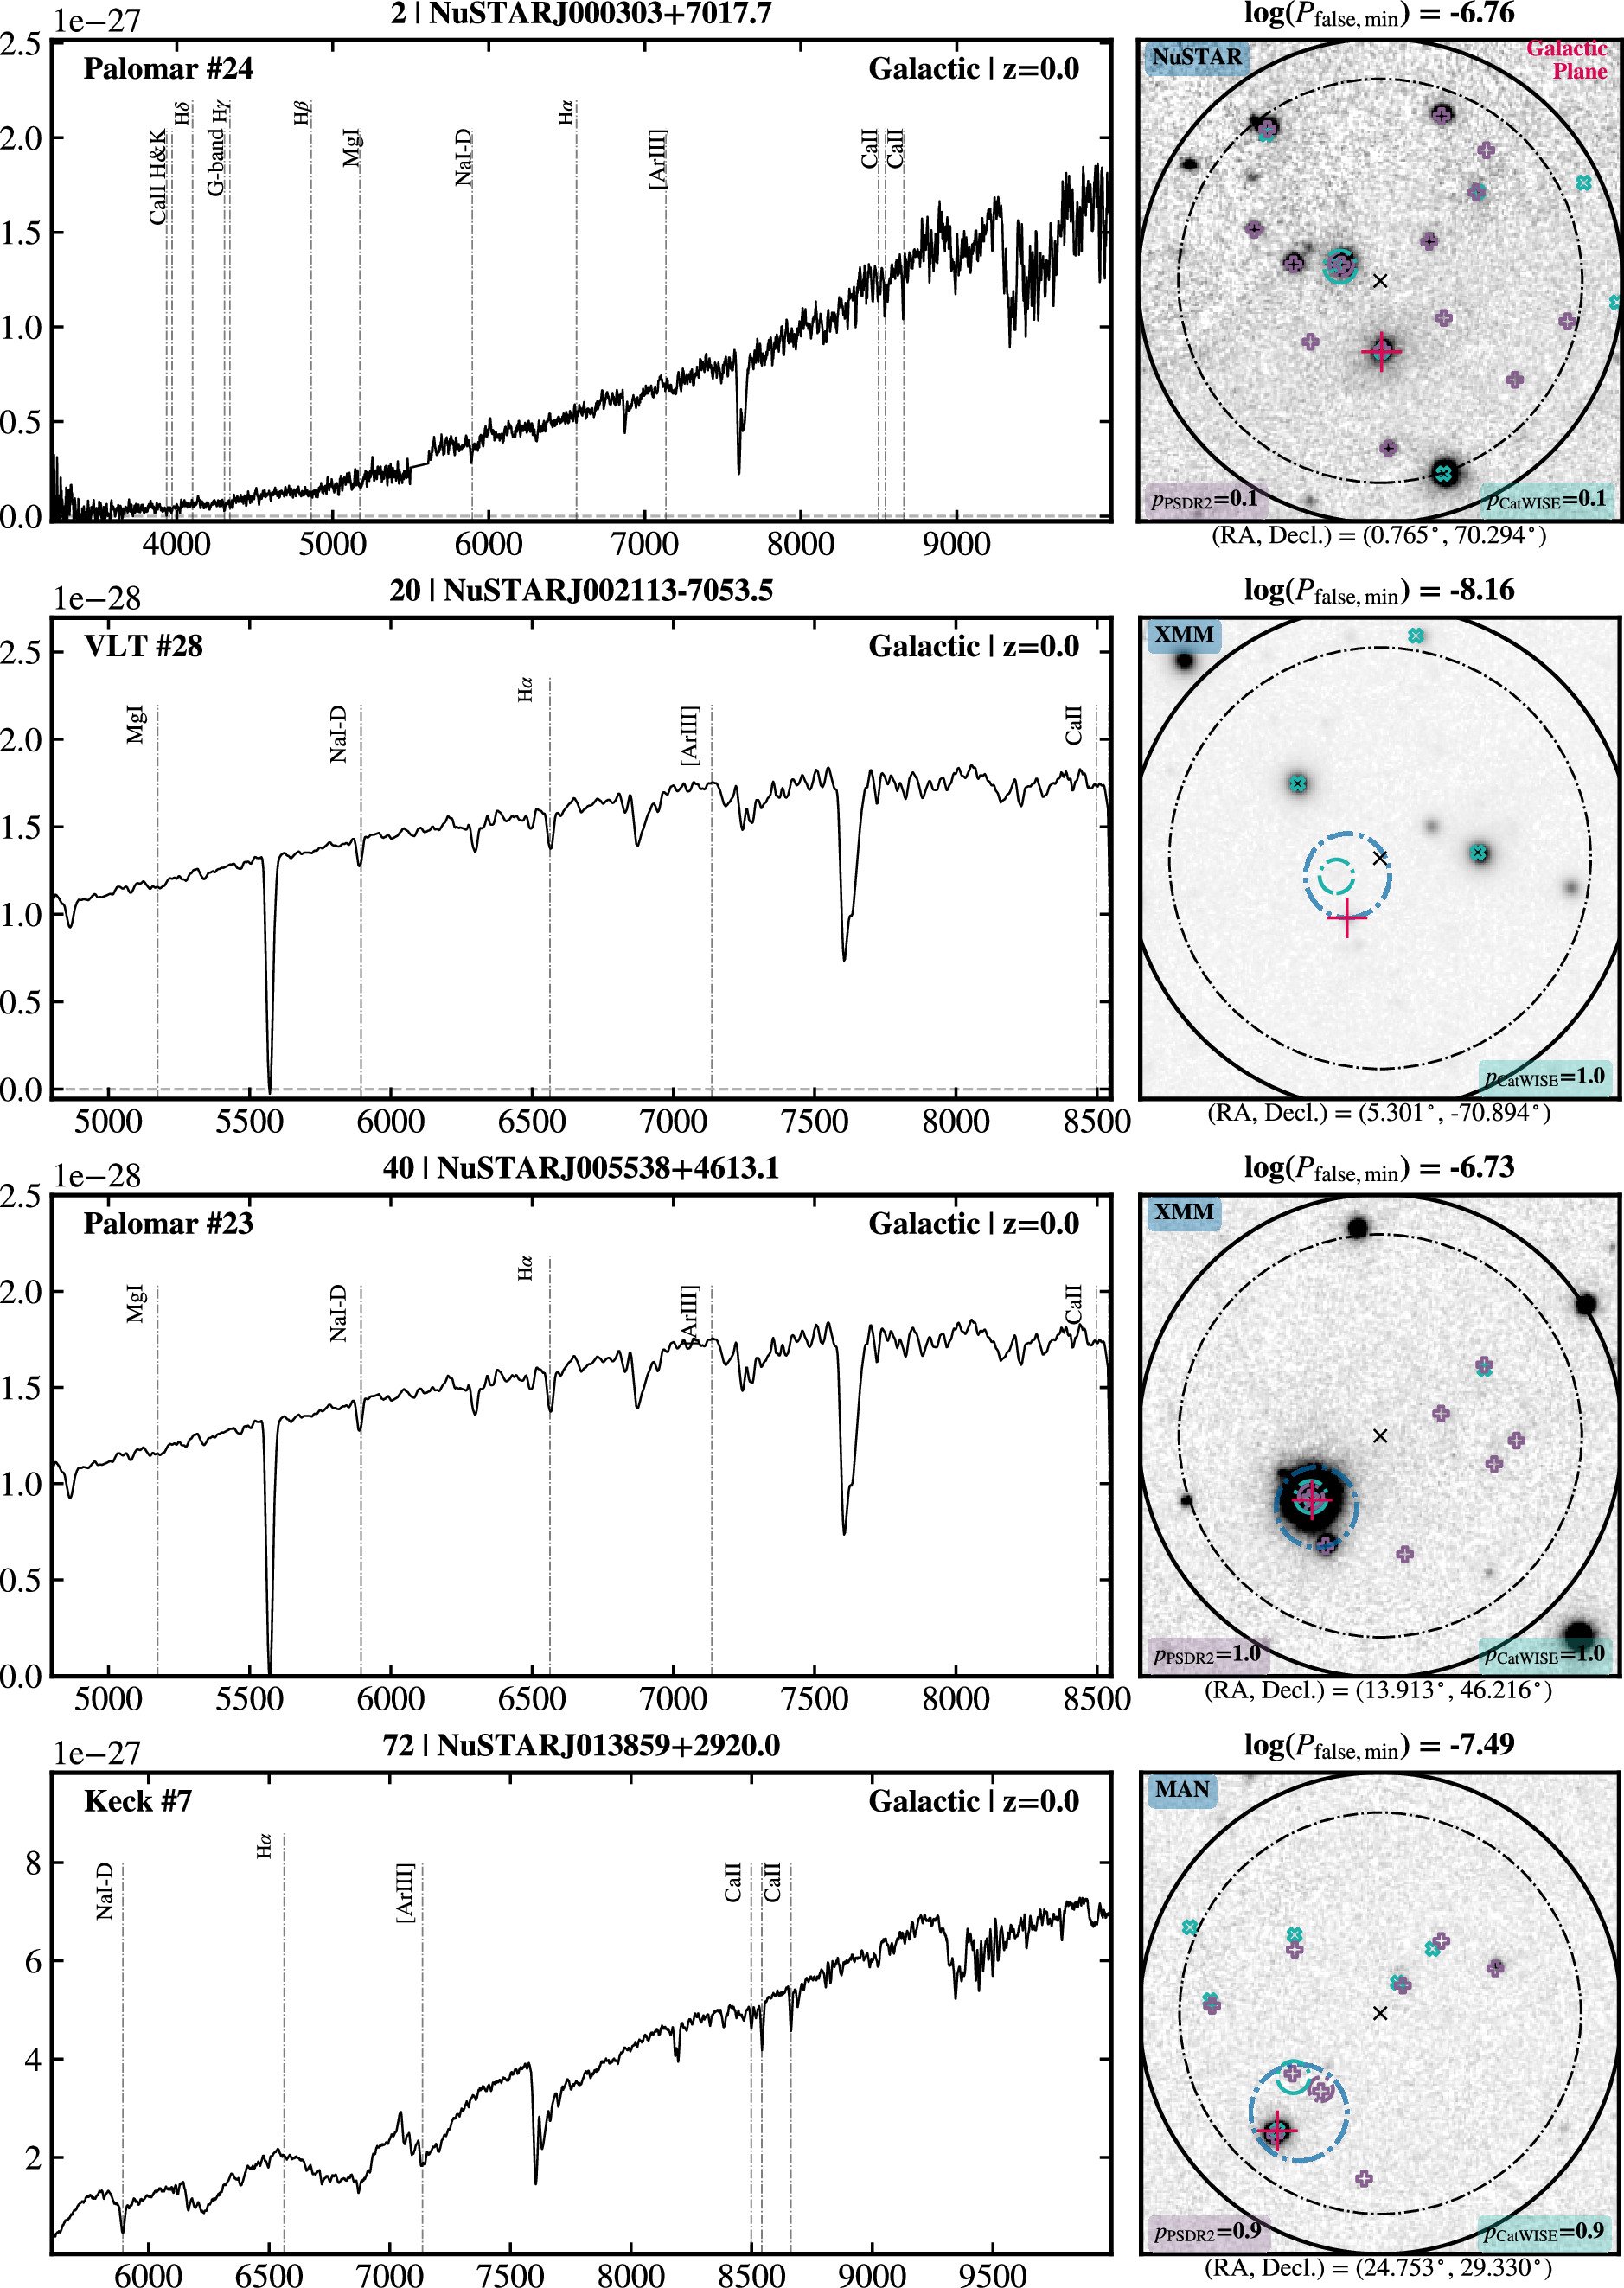
Figure E4. Optical spectra for the first four Galactic post-NSS40 sources (z = 0). The symbol key is described in Appendix E.1.
Download figure:
Standard image High-resolution image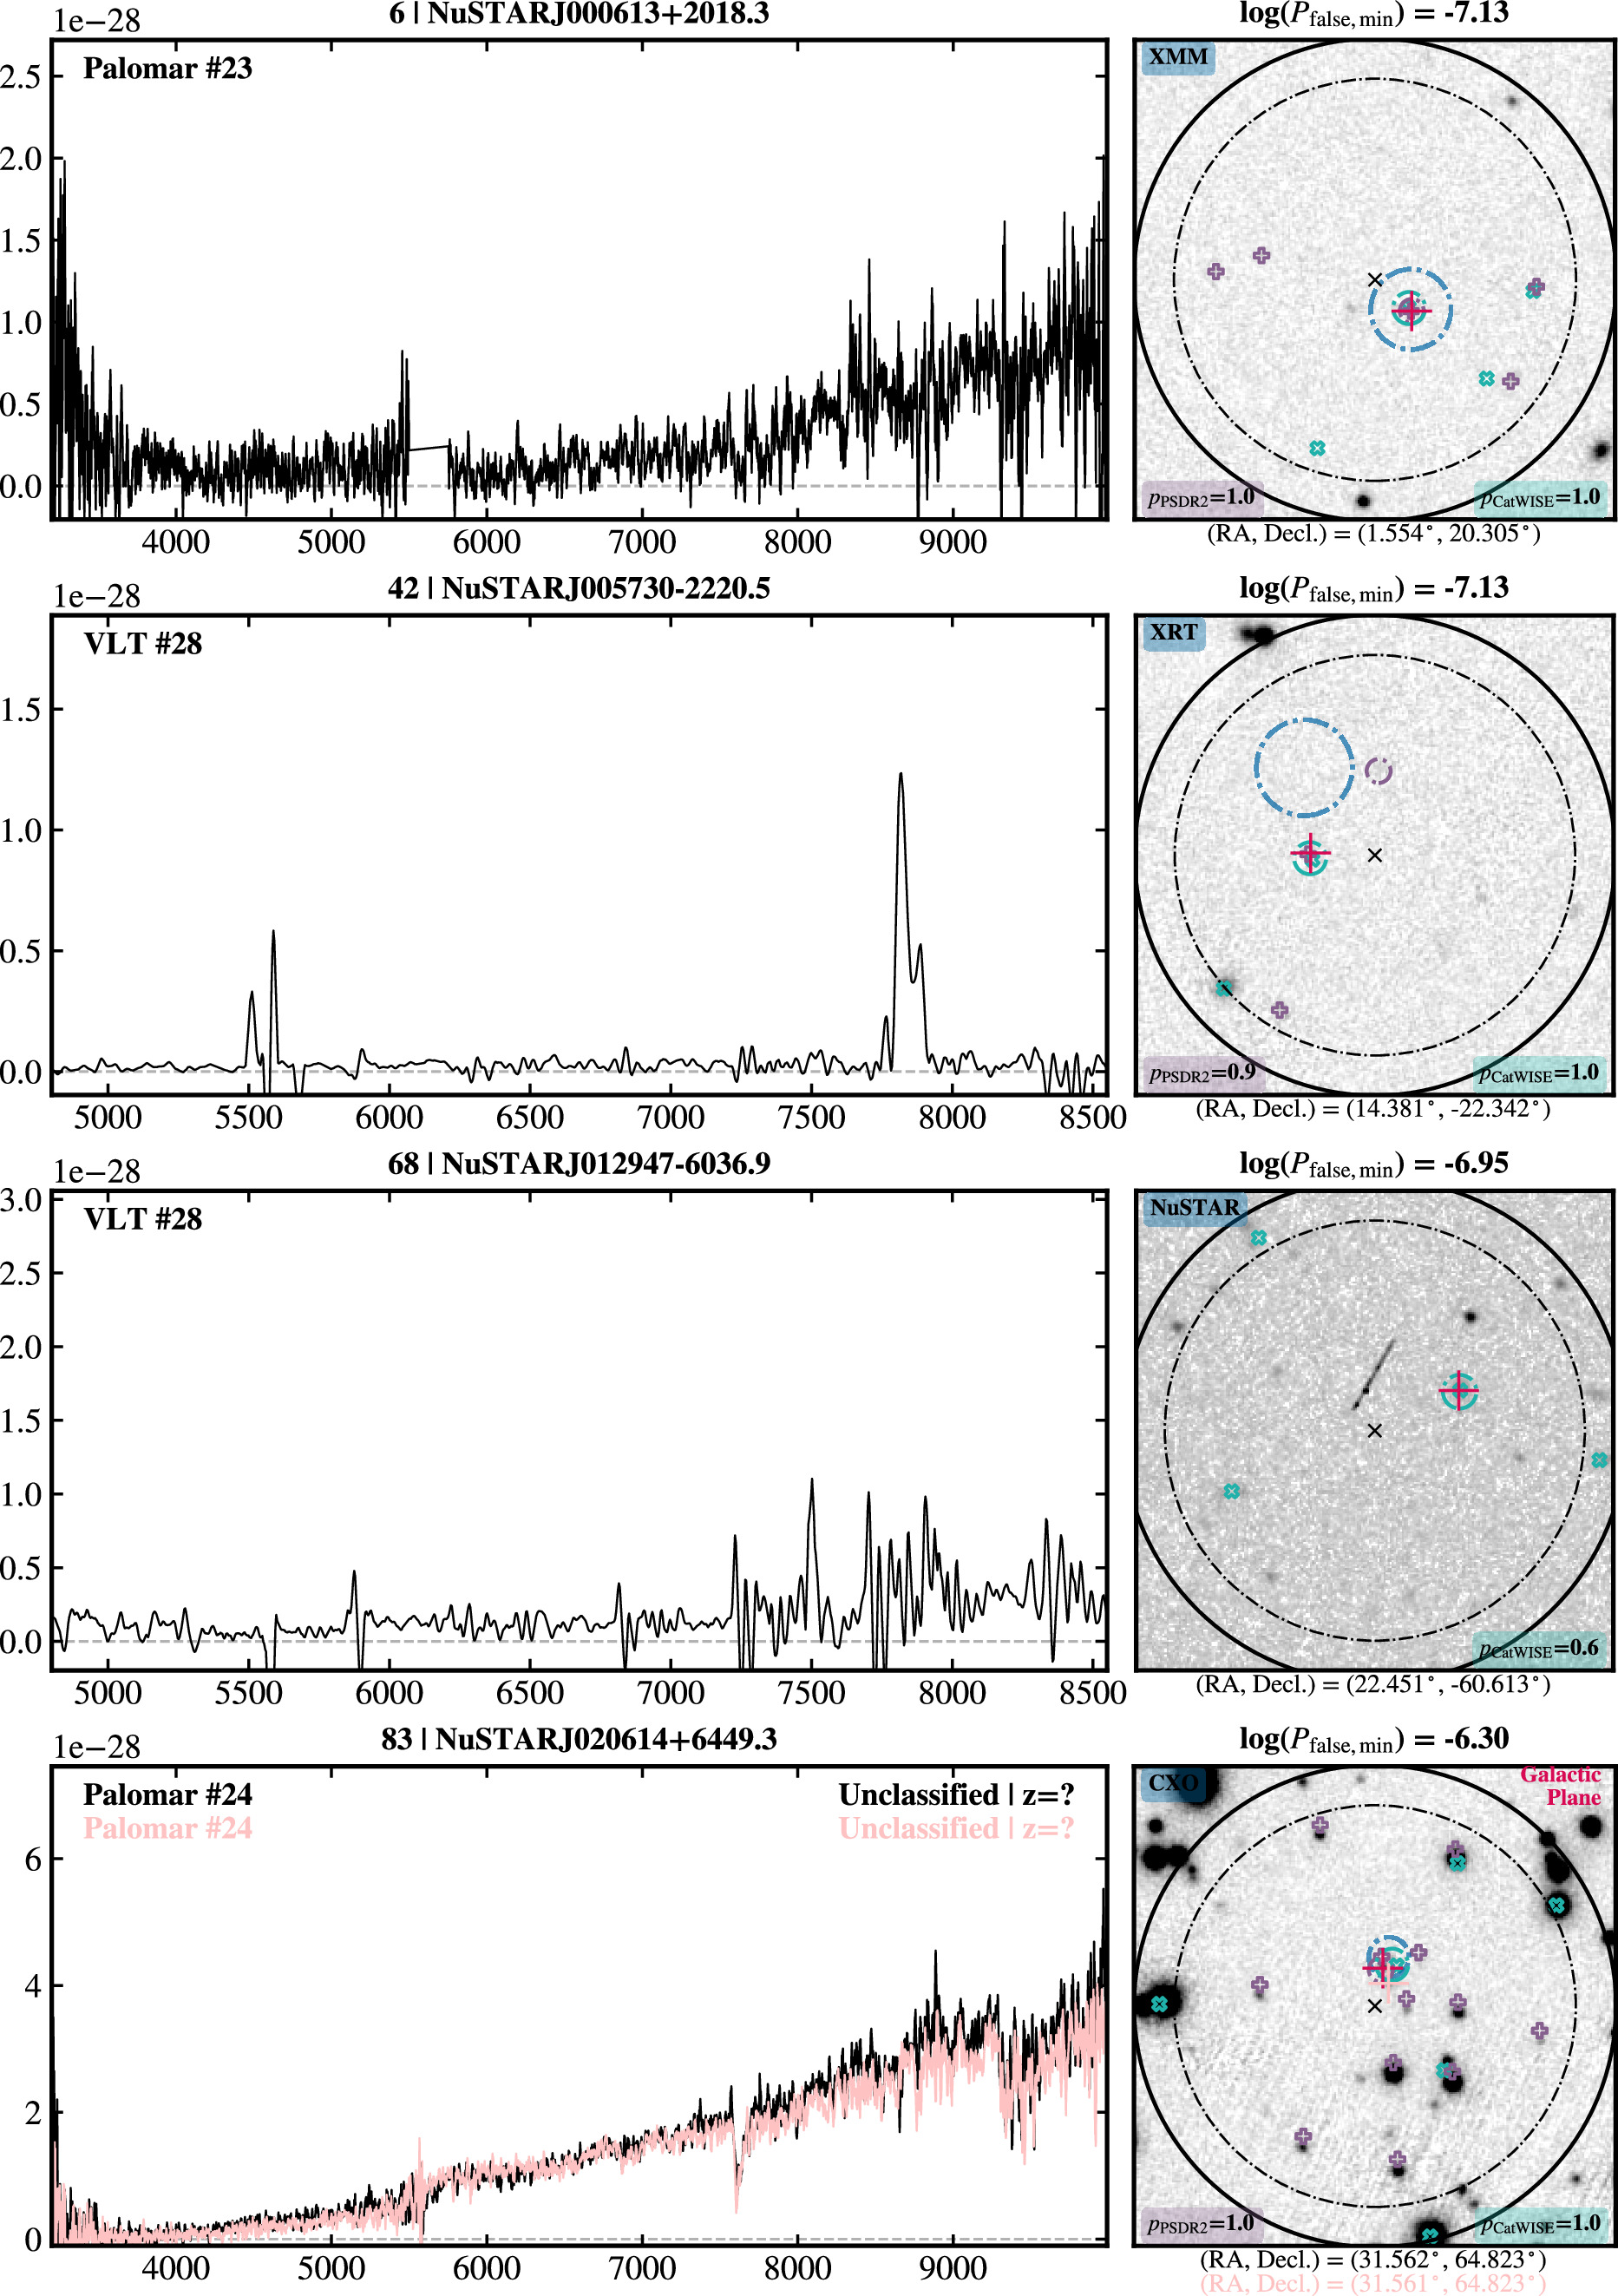
Figure E5. Optical spectra for the first four unclassified post-NSS40 sources which lacks a redshift measurement; in some cases a red faint continuum is detected. The symbol key is described in Appendix E.1.
Download figure:
Standard image High-resolution imageE.2. Optical Finding Charts for the Spectroscopic NSS40 Sources
Figure E6 shows optical finding charts for the first 12 NSS80 sources with measurements from literature. Figure E7 shows charts for the first 12 spectroscopically followed-up NSS40 sources reported in L17; the finding charts for the full sample are available online. Following the color scheme of Section E.1, all WISE detections are shown with “×” marks, and PS1-DR2 detections with “plus” marks. The NuSTAR 25″ and 30″ error circles are plotted in a dashed–dotted and solid black line, respectively. The X-ray position is marked with the respective error circle, the CatWISE20 position is indicated with a green 27 error circle, the PS1-DR2 position is shown with a purple 2″ error circle, and the spectroscopic target is marked with a red “crosshair.”
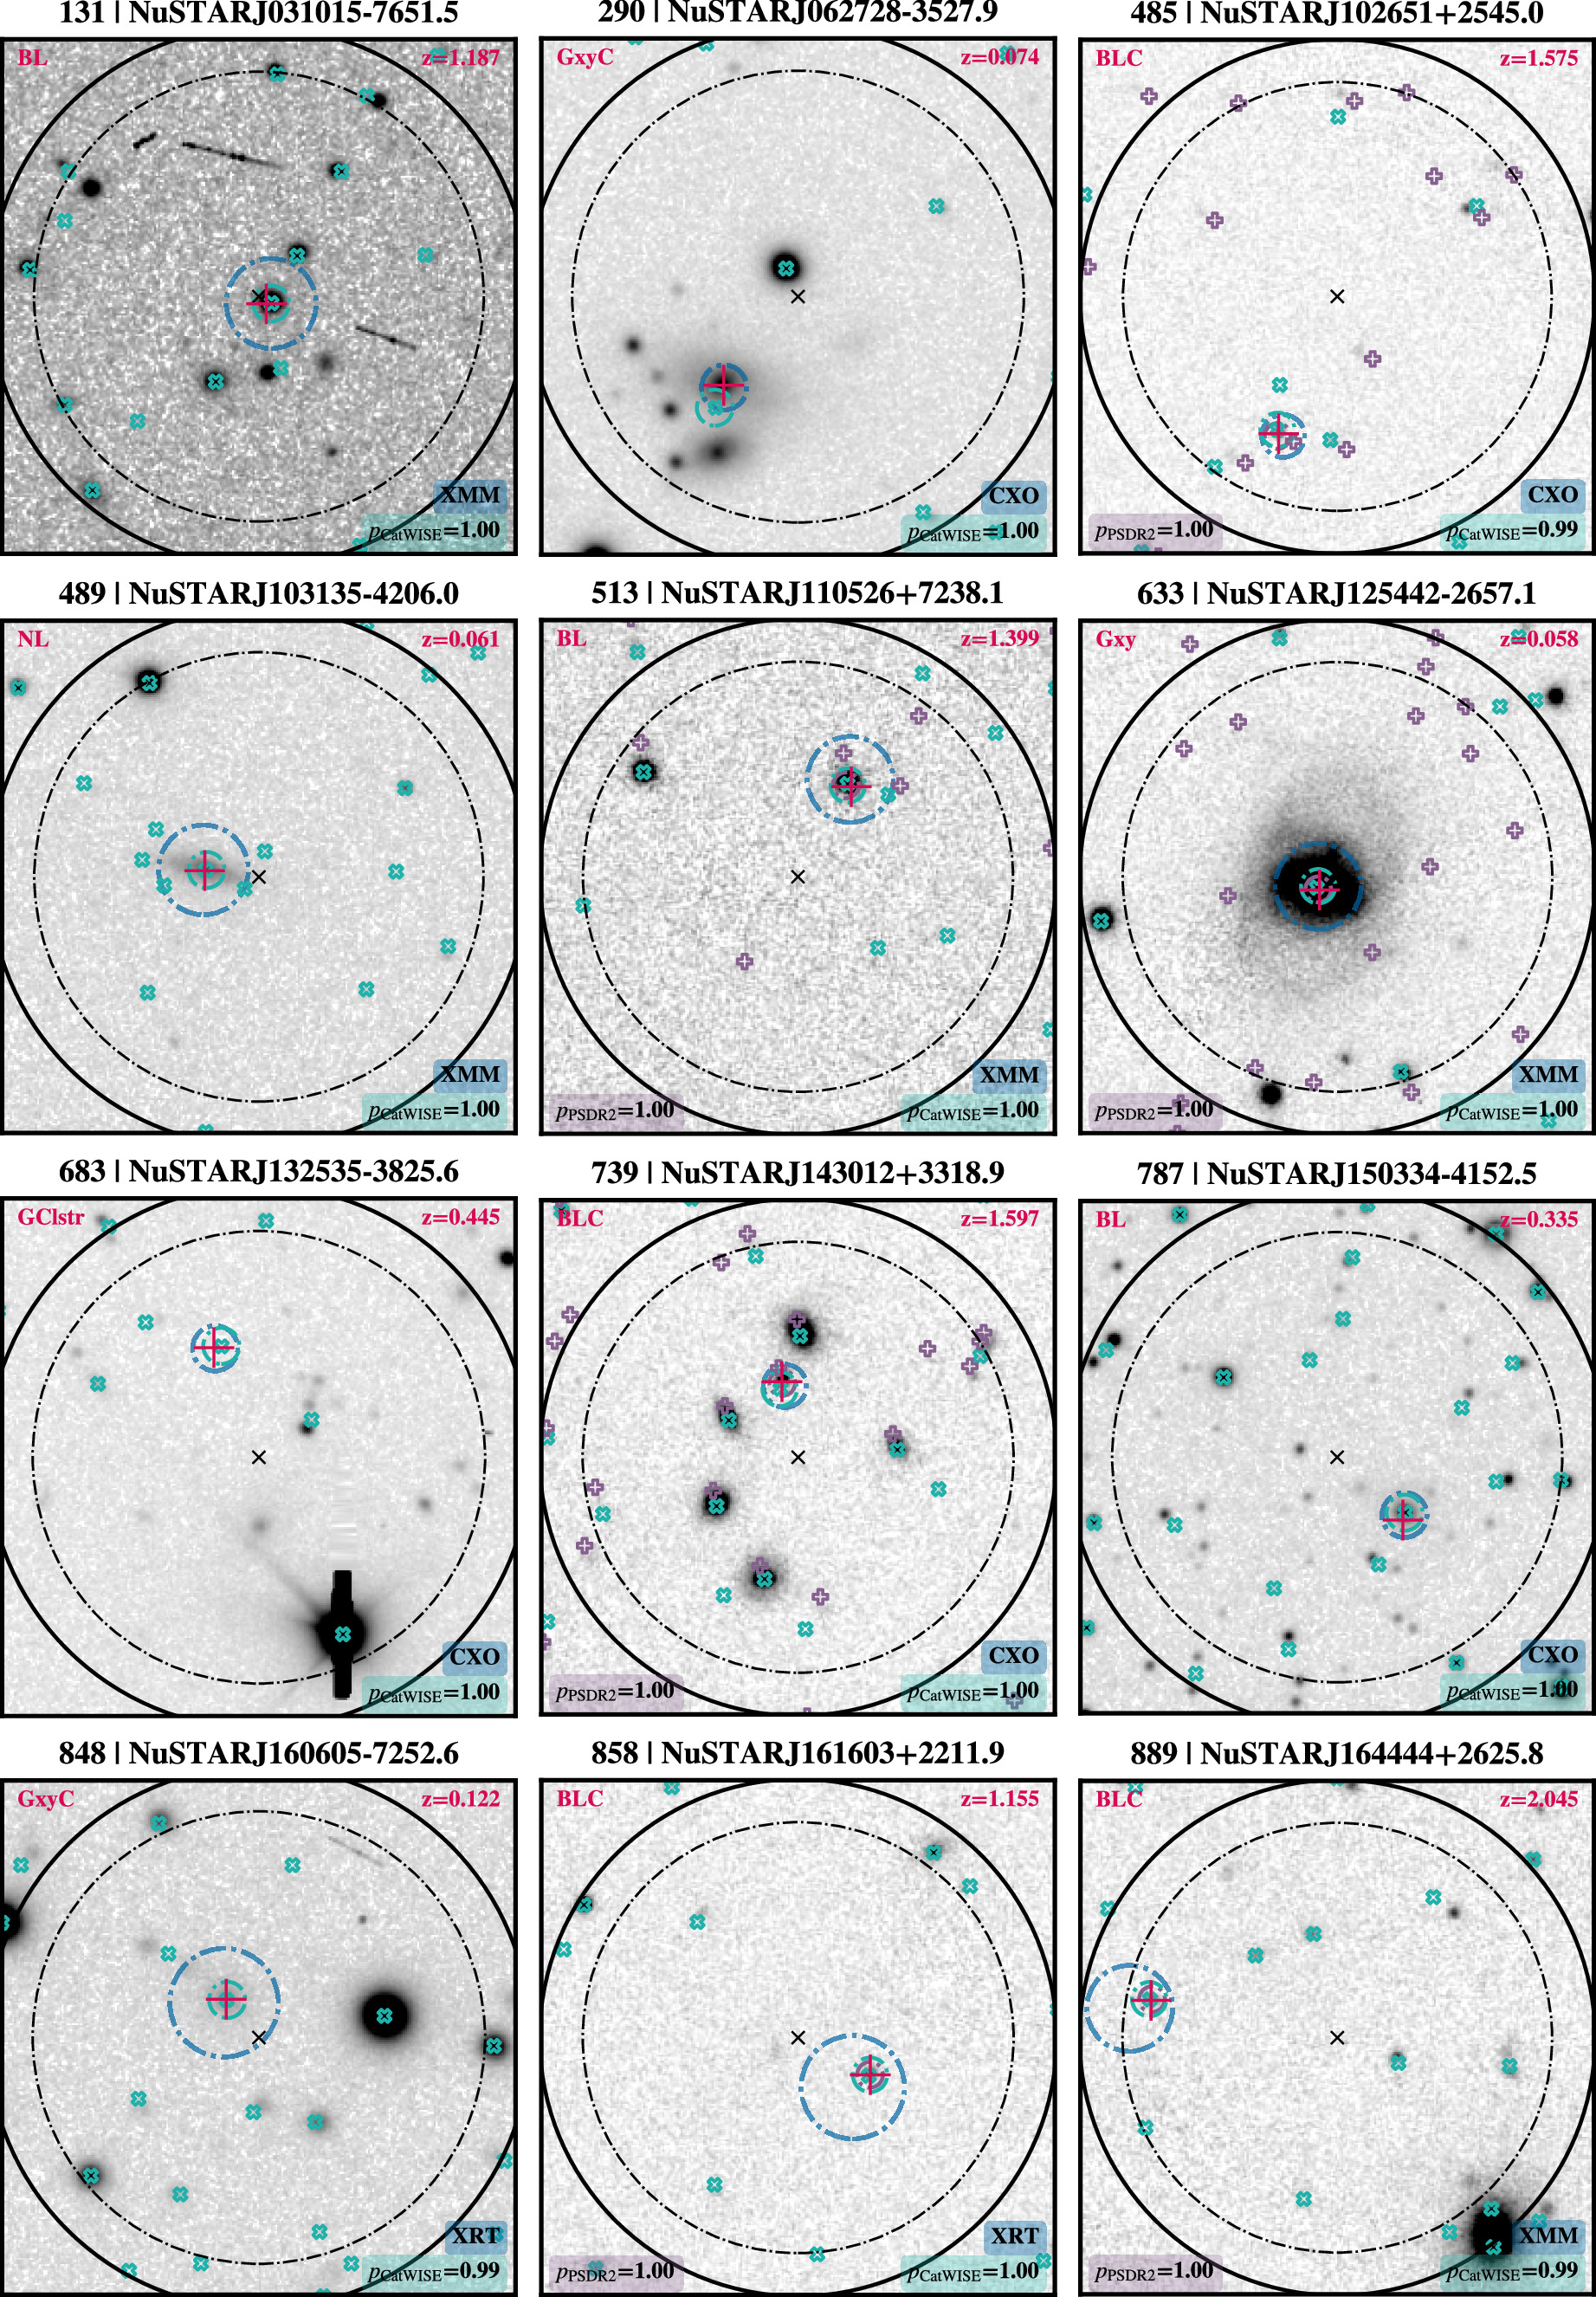
Figure E6. 30″ × 30″ finding charts for the first 12 NSS80 sources with redshift measurements from the literature. For sources with decl. > –30° Pan-STARRS i-band imaging is used, and for sources with decl. < –30° Astro Data Lab (Fitzpatrick et al. 2014; Nikutta et al. 2020) i-band imaging is retrieved. The symbol key is described in Appendix E.1. Optical classifications for sources with photometric redshifts are appended with a “C” (i.e., GxyC = galaxy candidate; BLC = BL candidate). Also identified is a galaxy cluster (GClstr) at z = 0.445.
Download figure:
Standard image High-resolution image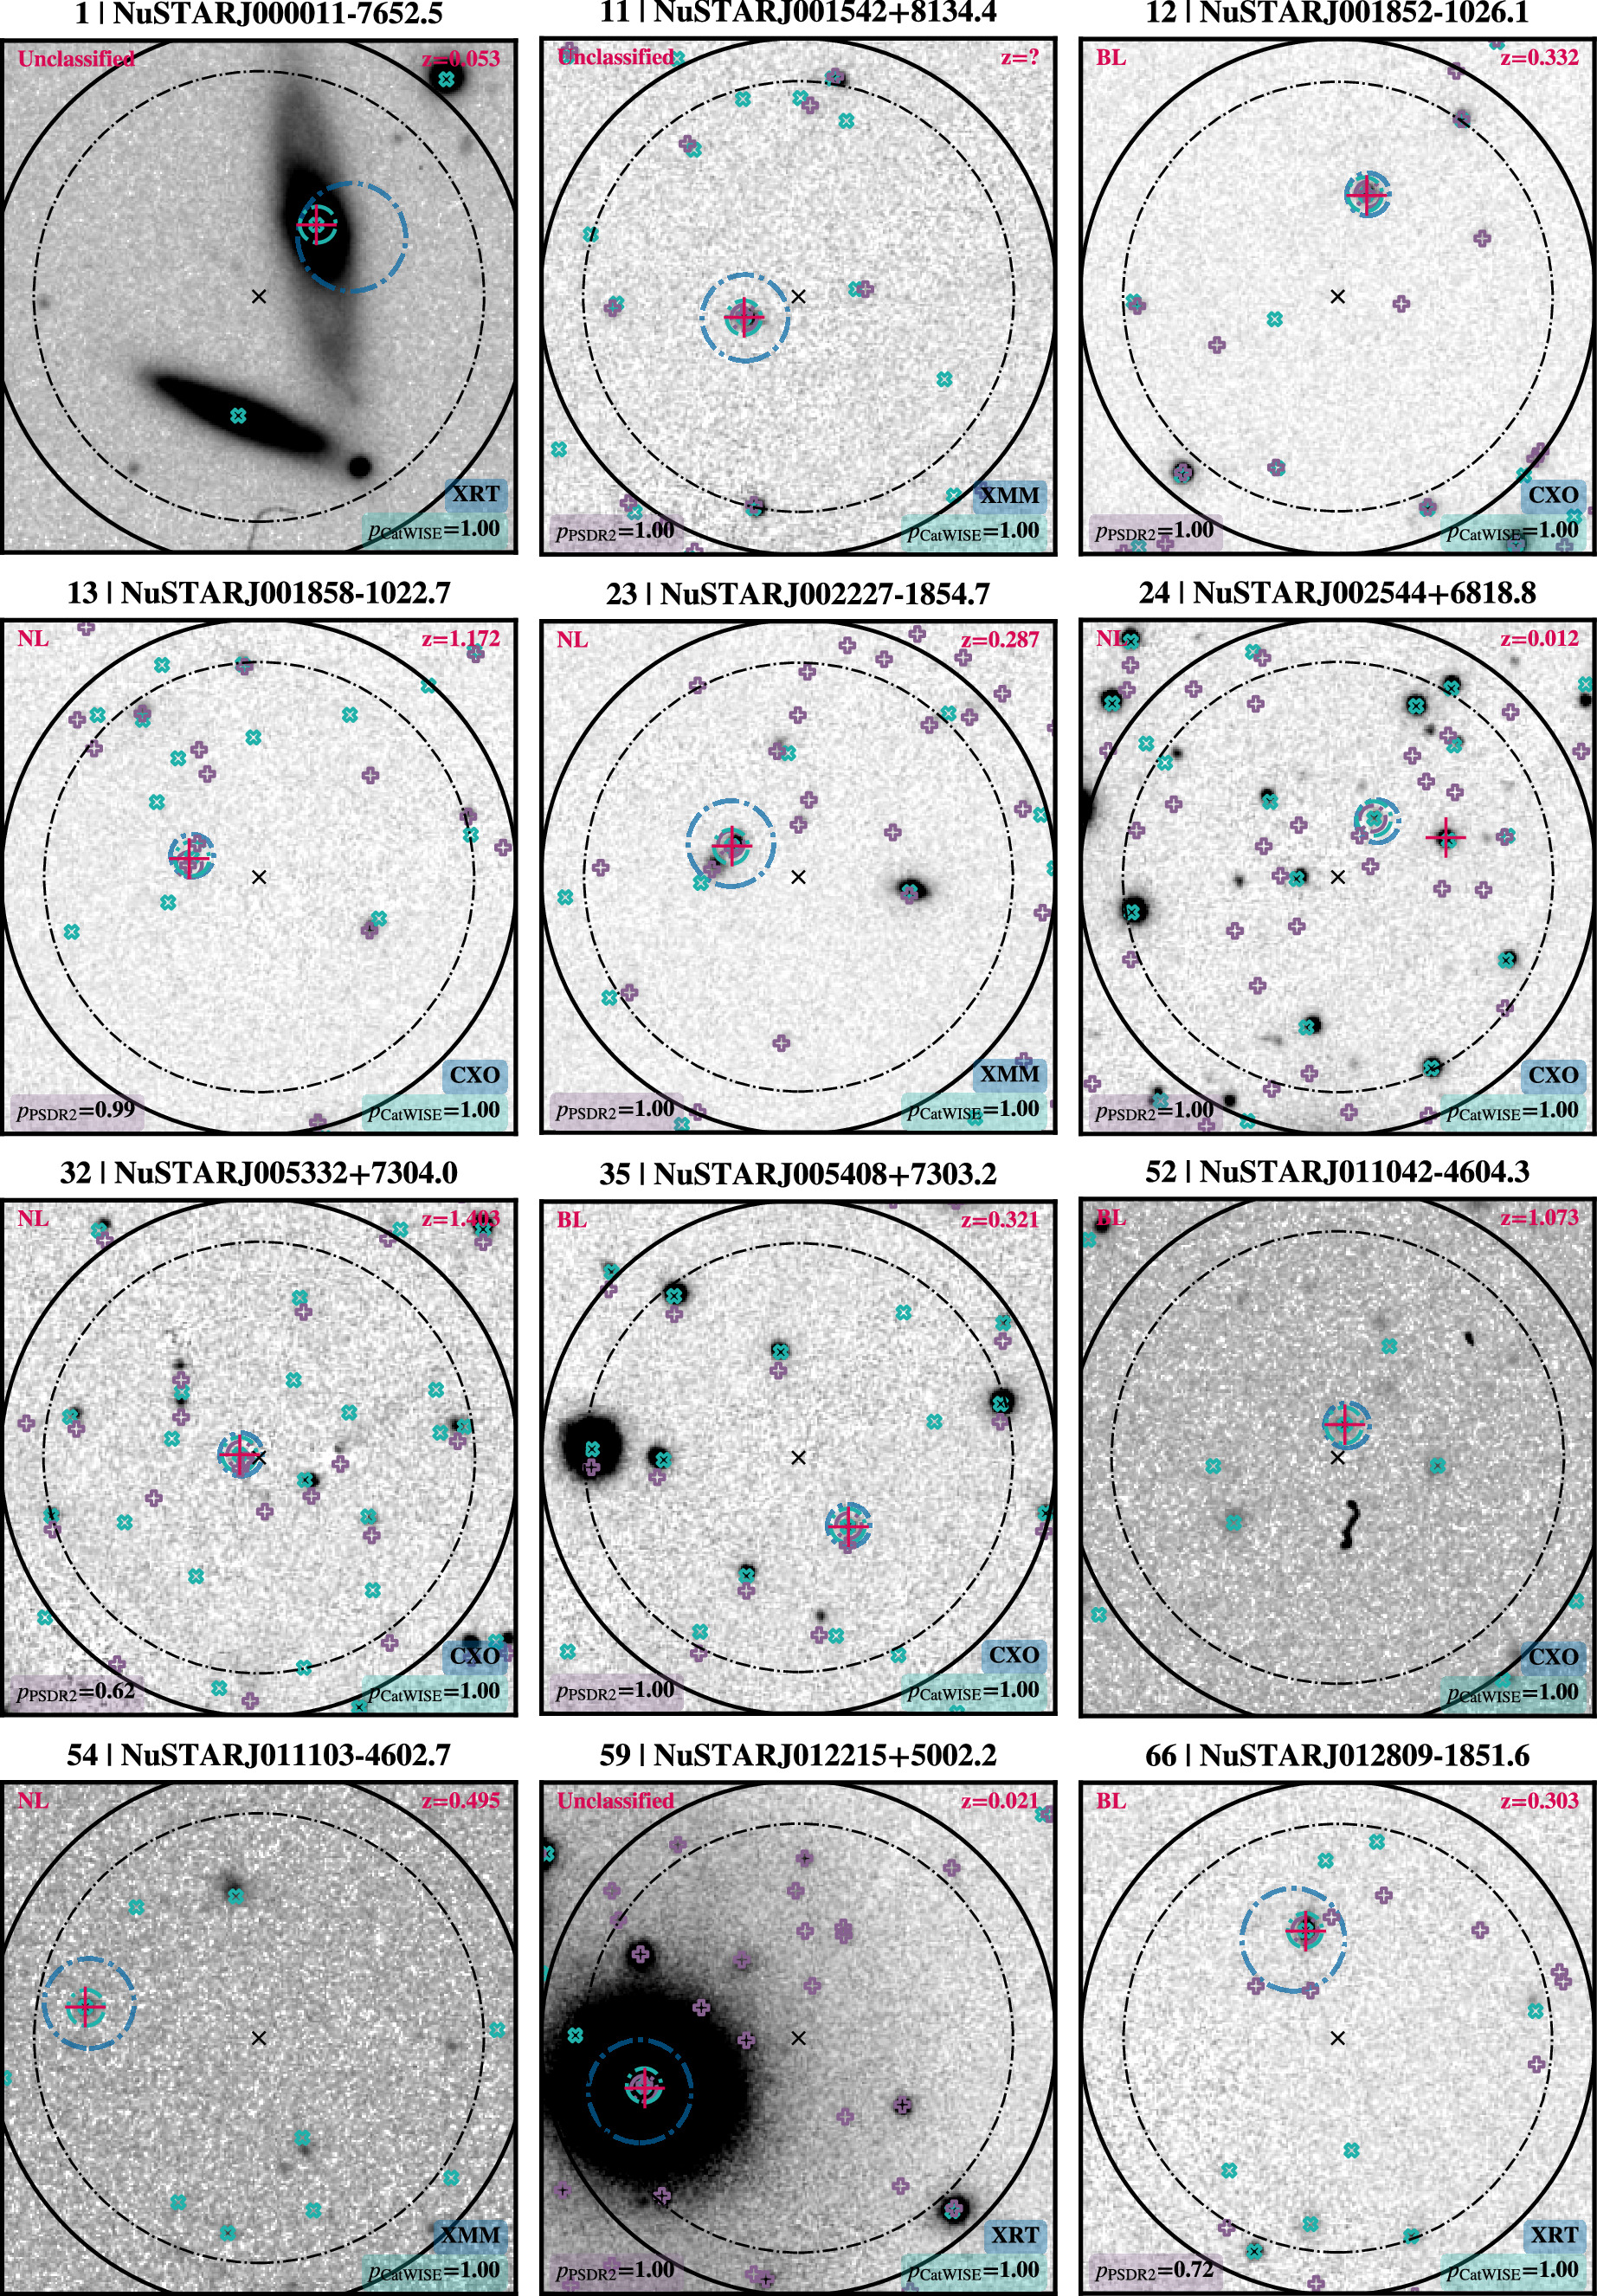
Figure E7. 30″ × 30″ finding charts for the first 12 optically followed-up NSS40 sources reported in L17. For sources with decl. > –30° Pan-STARRS i-band imaging is used, and for sources with decl. < –30° Astro Data Lab i-band imaging is retrieved. The symbol key is described in Appendix E.1.
Download figure:
Standard image High-resolution imageFootnotes
- 42
We note that, although Galactic sources are identified in the NuSTAR serendipitous survey, the majority are extragalactic; consequently, we consider NSS80 to be predominantly an extragalactic survey. See Tomsick et al. (2017, 2018) for results on Galactic sources detected in the NuSTAR serendipitous survey.
- 43
Nway provides an improvement on simple distance-based matching, using a wider array of information to find likely matches; see Salvato et al. (2018).
- 44
Adopting a broad band pass ensures that faint sources with low photon counts are still likely to be detected, compensating for the drop in sensitivity at higher energies (∼8−24 keV) due to the decrease in the effective area with increasing energy and the increased relative contribution of instrumental background compared to lower energies.
- 45
- 46
The uncombined FPMA and FPMB exposure maps are useful to access regions of excess background contamination; see lower panel of Figure 3.
- 47
Regions close to the edge of the field of view, with <10% of the maximum exposure in the 3–24 keV band, and thus where the background is poorly characterized, are excluded from the source-detection process and estimates of survey area coverage.
- 48
As in L17, final source positions are (in order of priority) full band, soft band, then hard band.
- 49
The aperture background refers to unfocussed X-rays that pass between the optics and the focal plane i.e., enter via the unbaffled “sides” of the telescope (see Wik et al. 2014, for further detail).
- 50
- 51
The eight manually measured lower-energy X-ray positions are used only to identify multiwavelength counterparts, but are excluded from all further X-ray analysis.
- 52
We estimated the conversion factors in WebPIMMS for a Galactic absorption of NH = 0 and a photon index of Γ = 1.8.
- 53
For the 2SXPS sources, we calculated the soft-band flux using the available band 3 count rate (2–10 keV).
- 54
We note that some of these sources may represent the small fraction of expected false associations between soft X-ray and NuSTAR sources.
- 55
For sources at lower decl. no optical matching was performed with Nway. Instead, we performed positional crossmatching to other optical catalogs; see case (ii) for selection of principal counterparts later in this section for details.
- 56
This matching radius is increased to 40″ (as compared to matching with soft X-ray sources within 30″) to include all potential matches to soft X-ray counterparts, which could be offset by as much as 30″.
- 57
pbest is the relative probability that each potential counterpart is correct; it assumes that one of the matches found is correct. pany provides the probability that any one of the potential counterparts is correct. pbest is therefore equivalent to adopting pi (Salvato et al. 2018) as the best potential counterpart to each NSS80 source.
- 58
Each most probable PS1 Nway match is kept in the catalog (regardless of whether it is selected as the principal counterpart), and they are found in the columns with the suffix -PS1 (columns 119–132).
- 59
Counterpart information in the catalog has the suffix -cpart (columns 134–146).
- 60
The majority of these have a greater than 30% CatWISE20 match probability, pCAT,best.
- 61
A PS1-NWAY match within 2
- 62
These numbers can be found for any label by filtering the catalog on the column "OOrig_cpart."
- 63
The number of sources matched to other catalogs in this step are SDSS (2), NSC2 (200), DES2 (6), and USNOB1 (5).
- 64
Sources which lack an optical counterpart may do so because their counterpart is faint/distant.
- 65
All Pan-STARRS magnitudes quoted in the NSS80 catalog are, in order of preference, Kron, PSF, or the default aperture magnitudes. These are flagged in the columns “mag_type_PS1” and “mag_type_cpart” for Nway and selected counterpart magnitudes, respectively. The Kron magnitudes are better for extended sources, which would constitute the larger number of counterparts for the NuSTAR serendipitous survey given their apparent redshift distributions. Thus, if a Kron magnitude is available, it is used, and if not we check for the other types. If users perform a detailed study on individual sources, we advise a check that the magnitude is appropriate for their application.
- 66
Keck/LRIS is a double spectrograph, consisting of a blue and red channel. However, only the grating angle on the red side is adjustable, while the blue side grism is fixed.
- 67
Dithering is important for fringing corrections, especially at longer wavelengths for standard CCD arrays such as SALT/RSS and VLT/FORS2. Keck/LRIS and Palomar/DBSP, on the other hand, have thick, red-sensitive CCDs on their red arms, which have negligible fringing.
- 68
See “User's Guide to Reducing Slit Spectra with IRAF016,” available online at http://www.mn.uio.no/astro/english/services/it/help/visualization/iraf/spect.pdf.
- 69
Hinton et al. (2016) compiled the library of templates from runz (originally developed for the use of the 2dF galaxy redshift survey; Colless et al. 2001) and autoz with original templates from 2dF (Colless et al. 2001), WiggleZ (Drinkwater et al. 2010), the Gemini Deep Survey (Abraham et al. 2004), SDSS DR2 (SubbaRao et al. 2002), and galaxy eigenspectra from Bolton et al. (2012).
- 70
The individual spectroscopic data for each followed-up NSS80 source will be made available at https://www.nustar.caltech.edu/page/59.
- 71
Flagged with our optical masking as within the radius of an Abell cluster.
- 72
BRNu is calculated as in Lansbury et al. (2017b). Where both hard and soft count rates have defined values, uncertainties are propagated as standard. Where one is an upper limit, the resulting BRNu is thus an upper/lower limit and if both are upper limits the value is undefined. These are flagged as described in Appendix A.
- 73
If we instead choose a photon index closer to the median of this sample, the resulting change in luminosity is not large. For example, a decrease in Γeff from 1.8 to 1.5 causes a small increase of ∼10% in 10−40 keV luminosity, assuming median redshift and 3−24 keV flux.
- 74
- 75
- 76
As can be seen in Figure 29, the g − i color distribution changes with redshift as different portions of the quasar and host-galaxy emission enter the observed-frame optical bands. Consequently, we only consider the optical color of the sources with a reliable counterpart and redshift. We note that the redshift and luminosity distributions of the subset of BL sources with measured g − i color are similar to the distributions for all BL sources and can therefore be considered representative.
- 77
We can use the NSS80 BL AGNs as a quasar sample since they have spectral lines with widths FWHM ≳ 1000 km s−1.